Week 9 - Parametric study on Gate valve.
Aim:- The Aim of this report is to understand the impact of valve opening on the mass flow rates. Subsequently we also intend to calculate the flow coefficient and flow factor.
Meaning of Parametric Study:- A parametric analysis or sensitivity analysis is the study of the influence of different geometric or physical parameters or both on the solution of the problem. In this problem we vary the lift to between 10% to 80% of the total Valve opening and study the impact on mass flow rate at the outlet.
Introduction:- Valves are used primarily to regulate the flow of fluid.A gate valve is generally used to completely shut off fluid flow or, in the fully open position, provide full flow in a pipeline. Thus it is used either in the fully closed or fully open positions. A gate valve consists of a valve body, seat and disc, a spindle, gland, and a wheel for operating the valve. The seat and the gate together perform the function of shutting off the flow of fluid.
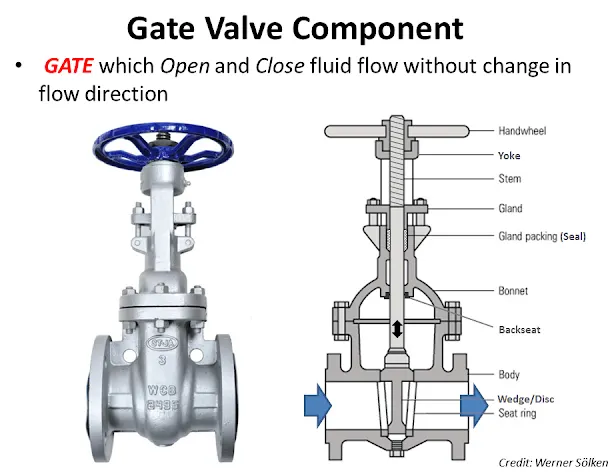
Valve Coefficient:-
Valve Flow Coefficient (Cv) is a valve’s capacity for a liquid or gas to flow through it. It is technically defined as “the volume of water at 60°F (in US gallons) that will flow through a valve per minute with a pressure drop of 1 psi across the valve.” It is calculated using the below equation.
`C_v=Qsqrt((SG)/(DeltaP)`
Q is the rate of flow (expressed in US gallons per minute),
SG is the specific gravity of the fluid (for water = 1),
ΔP is the pressure drop across the valve (expressed in psi).
The Metric equivalent is called Flow factor given below
`K_v=Qsqrt((SG)/(DeltaP)`
Q= FLow rate exppressed in m^3/hr
SG is the specific gravity of the fluid (for water = 1),
ΔP is the pressure drop across the valve (expressed in Pa).
Steps followed for simulation
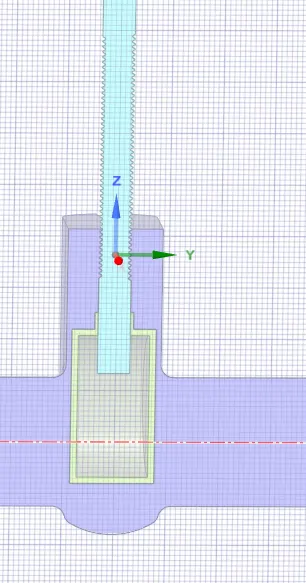
a) Creation of Geometry:- i) The fluid volume was extracted.
ii) The valve spindle lift was set to 13.75 mm and it was parametrized.
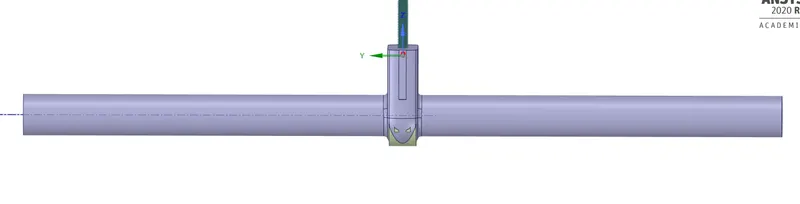
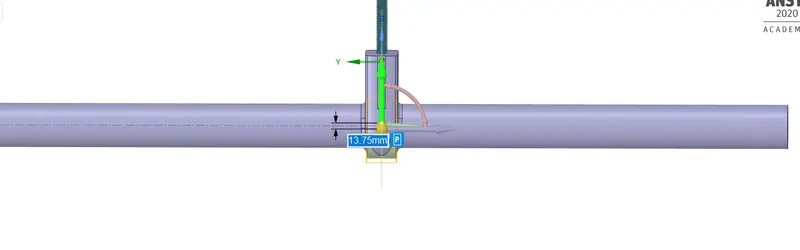
b) Creation Mesh :- A default mesh was generated. The number of nodes were 28997 and no of elements were 138586. A named selection was created to name the inlet and outlets.
c) Setup:- i) Solver_ Pressure Based, Velocity Formulation Absolute Gravity enable in the Z direction.
ii) Viscous Model- k-epsilon,Realizable and Scalable wall function.
iii) Material was chosen to be Water (liquid)
iv) Boundary Condition:- a) Inlet was set to pressure inlet Gage pressure 10 pa.
b) Outlet- Pressure outlet
v) Solution was initialized using Standard Initialization
d) Setting of Design points:- The total depth of the gate valve was measured to be 138 mm and this constitutes the maximum lift. The values for 10% to 80% of lift was computed from this maximum lift. The design points chosen were
| Name | Percentage opening | Lift Value |
| DP 0 | 10 | 13.75 |
| DP 1 | 20 | 27.6 |
| DP 2 | 30 | 41.4 |
| DP 3 | 40 | 55.2 |
| DP 4 | 50 | 69 |
| DP 5 | 60 | 82.8 |
| DP 6 | 70 | 96.6 |
| DP 7 | 80 | 110.4 |
Results
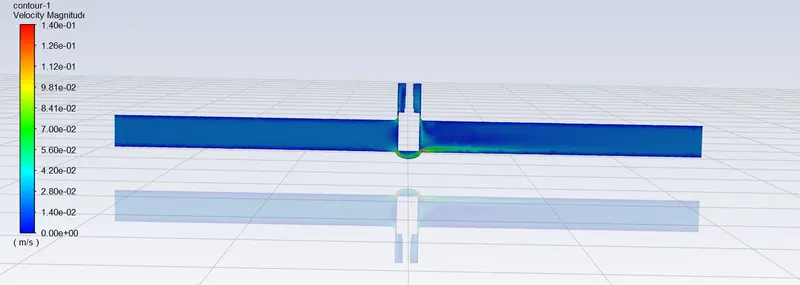
1) 10% Opening
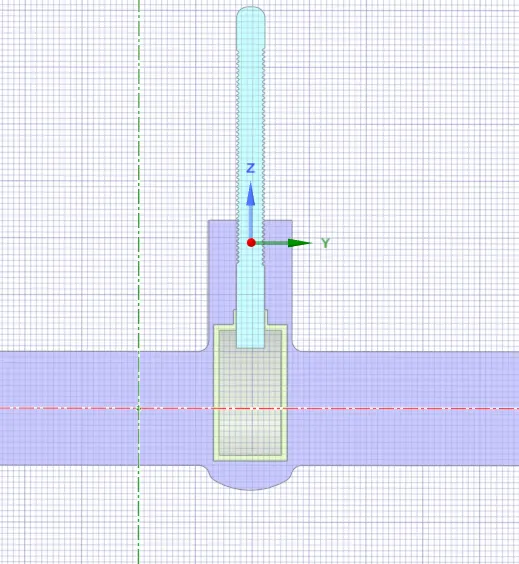
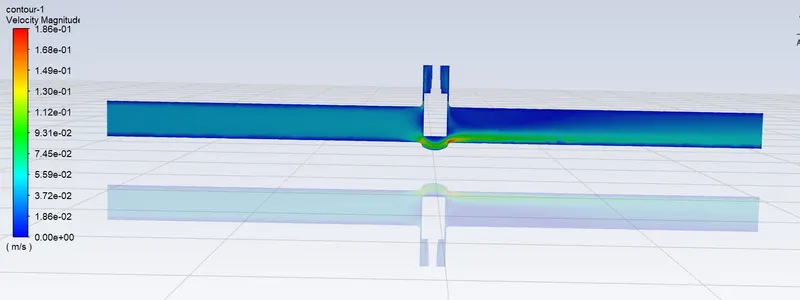
2) 20% Opening
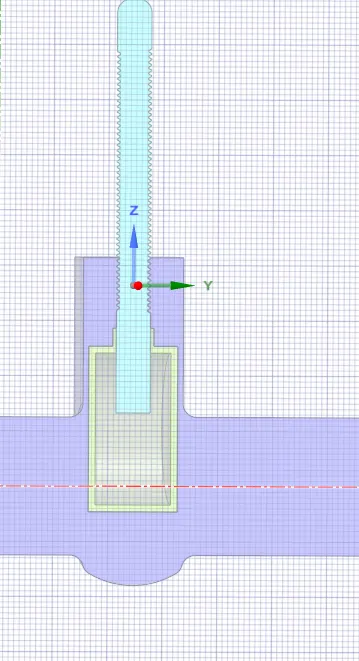
3) 30% Opening
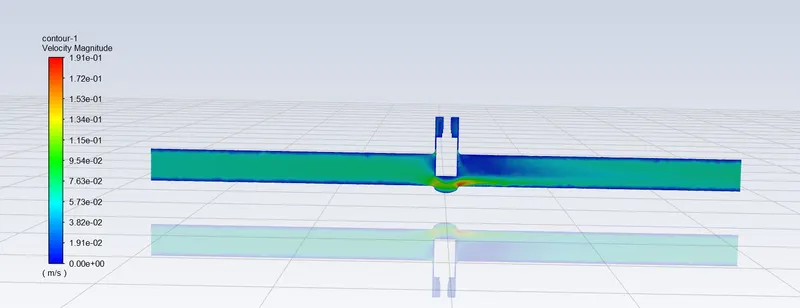
4) 40% Opening
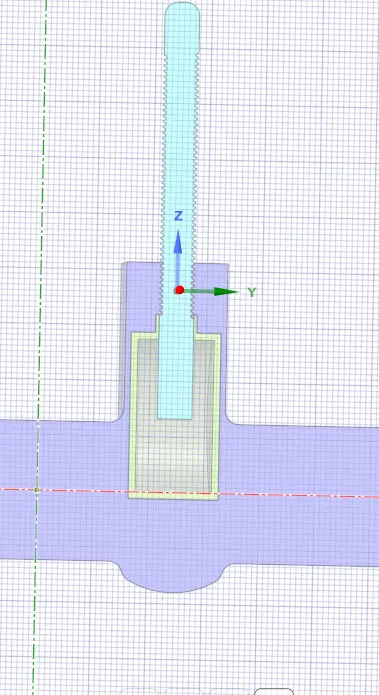
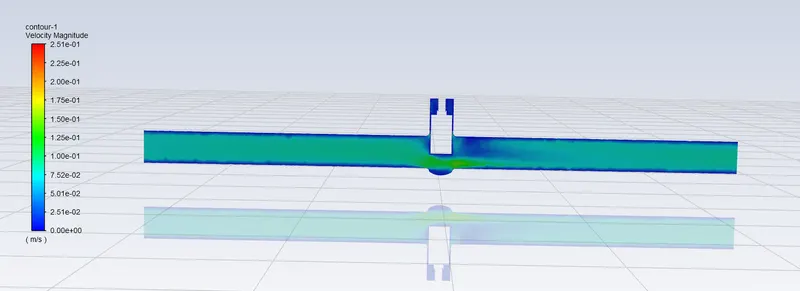
5) 50% Opening
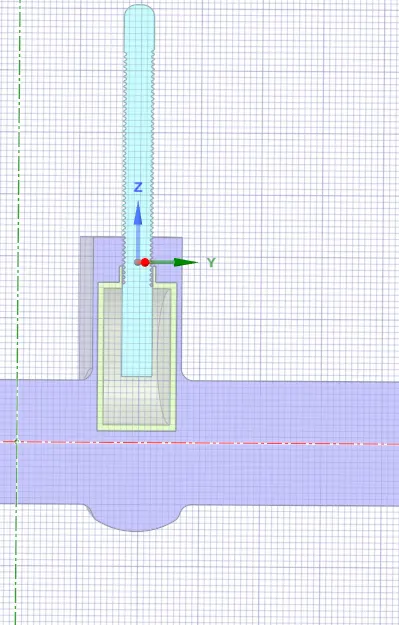
6) 60% Opening
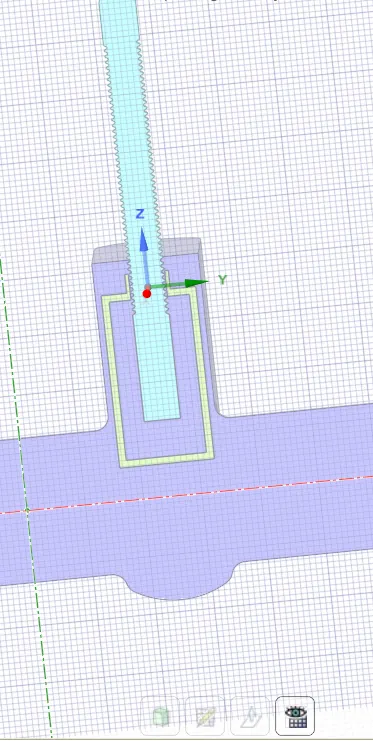
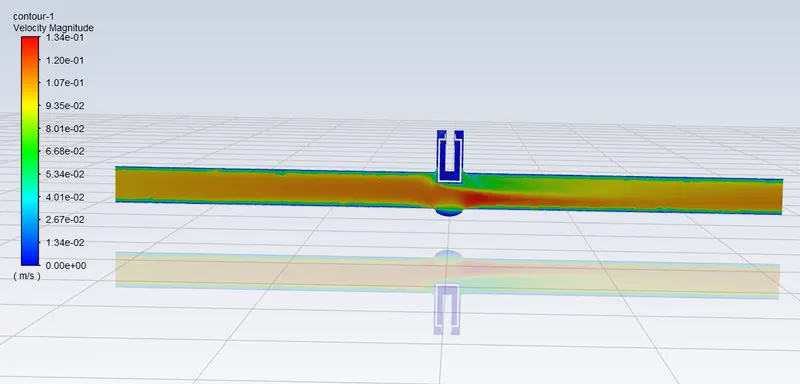
7) 70% Opening
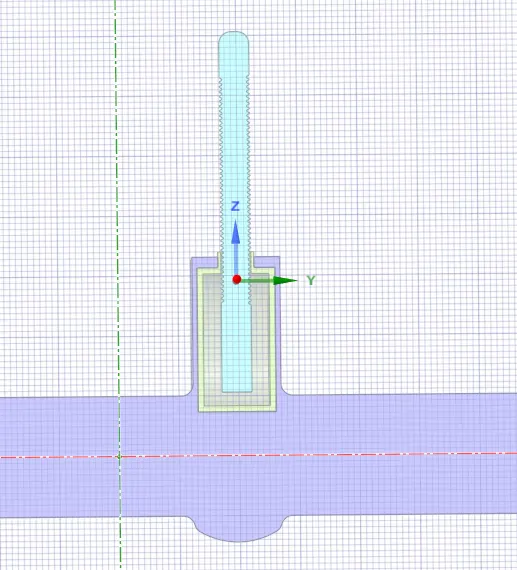
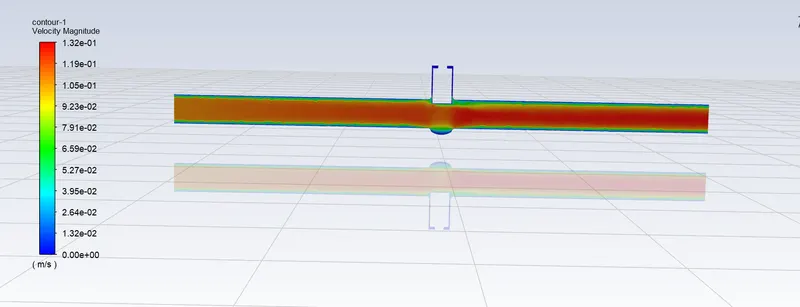
- Calculation of Mass flow rate , Flow coefficient and Flow Factor
| Name | Percentage opening | Valve Lift | Mass flow rate | delta P (Pa) | delta P (bar) | delta P (Psi) | Flow rate in US gpm | Flow Coefficient Cv(gpm/psi) | Q m^3/hr | Flow Factor Kv(m^3h^-1) | Percentage change in mass flow rate with Valve opening |
| DP 0 | 10 | 13.75 | -0.12 | 10.00 | 0.00 | 0.00 | 1.85 | 48.63 | 0.42 | 42.06 | |
| DP 1 | 20 | 27.60 | -0.26 | 10.00 | 0.00 | 0.00 | 4.10 | 107.67 | 0.93 | 93.14 | 121.41 |
| DP 2 | 30 | 41.40 | -0.45 | 10.00 | 0.00 | 0.00 | 7.07 | 185.76 | 1.61 | 160.68 | 72.52 |
| DP 3 | 40 | 55.20 | -0.60 | 10.00 | 0.00 | 0.00 | 9.48 | 248.98 | 2.15 | 215.36 | 34.03 |
| DP 4 | 50 | 69.00 | -0.70 | 10.00 | 0.00 | 0.00 | 11.09 | 291.15 | 2.52 | 251.84 | 16.94 |
| DP 5 | 60 | 82.80 | -0.78 | 10.00 | 0.00 | 0.00 | 12.41 | 325.98 | 2.82 | 281.97 | 11.96 |
| DP 6 | 70 | 96.60 | -0.83 | 10.00 | 0.00 | 0.00 | 13.23 | 347.48 | 3.01 | 300.57 | 6.60 |
| DP 7 | 80 | 110.40 | -0.85 | 10.00 | 0.00 | 0.00 | 13.46 | 353.50 | 3.06 | 305.78 | 1.73 |
Plots for variation in mass flow rate at the outlet with increase in valve opening
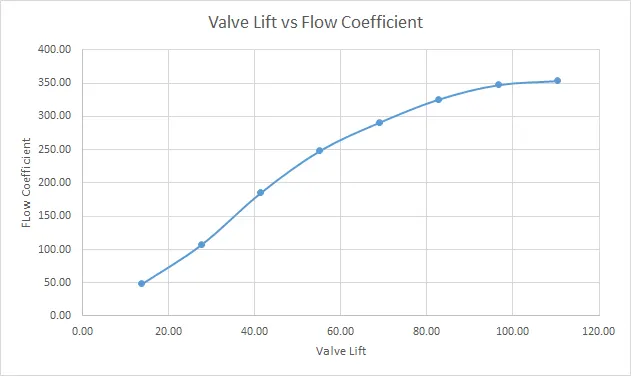
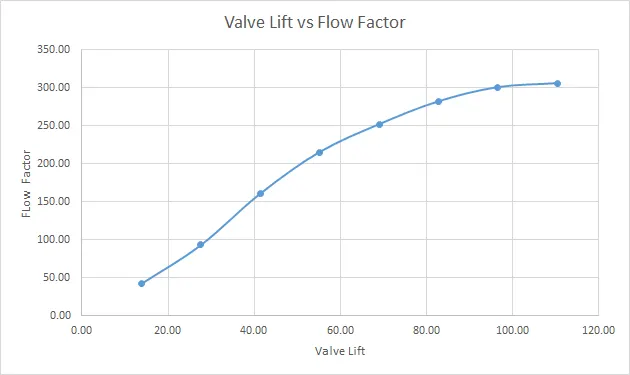
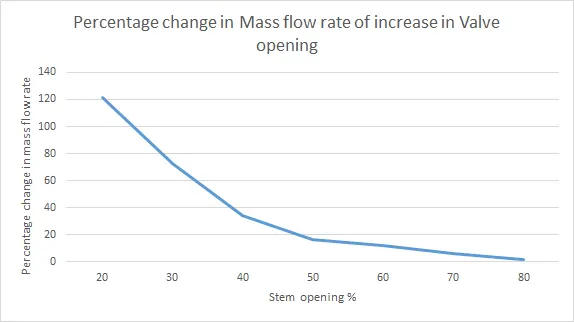
Observation:- 1) There is an increase in mass flow rate at the outlet with the increase in valve opening
2) The magnitude of increase in mass flow rate does not increase linearly with stem opening. It exhibits a decreasing trend. This is attributable to the valve characteristics.
3) The mass flow rate obtained at the outlet exhibits a negative sign. This is due to sign convention that shows outflow to be negative.