Week 9 - Mini project - Flow over an Airfoil
Aim
The major objective of this simulation was to set a simulation over the NACA 2412 aerofoil with different angles of attack(AOA) using Converge CFD and estimating its coefficient of lift and drag.
Aim: Simulate full hydro simulation for a Port Fuel Injection engine using converge and post process results using paraview.
The geometry used in the simulation.
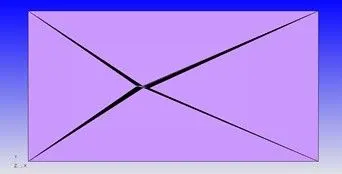
Setup-
Application Type
Time-based
Materials
Species: O2 and N2 were selected from the gas data.
Simulation Parameters:
Run Parameters:
Transient, Time based simulation, full hydrodynamic solver, compressible.
Simulation Time Parameters:
Start time : 0.0 s
end time : 1.2 s
initial time step/min time step: 1e-7/1e-8
max time step:1.0
max convection/diffusion CFL limit: 1.0 / 2.0
Solver Parameters:
PISO Navier stokes solver scheme
Boundary Conditions:
- Aerofoil Wall - wall, stationary, fixed, law of wall, temperature – zero normal gradient
- Back 2D – Two D
- front 2D – Two D
- Top and bottom - wall, stationary, fixed, law of wall, temperature – zero normal gradient
- INFLOW - pressure – zero normal gradient, temperature – 300K, velocity 30 m/s (x-dir),species – O2,N2
- OUTFLOW- Pressure – 101325Pa, velocity- zero normal gradient, temperature - 300k, species concentration – O2, N2
Initial conditions and Events
Regions and Initial conditions:
- Region 0
Velocity – 30 m/s (X-dir)
Pressure – 101325Pa
O2 - 0.23
N2 - 0.77
Temperature – 300k
Physical Models
Turbulence Modeling:
RANS k-epsilon RNG model
Grid Control
Base Grid:
dx=dy=dz=0.02m
Mesh
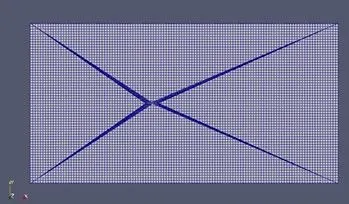
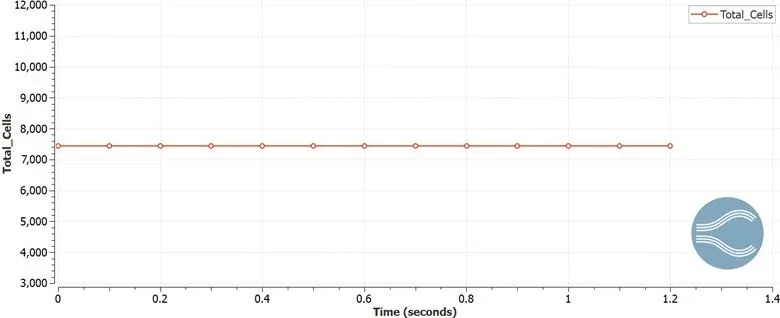
The graph shows the total cell count in the geometry. The total no of cells are around 7500.
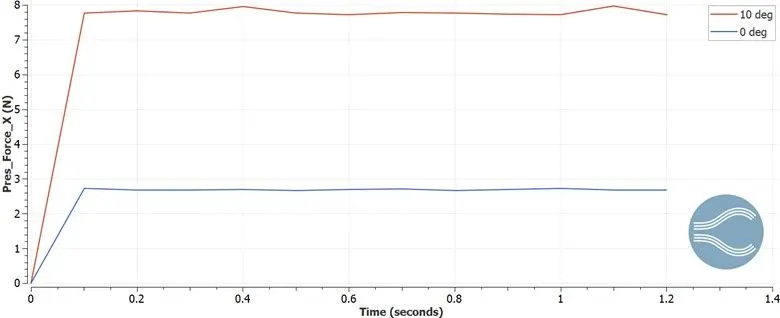
The pressure force shows the drag for the 0 deg and 10 deg cases against the time. It can be seen the drag force reaches 7.6N for 10 deg while it reaches 2.6 N for 0 deg case. The difference between the cases remain a good 5 N.
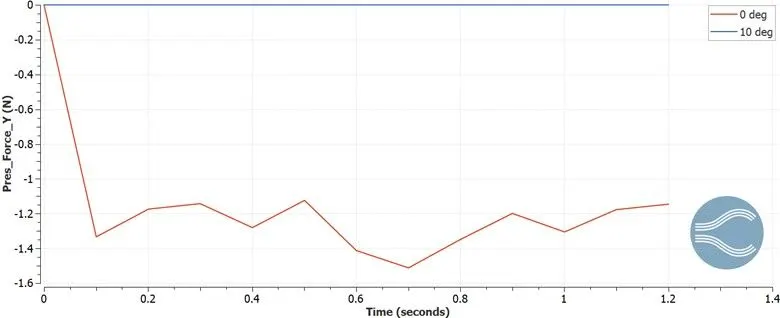
The Pressure force Y shows the lift force for 0 deg and 10 deg case against time. It can be seen the lift force is 0 N for 10 deg case while it’s -1.15 N for the 0 deg case. The difference between the case remains a good 1.15 N.
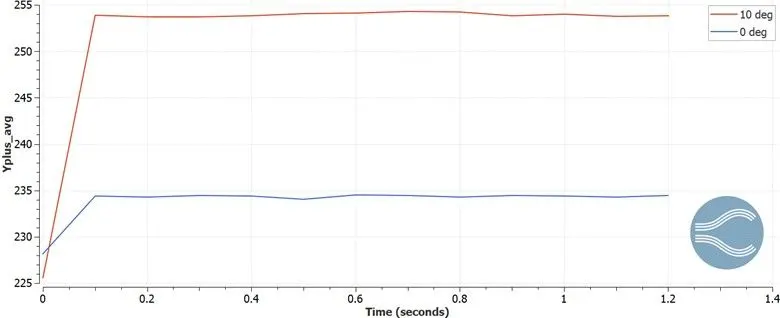
The graph shows the Y plus Avg for 0 deg and 10 deg cases with respect to time. It can be seen the Yplus is at 254 for 10 deg case and it is 234 for 0 deg case. The difference between the cases is about 20 which is a good difference.
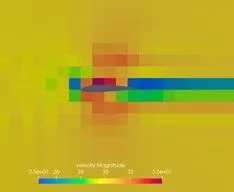
Velocity contour – 0 degree

Pressure Contour – 0 degree
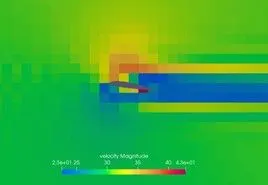
Velocity Contour – 10 degree
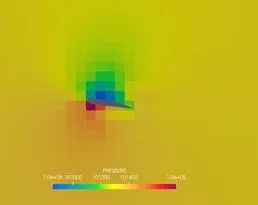
Pressure Contour – 10 degree
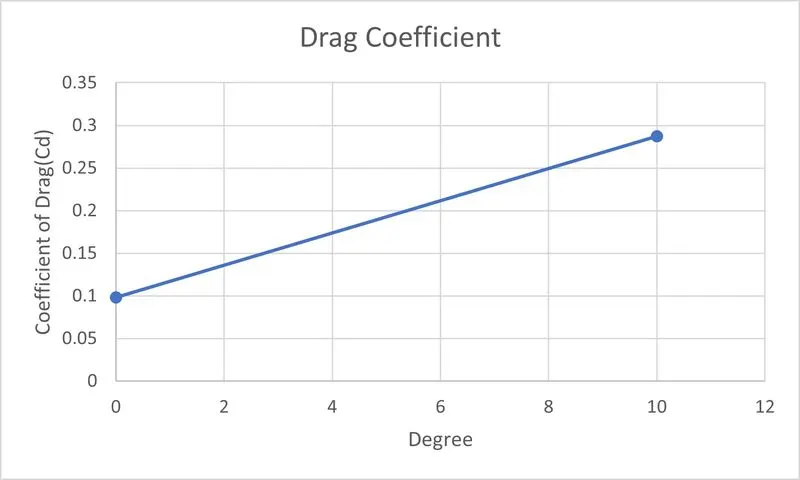
It can be seen as the angle of attack increases, the coefficient of drag increase from 0.09 to 0.28.
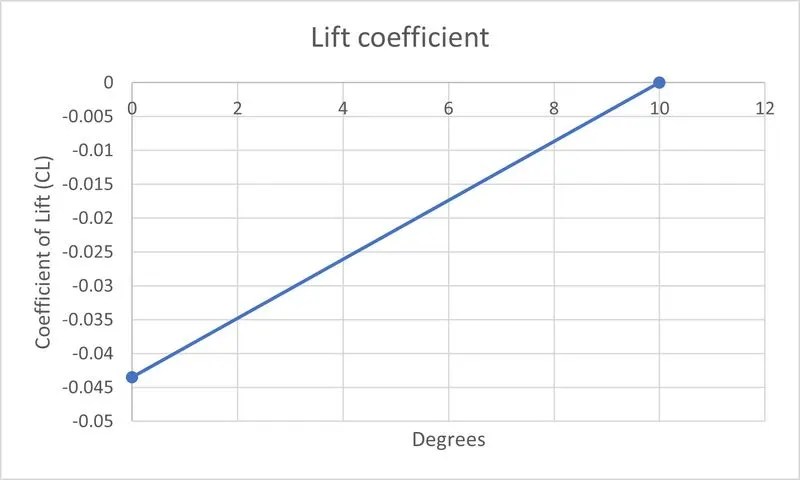
It can be seen as the Angle of attack increase, the lift coefficient increase for -0.044 to 0.
AOA 0 Degree
The velocity of air above the upper surface of the aero-foil is higher(indicated red) than that of the lower surface.
The velocity at the leading edge and the trailing edge are very low(indicated deep blue).
The pressure at the leading edge and the trailing edge is quite higher(indicated red).
The pressure of the air above the upper surface of the aero-foil is lower(indicated blue) than that of the lower surface.
Inference:
The velocity increases near the upper surface as the air gets diverted from its path and goes along with the stream of air actually upper surface.
As the velocity is higher in the upper surface there is a pressure drop in this region, according to the less accumulation of fluid near the wing.
AOA 10 Degree
Increasing the angle of attack increases the area of the aerofoil facing directly into the wind. This increases the lift but it also moves the separation point of laminar flow of the air above the aerofoil part way up towards the leading edge and the result of the increased turbulent flow above the aerofoil is an increase in the drag.
A maximum lift typically occurs when the angle of attack is around 10 degrees but this could be higher for specially designed aerofoils.
Conclusion:
The simulation of the NACA 2412 aerofoil with different angles of attack(AOA) using Converge CFD was performed and its coefficient of lift and drag were estimated.
It was seen increase in AOA results in increased lift and drag forces.
Youtube Animation Link: