Week 4.1: Project - Steady state simulation of flow over a throttle body
Aim: To perform throttle flow simulation using Converge using steady state solver and post process results using paraview.
Case performed:
dx=dy=dz=0.004m
Geometry used for simulation
Elbow, throttle, Inlet and outlet boundaries given
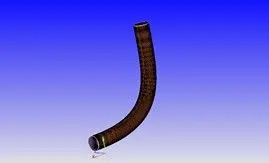
Setup:
Application: Time-Based
Materials used:
Species-Air (O2, N2)
Simulation Parameter:
Run Parameter: Steady-state solver | Full Hydro. | Compressible
Start time: 0.0
End time: 15000 cyc
Initial time step/min time step: 1e-8
Max time step: 1s
Max CFL limit(Convection/Diffusion): 1.0/2.0
Boundary Conditions:
Inlet- Pressure - 150000 Pa, 300K, Air(Species)
Outlet- Pressure- 100000Pa, 300k, (Species)Air
Elbow wall- stationary, fixed, 300k, Zero Normal Gradient for Turbulent kinetic energy boundary condition
Throttle Wall: Stationary, fixed, 300k, Zero Normal Gradient for Turbulent kinetic energy boundary condition
Initial Conditions/Regions:
Pressure: 101325Pa, 300K
Turbulence Initialization
Species- Air(O2,N2)
Turbulence Model:
RNG_K_EPS model used
Grid control:
Base grid: dx=dy=dx=2e-4m
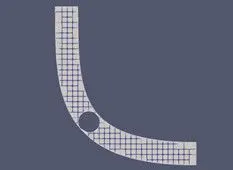
Total cell count represents the number of cells(700) present in the geometry.
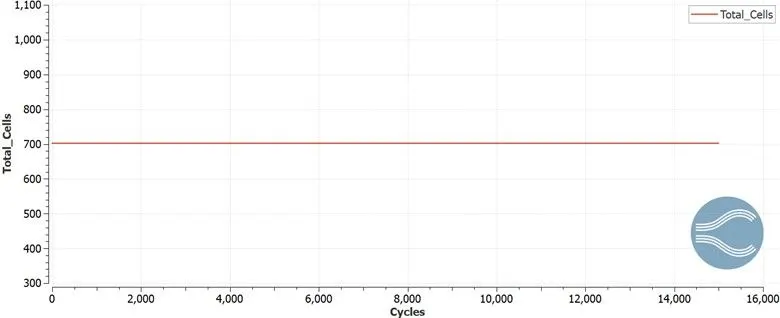
Mass flow inlet
Mass flowing through the inlet body of the elbow remains constant with slight variation.
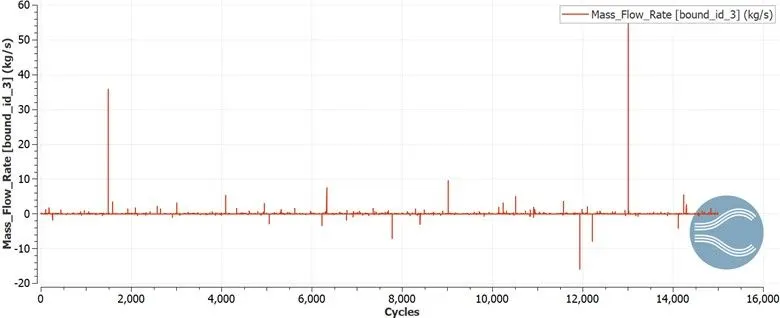
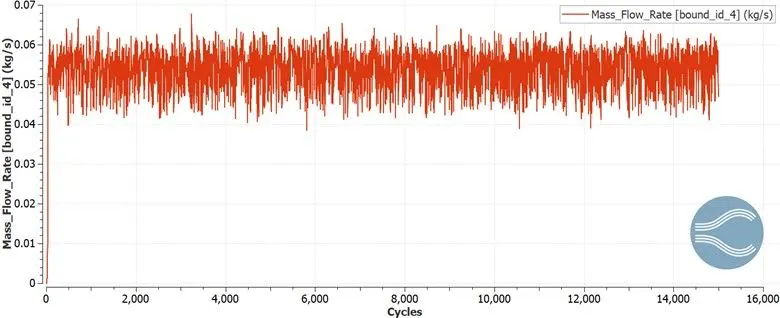
Mass flow outlet
Mass flow through the outlet of the elbow shows continuous varying pattern through the cycles.
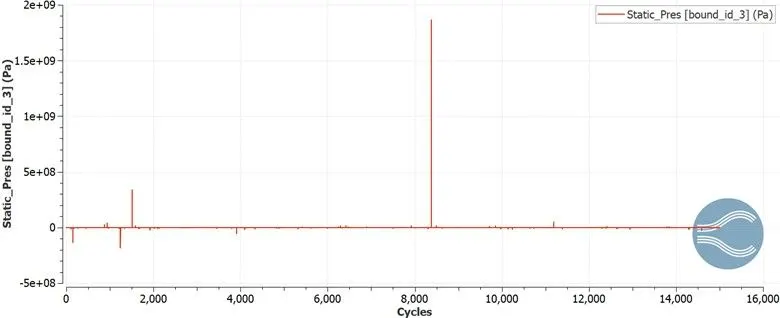
Static pressure inlet
The pressure remains constant with slight variation at certain cycles.
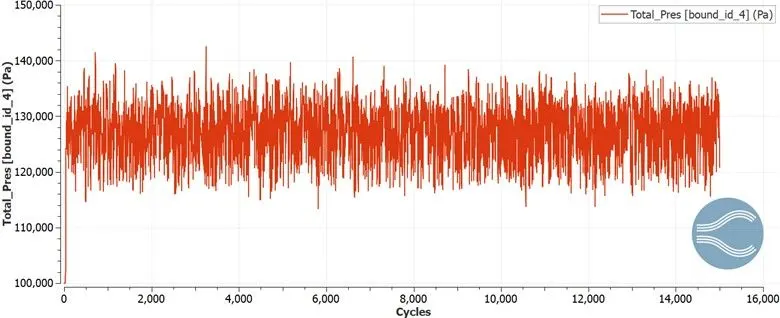
Total pressure outlet
The total pressure shows a similar pattern to outlet mass flow with continuous varying through the cycles.
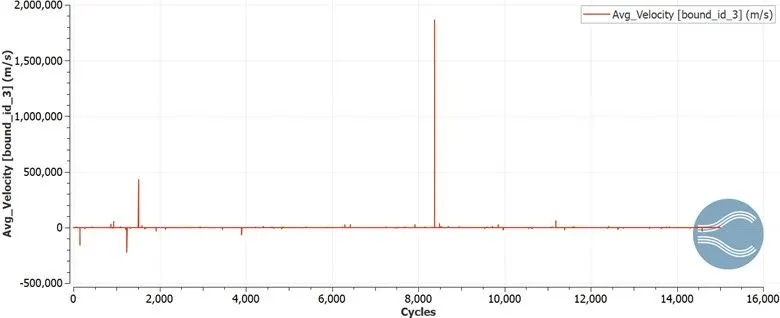
Average velocity inlet
The average inlet velocity remains constant similar to the pressure inlet case.
Average velocity outlet
The average velocity outlet varies continuously similar to the pressure and mass flow graph.
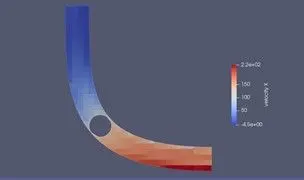
Velocity contour
The velocity contour shows the low velocities present in the inlet side and increased velocity at the outlet.
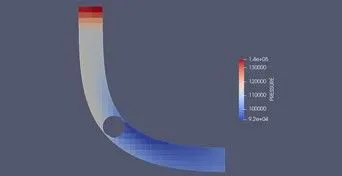
Pressure Contour
The pressure contour shows increased pressure at the inlet and low pressure as the outlet is reached.
Youtube animation link: