Week - 9 Material Modeling from Raw Data
Aim: Using the stress-strain data obtained from laboratory test to create the material data card and validate it by performing dogbone uniaxial tensile test.
______________________________________________________________________________
Objectives:
1. Convert the given test data (Stress-Strain) by plot digitizer tool
2. Convert the data from to kg-mm-ms unit system
3. Perform the uniaxial digbone tensile test
4. Validate the test data
______________________________________________________________________________
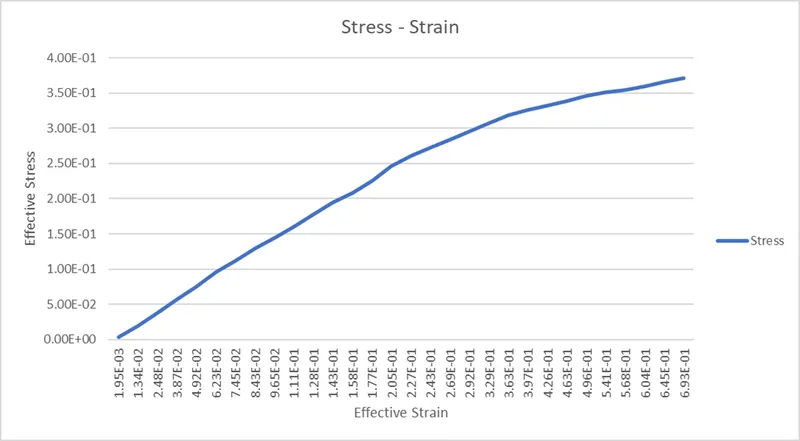
Step 1: The test data is extracted by digitizing the stress-strain plot and converted to kg-mm-ms unit system from ksi. Following figure shows effective stress strain plot after data conversion.
Following formulae are used used to convert stress and strain to effective stress
-strain values.
Effective stress = True stress
Effective strain =True strain - (True stress/E) where E=20.9 e6 psi
Step 2: The given Dogbone keyword file is opened in LS-Prepost as shown in figure

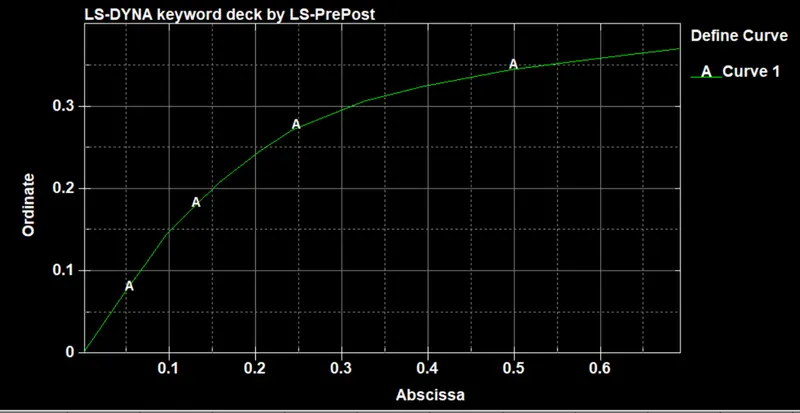
Step 3: Using *DEFINE_CURVE keyword Effective stress-strain curve is generated as shown in the following figure.
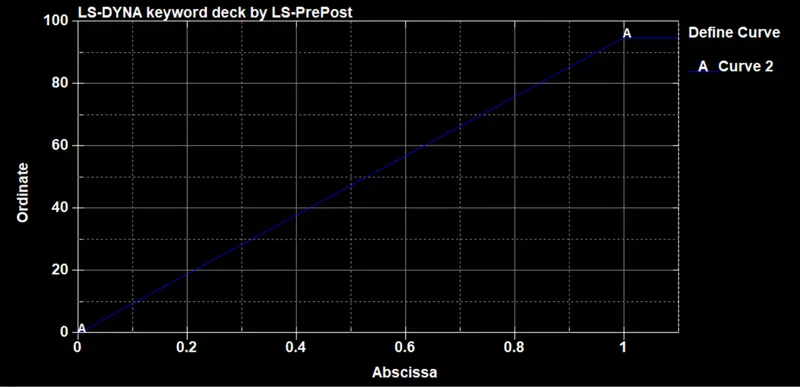
Step 4: Using *DEFINE_CURVE displacement curve is given.
Step 4: Left side end nodes are constrained in all directions
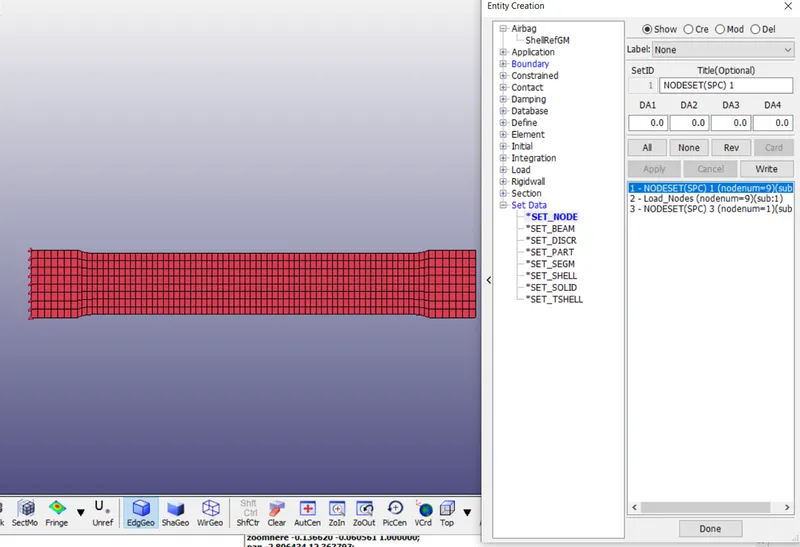
Step 5: Middle node at the right side is constrained in y direction.
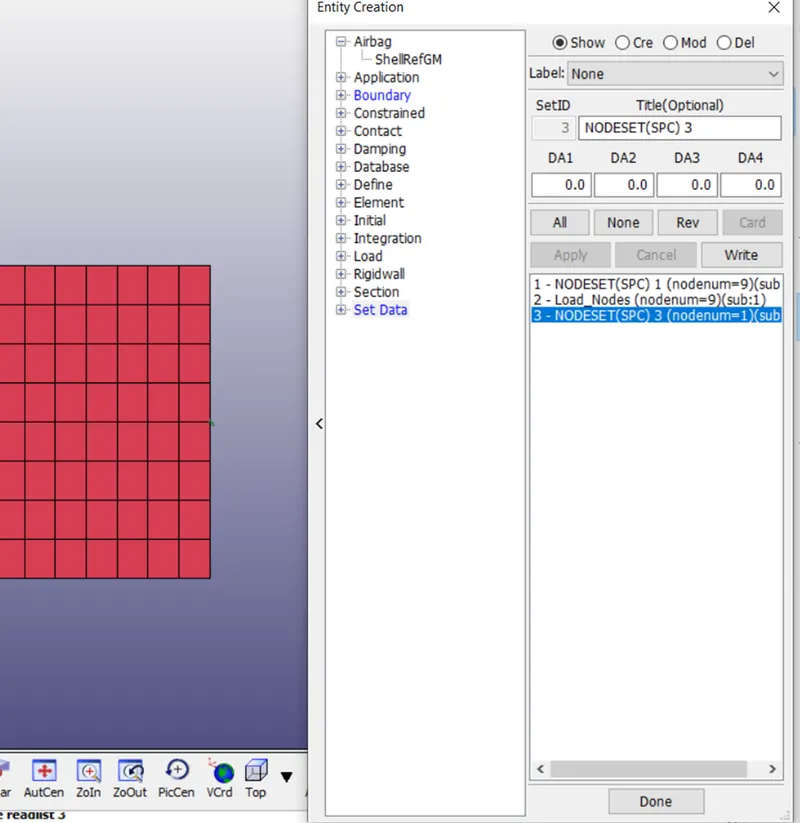
Step 6: Node set is defined on right side to assign prescribed boundary motion.
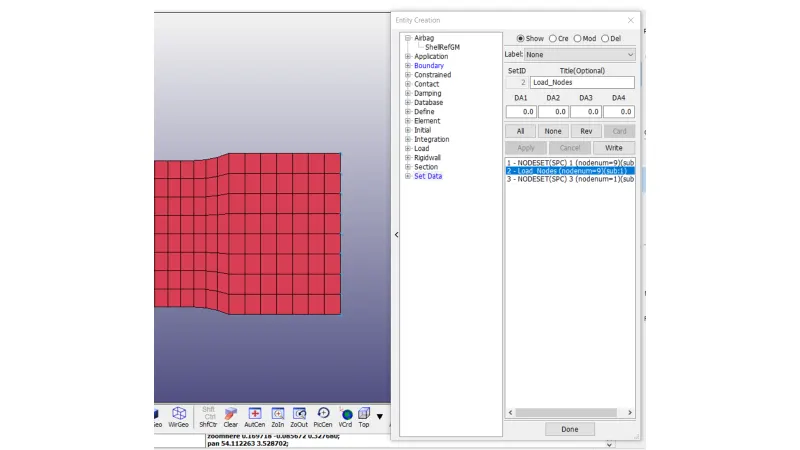
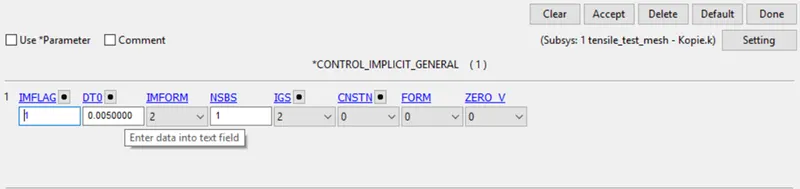
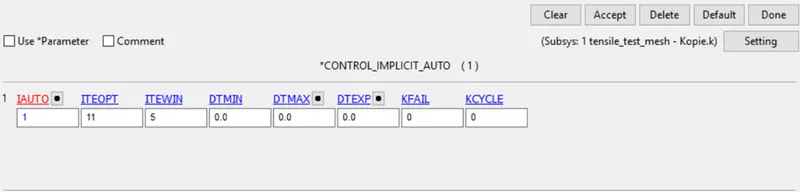
Step 7: *CONTROL_IMPLICIT_AUTO, *CONTROL_IMPLICIT_SOLUTION, *CONTROL_IMPLICIT_SOLVER, *CONTROL_IMPLICIT_GENERAL cards are defined as shown below.
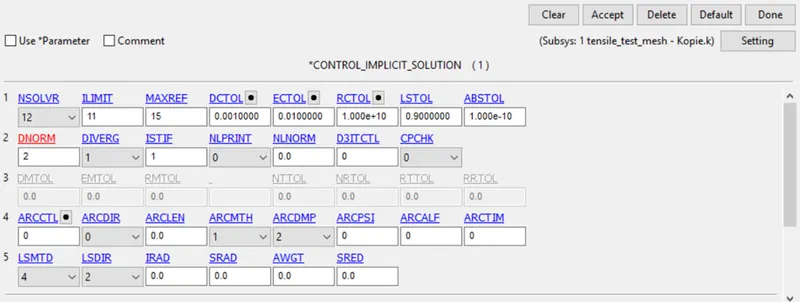
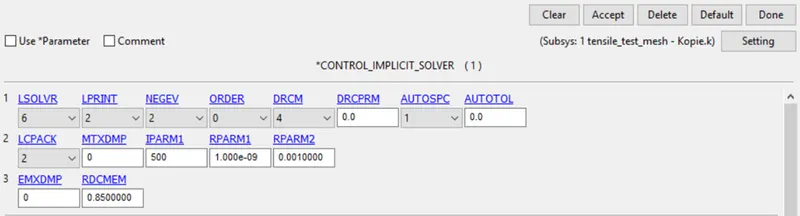
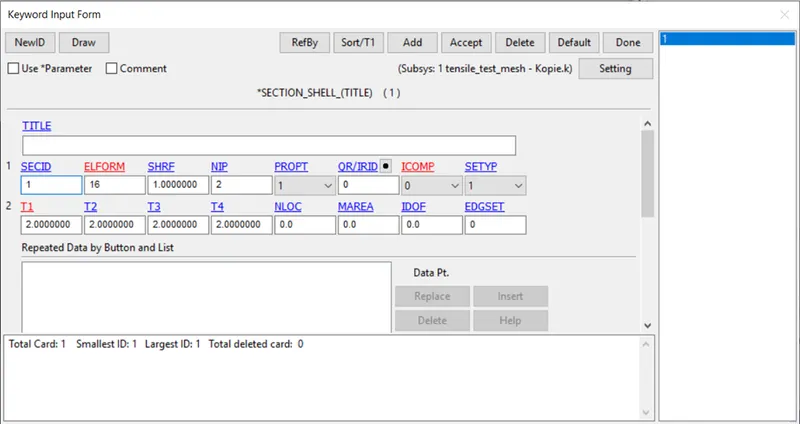
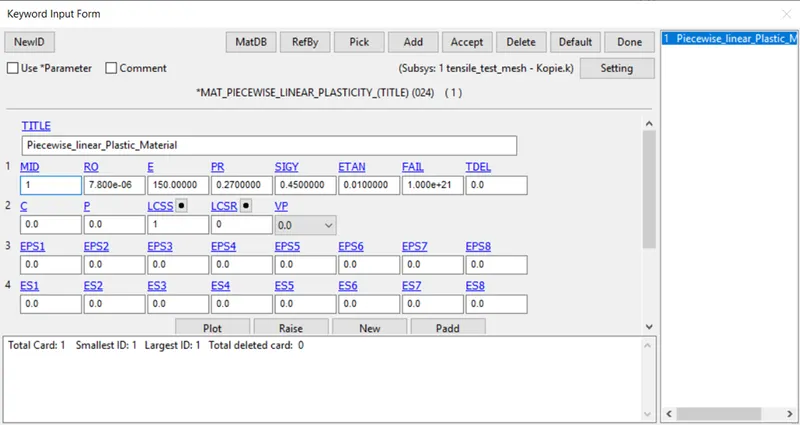
Step 8: *SECTION_SHELL and *MAT_PIECEWISE_LINEAR_PLASTICITY (MAT24) are defiend and assigned to the part.
_____________________________________________________________________________
Results
____________________________________________________________________________
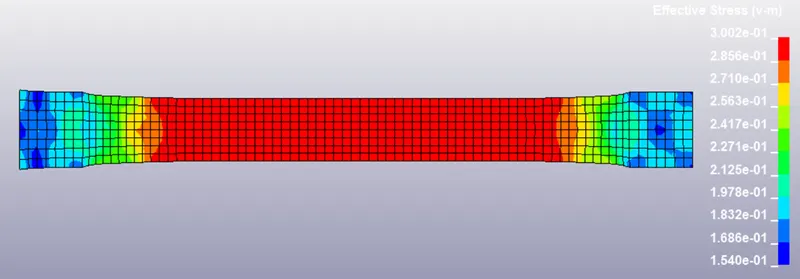
Following figure shows effective stress
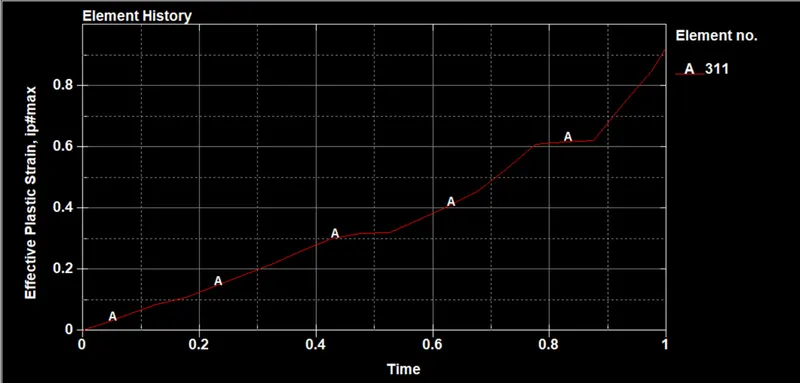
Effective Strain vs Time
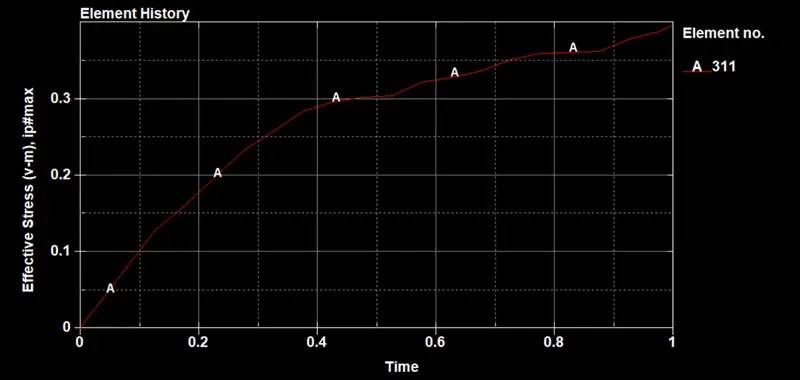
Effective Stress Vs time
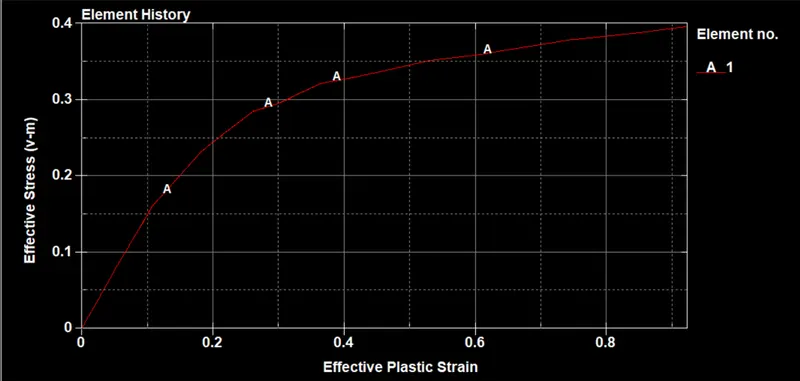
Effective Stress-Strain diagram
Comparison of test and simulated data
Following figure shows the comparison of stress strain obtained from the test in comparison with the simulation. Since the sampling rate used was different in both the cases, a direct comparison was not possible. Hence, plots are compared one below other.
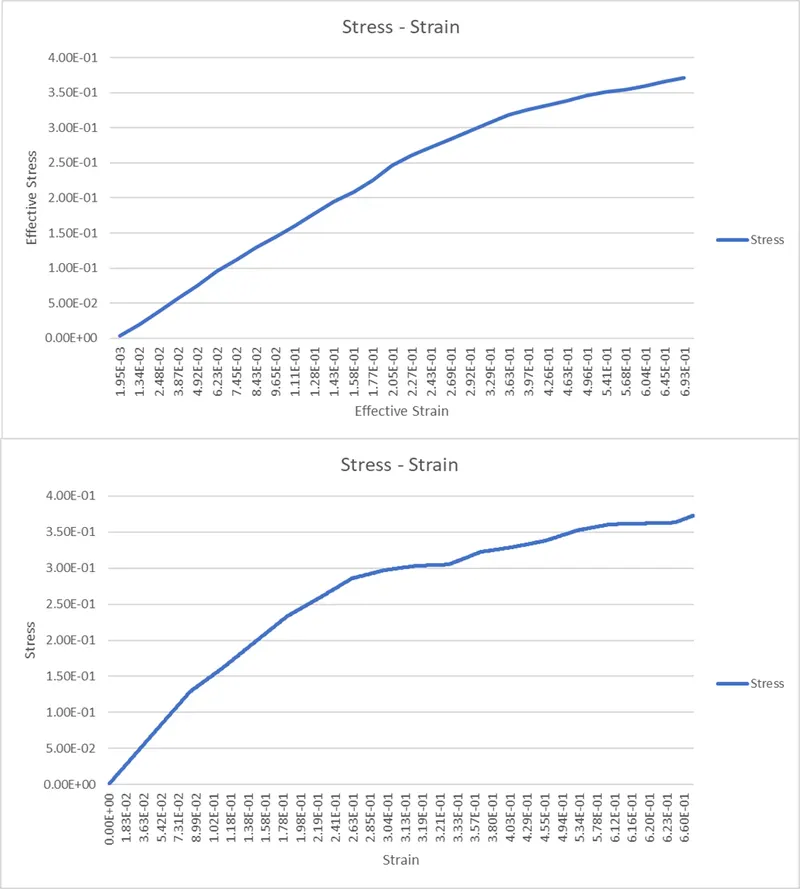
From the plots we can observe that the simulated data agrees the test data. However, we rquire a linear correlation to understand the degree of fit and how well the data are correlated. On a qualitative note, the results look good.
Lessons learnt.
1. How to use the material test data to simulate the tensile test
Conclusions:
1. Material test data is converted to kg-mm-ms unit
2. Material card is updated with effective stress-strain plot.
3. Test data was validated with the simulation.