Week - 9 Material Modeling from Raw Data
report week 9
Aim:Extract the data from the diagram of the true stress-strain curve of graphite iron casting, use the material model with a dogbone specimen and validate the data.
Procedure:
1. Use GetData Graph Digitizer to extract data from curve 2 in the given picture.
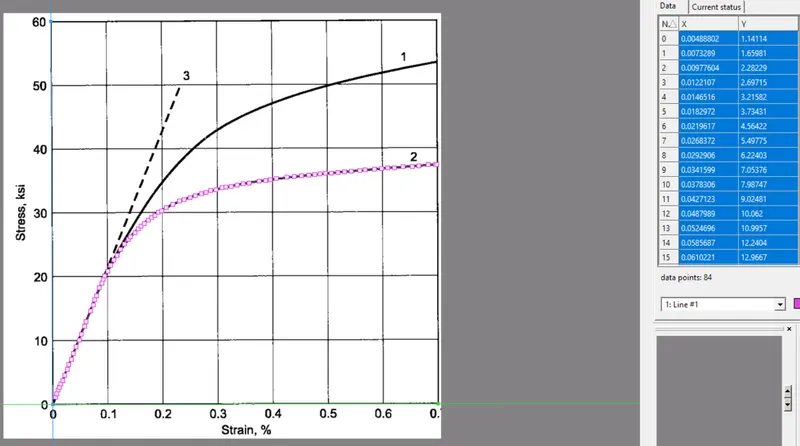
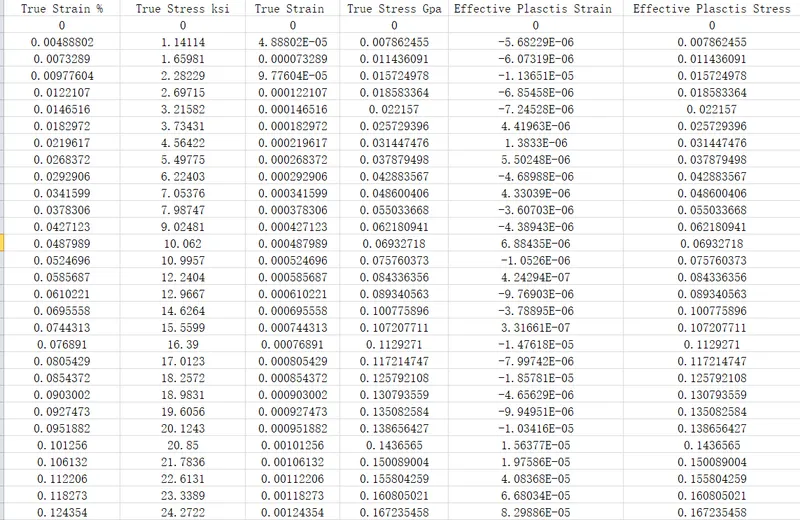
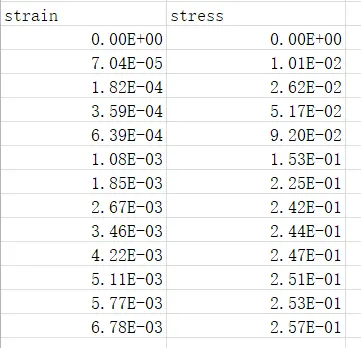
Export data to excel and calculate True Stress (GPa), True Strain, Effective Plastic Strain and Effective Plastic Stress.
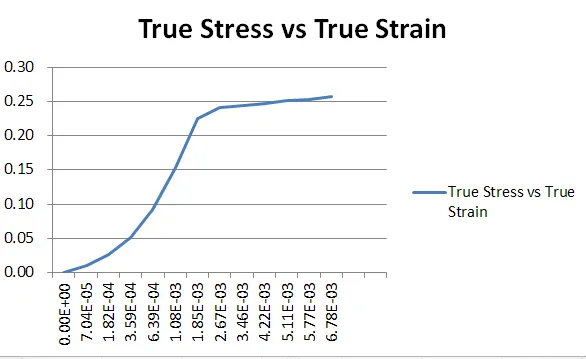
Create a True Stress (GPa) vs True Strain plot, find out yield stress valus is 0.143 Gpa.
2. Use Mat_24 card. Create material for the part: use Ro=7.8e6, E=20.9e6 Psi= 144.1GPa, PR=0.3, SIGY= 0.143, LCSS=1
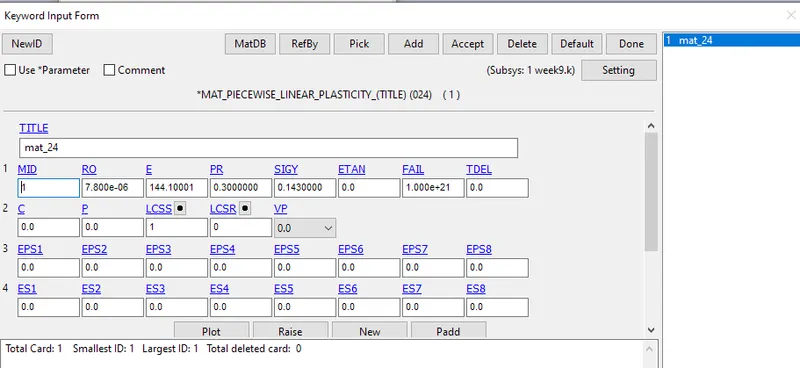
Define the material curve 1:import data from excel: Effective Plastic Strain (positive) and Effective Plastic Stress.
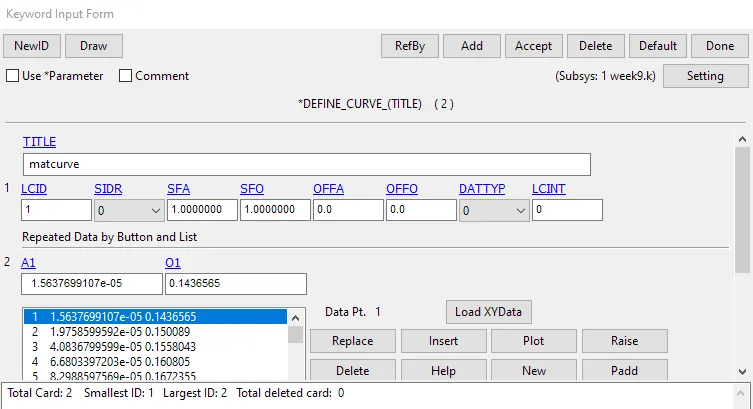
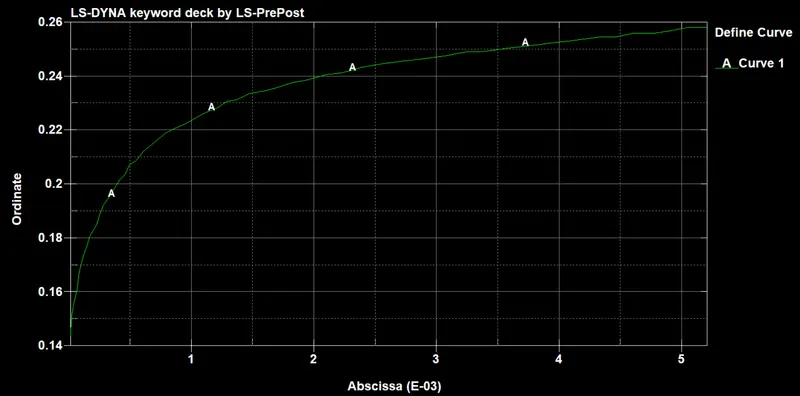
3. Define section of the part: give thickness 1mm
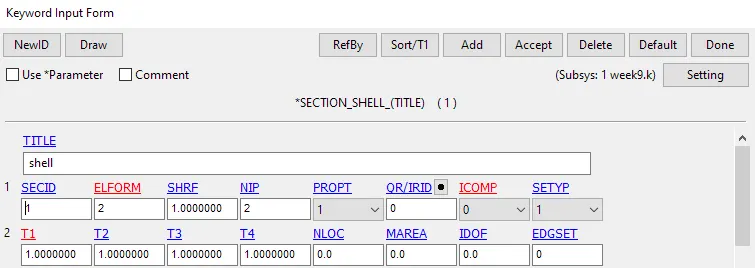
4. Assign Matrial and Section to part.
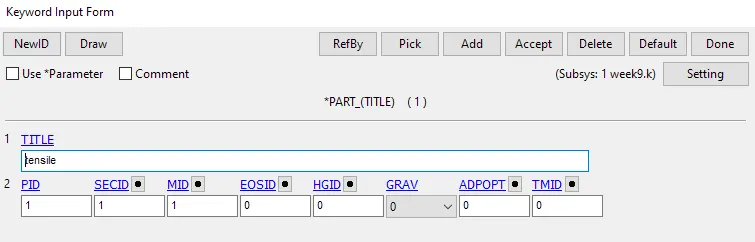
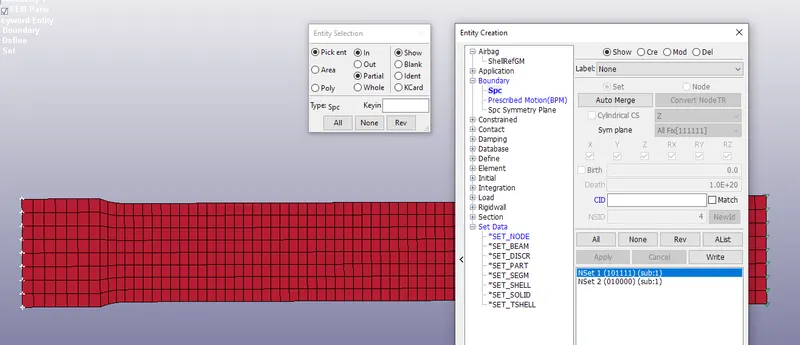
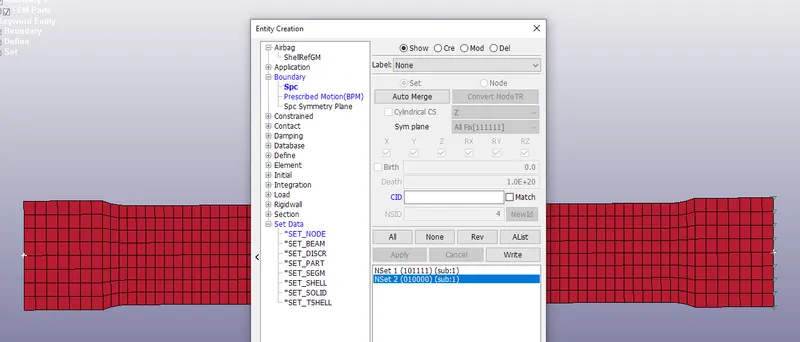
5. Create buondary condition:
Left end fixed all the point in X and Z direction
The middle points in two ends fixed Y direction
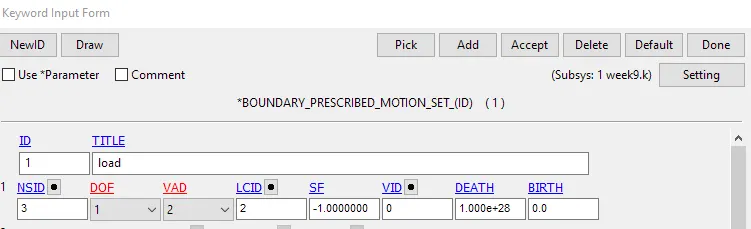
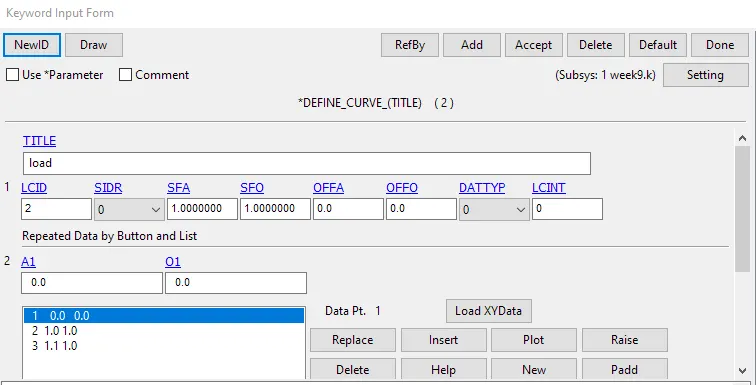
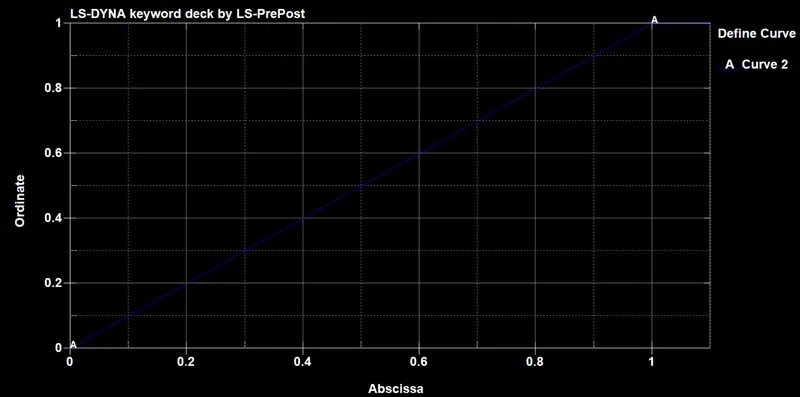
6. Create load curve and apply on the right end
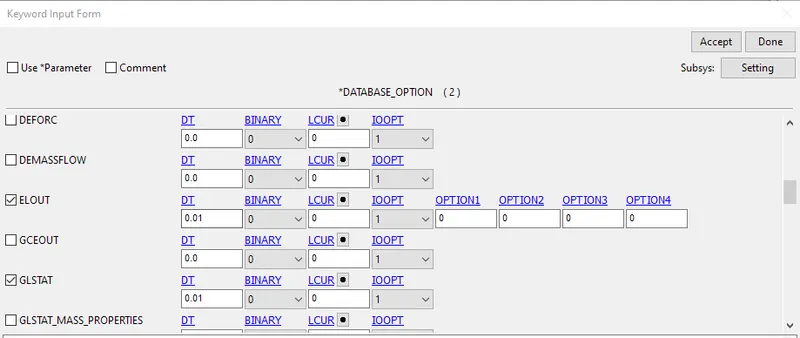
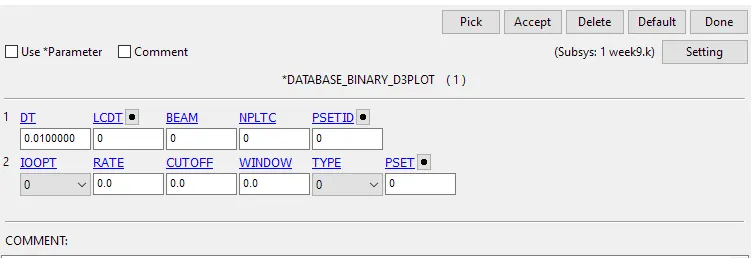
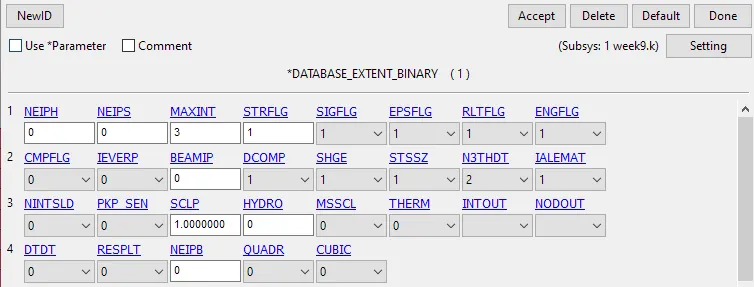
7. Databse options
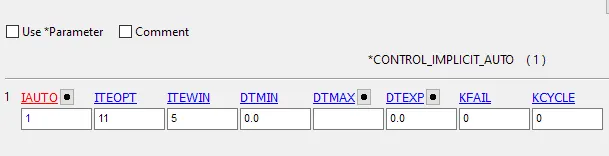
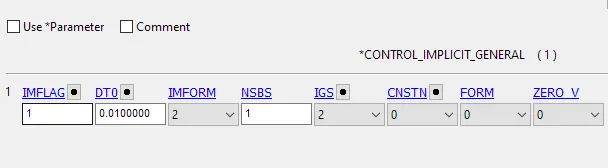
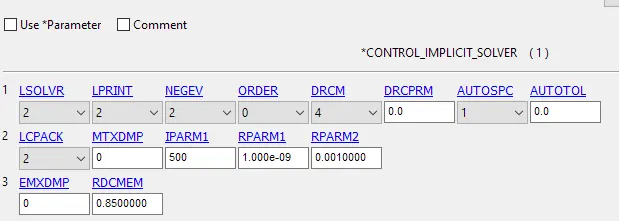
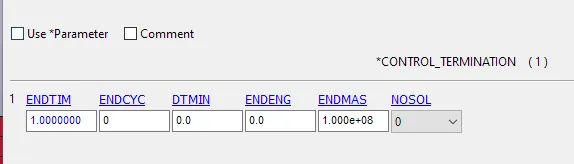
8. Control Setting
9. Run the simulation and see results
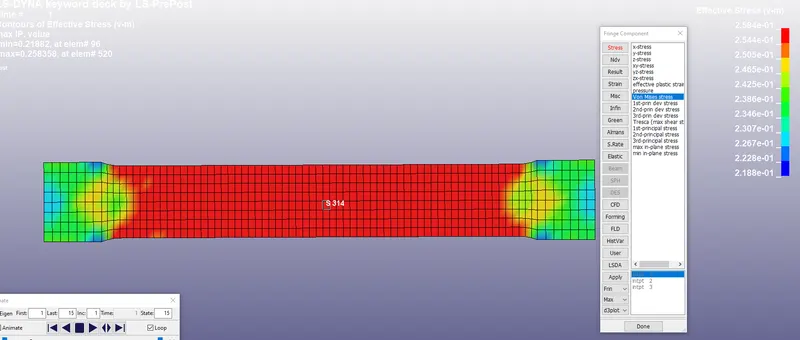
Von Mises Stress
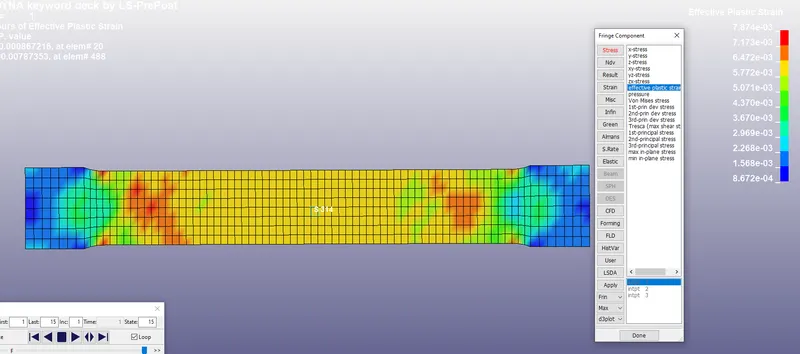
Effective Plastic Strain
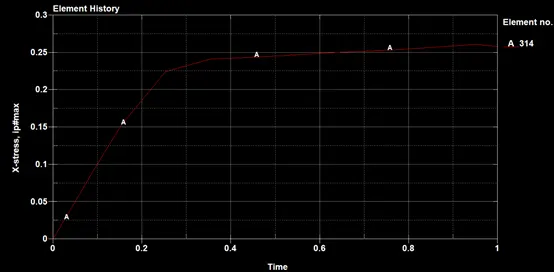
X Stress plot
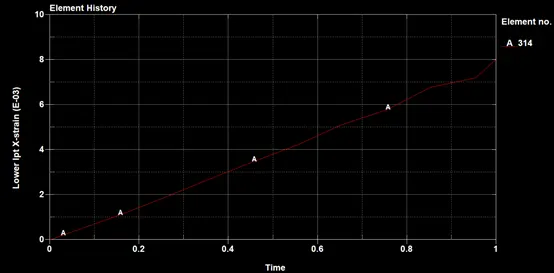
X Strain plot
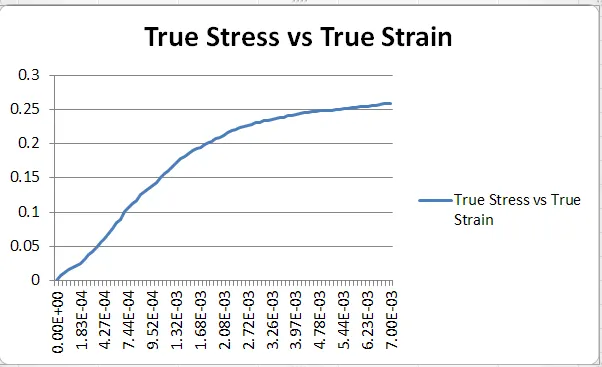
True Stress vs True Strain plot
10. Data Validation
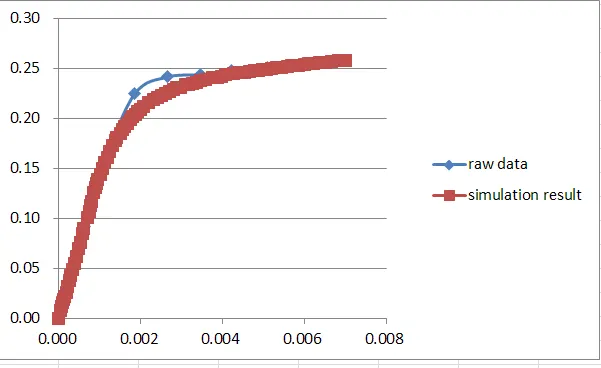
Combine True Stress vs True Strain Raw Data and True Stress vs True Strain Simulation Data:
Conclusion:
Use Mat_24 card, we got similar True Stress vs True Strain plot from Raw Data and Simulation Data. There is some variation between 0.002 to 0.004 strain. However, decrease time interval can eliminate this variation.