Week - 9 Material Modeling from Raw Data
Week 9: Material Modeling from Raw Data
Aim
Extract data from the true stress-strain curve of graphite iron casting, create a MAT_024 or MAT_018 material model using the extracted data and validate the model using a dog bone specimen.
Objective
1. Data Extraction:
- Use a data digitizer to extract data points from the provided true stress-strain curve diagram.
2. Data Cleaning:
- Clean the extracted data to remove any inconsistencies or errors.
- Visually confirm the cleaned data aligns with the original stress-strain curve.
3. Unit Conversion:
- Convert the cleaned data to the (kg-mm-ms) unit system.
4. Material Model Creation:
- Use the processed data to create a MAT_024 or MAT_018 material model.
- Follow the steps demonstrated in the provided video tutorial.
5. Model Validation:
- Apply the created material model to a dogbone specimen.
- Validate the material model by comparing the simulation results with expected outcomes.
6. Documentation:
- Document the entire process, including data extraction, cleaning, unit conversion, material model creation, and validation.
- Provide a detailed report with visual confirmations and validation results.
Procedure
Step 01: Extracting Data Points From the Figure
Data points can be extracted from a figure with the help of data digitizer software. For this case, we use the 'Get Data Digitizer' software. Open the software and import the figure.
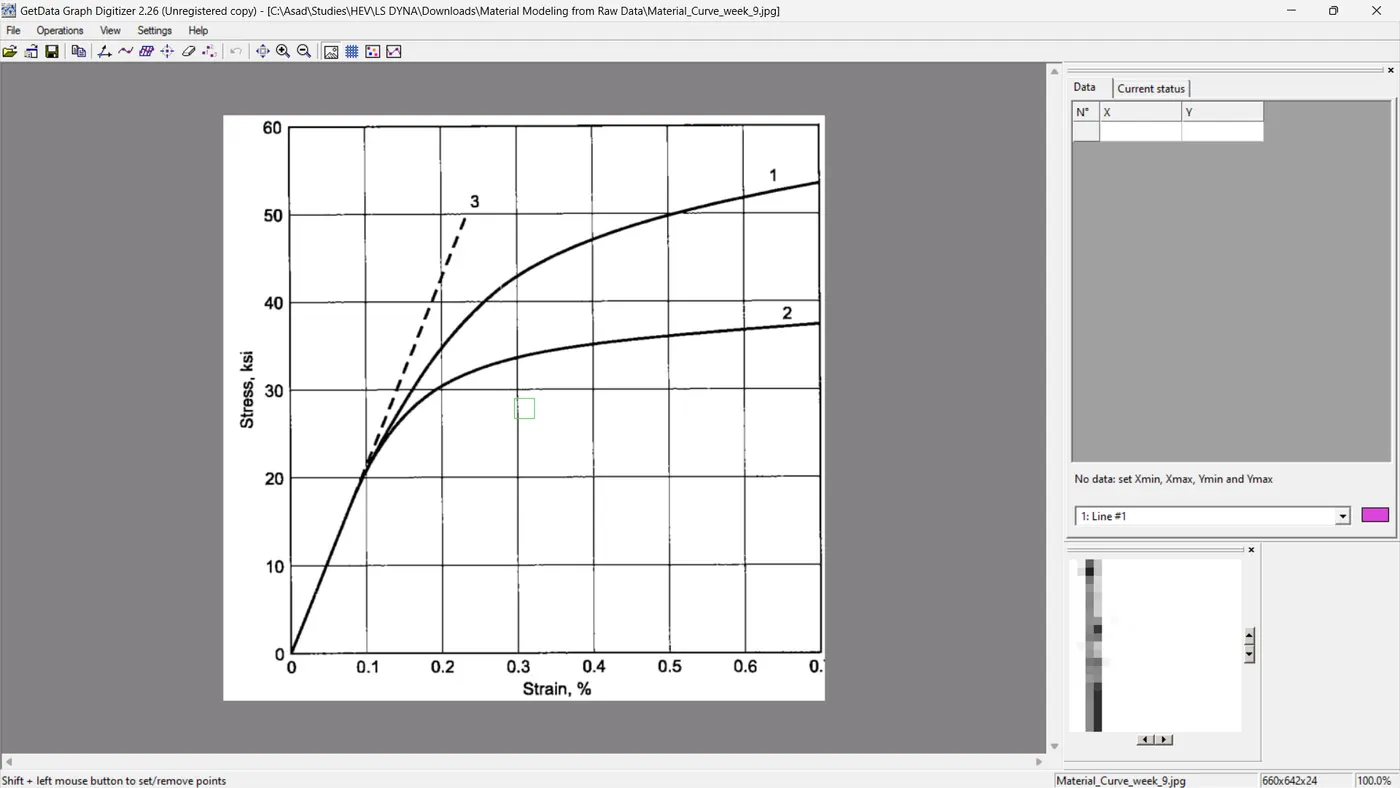
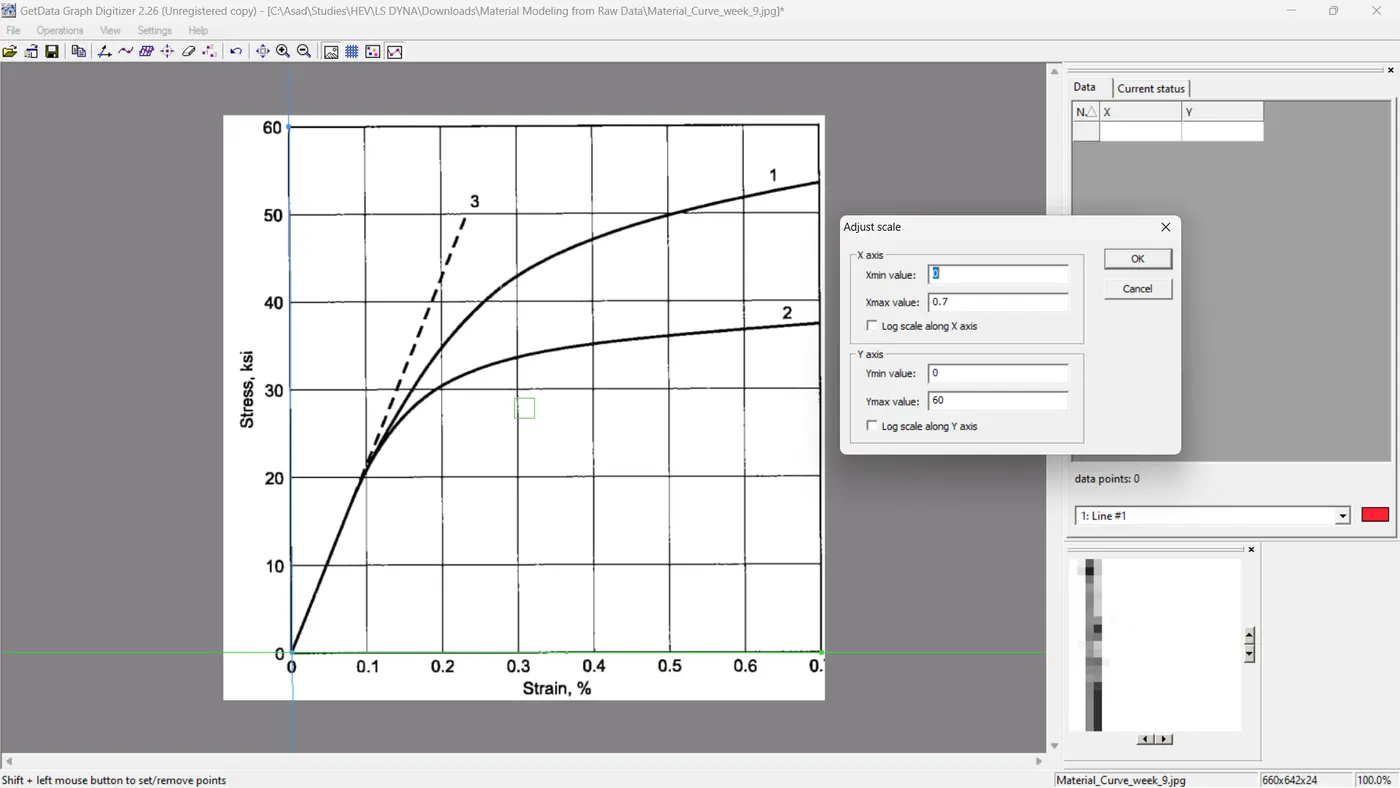
Select the coordinates to define the X and Y axes using the 'set the scale' tool. Refer to the magnification window in the bottom right corner, use the cursor to identify the Xmin, Xmax, Ymin, and Ymax coordinates, and enter their actual values corresponding to the X and Y axes.
- Xmin = 0
- Xmax = 0.7
- Ymin = 0
- Ymax = 60
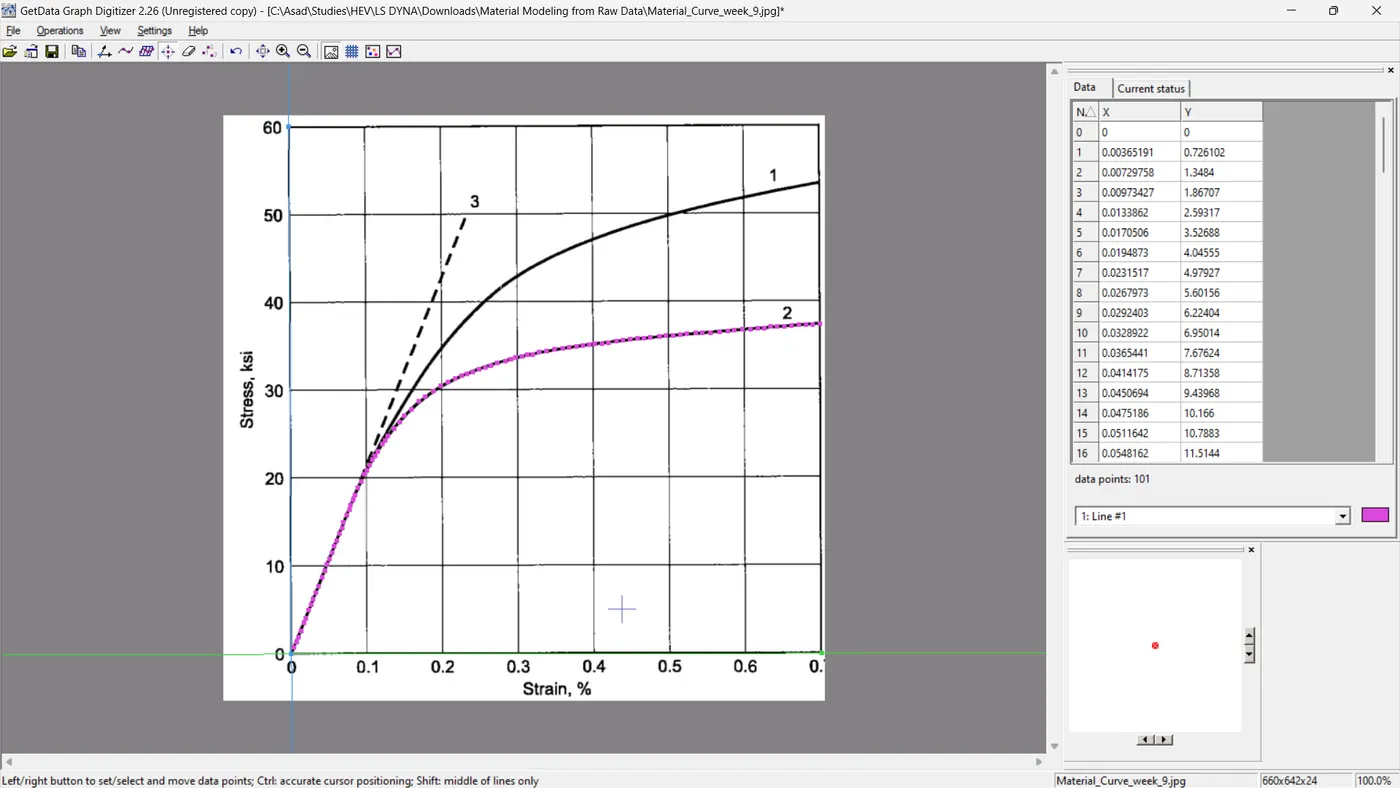
Then, by employing the 'point capture mode' tool, we need to capture the data points by selecting several points on the graph line with the assistance of the magnification window. After choosing each point, the corresponding X and Y coordinates will be updated in a table in the top right window. Similarly, extract the data point coordinates of other graph lines and export them to XLS format.
Step 02: Organizing, Unit Conversion, Calculation And Plotting
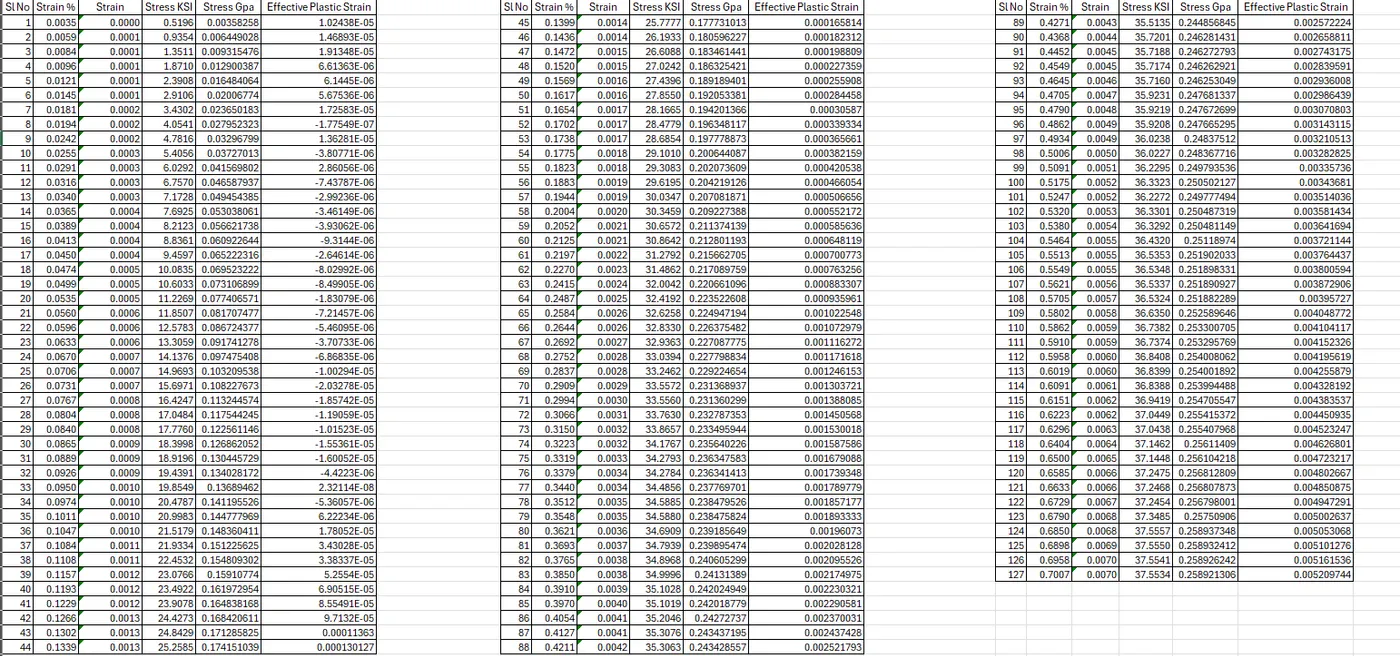
The extracted data can be accessed using any Excel-compatible software. Open the file in Excel and analyse the data. Proper headings and tables can organize the data.
The figure indicates that stress is measured in 'ksi' and strain in percentage. The following conversion method should be applied to convert these to a kg-mm-ms unit system.
- Strain = Strain%/100
- Stress in GPa = 0.0068947573* Stress in ksi
The stress and strain obtained after the conversion are true stress and strain values. After that, we need to find the effective plastic strain by using the following equation
- Effective Plastic Strain = True Strain - (True Stress/E)
Where E = Young's Modulus in GPa = 20.9E6 /145037.738
= 144.100427 GPa.
After determining the true stress and effective plastic strain for each data point, we need to plot a curve with the effective plastic strain on the X-axis and the true stress on the Y-axis.
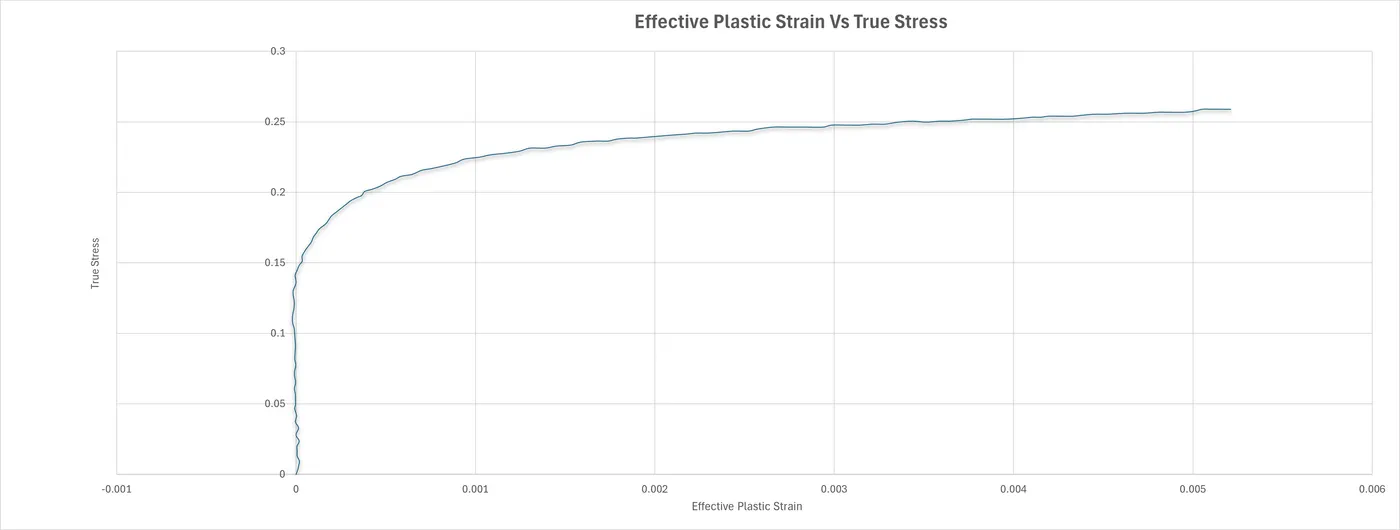
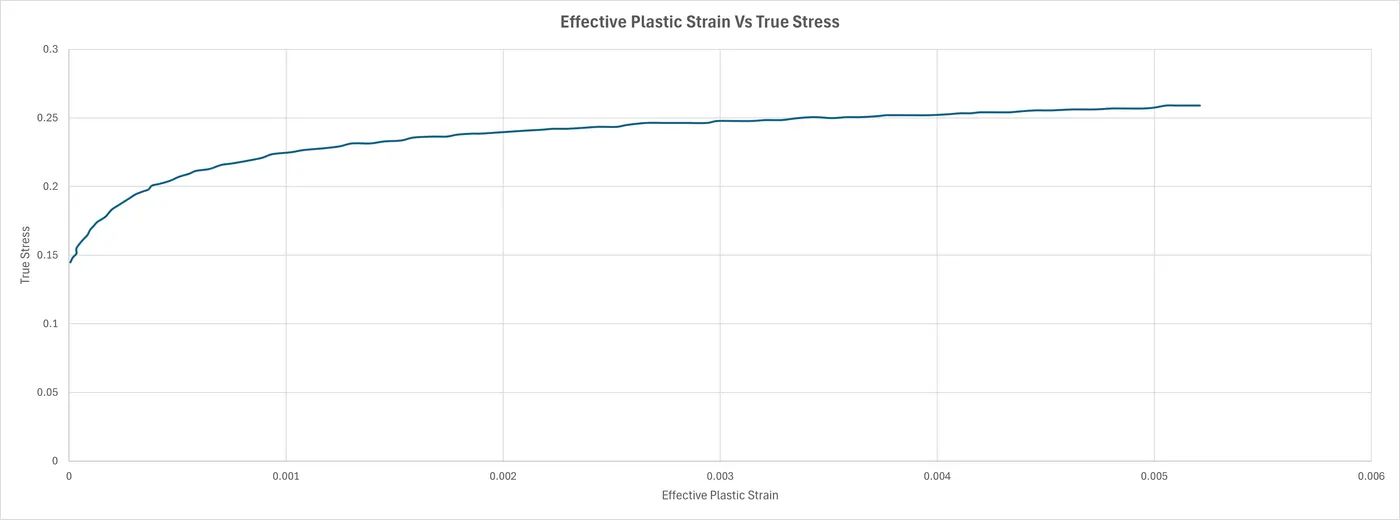
The negative sign may suggest compressive strain. The graph indicates that the material behaved linearly until reaching a true stress of 0.14375612 GPa, beyond which it demonstrated non-linear properties. Therefore, we need to isolate and examine the non-linear segment.
Step 03: Defining the Curve to the Model Using Notepad++
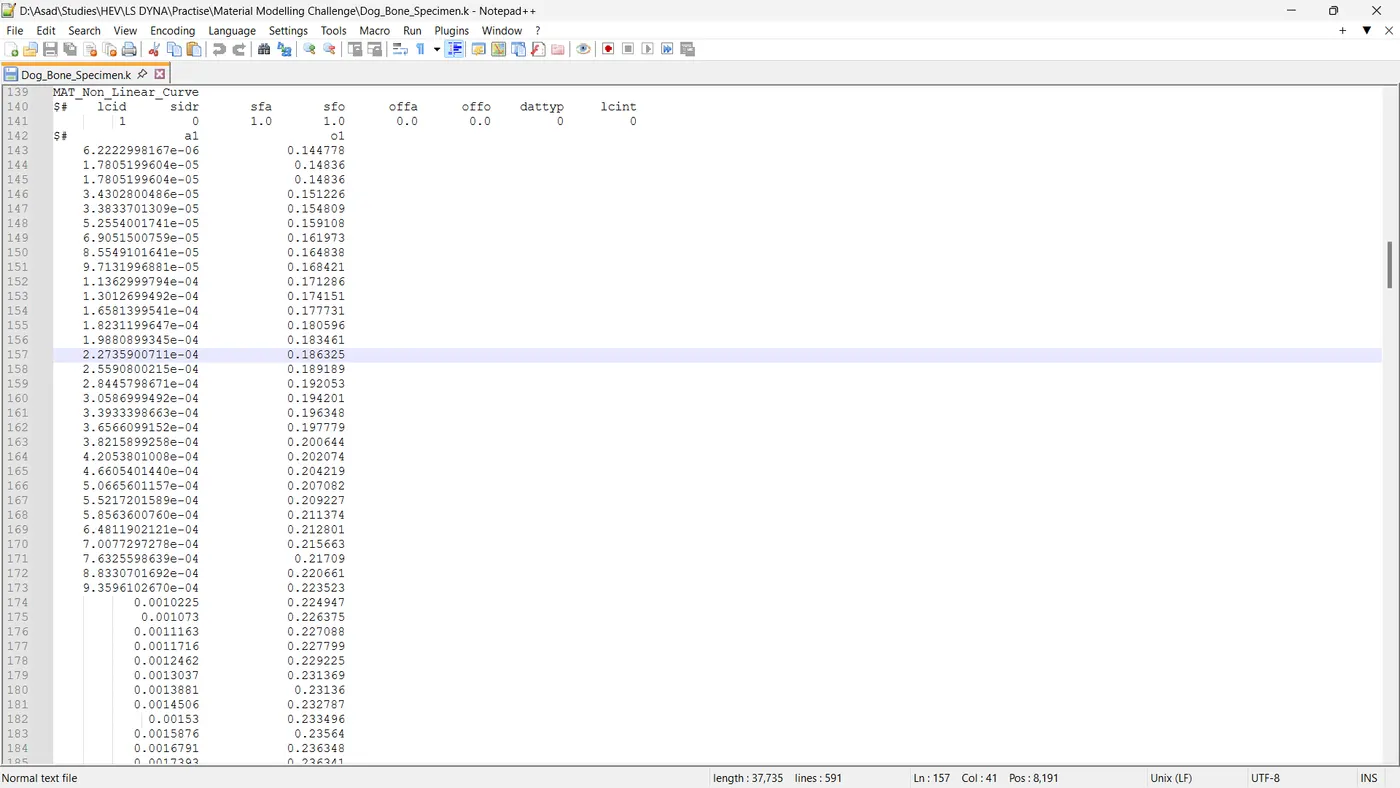
Open the Notepad++ and load the 'Dog_Bone_Specimen.k'. Next, we must input the values of effective plastic strain and true stress into the model. Use proper spacing when entering the data into the file; utilize the column select feature (Alt Cursor) to drag-select multiple columns.
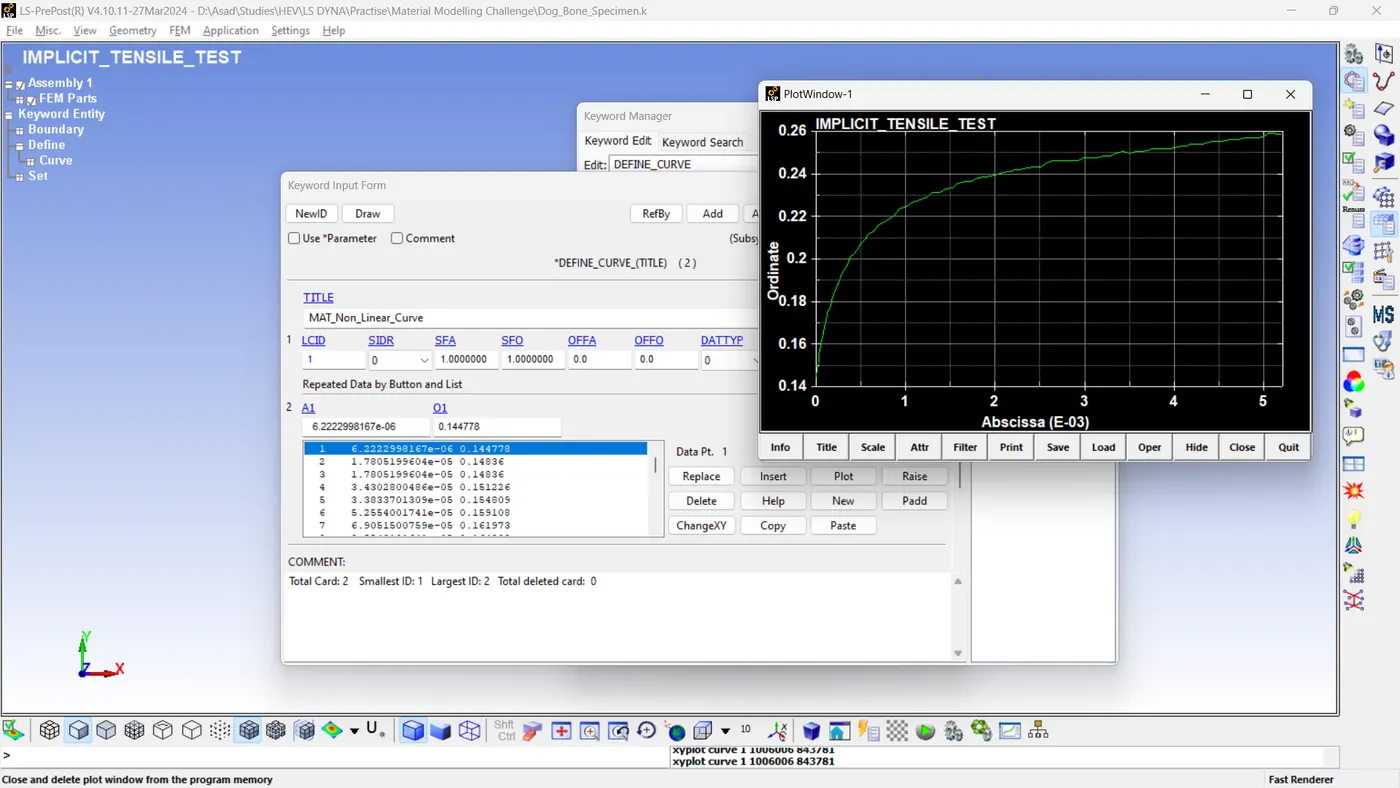
After applying the changes, save the file and load it using LS Prepost. The defined curve can be plotted to match the previously shown plot.
Step 04: Defining Material, Section, Hourglass Cards and Assigning to the Part
Define a MAT-024 card using the following parameters. The material properties are based on ASTM A36 Steel. According to the objective, Young's modulus should be taken into account. Define the non-linear characteristic curve on the material card using the LCSS (Load Curve ID) parameter.
- rho = 7.85xx10^-6 (Kgm)/(mm^3)
- E = 144.100427 GPa.
- PR = 0.26
- SIGY = 250x10^-3 (Kgm)/ (mm ms^3)
- ETAN = 0 (If LCSS is defined, it is disregarded.)
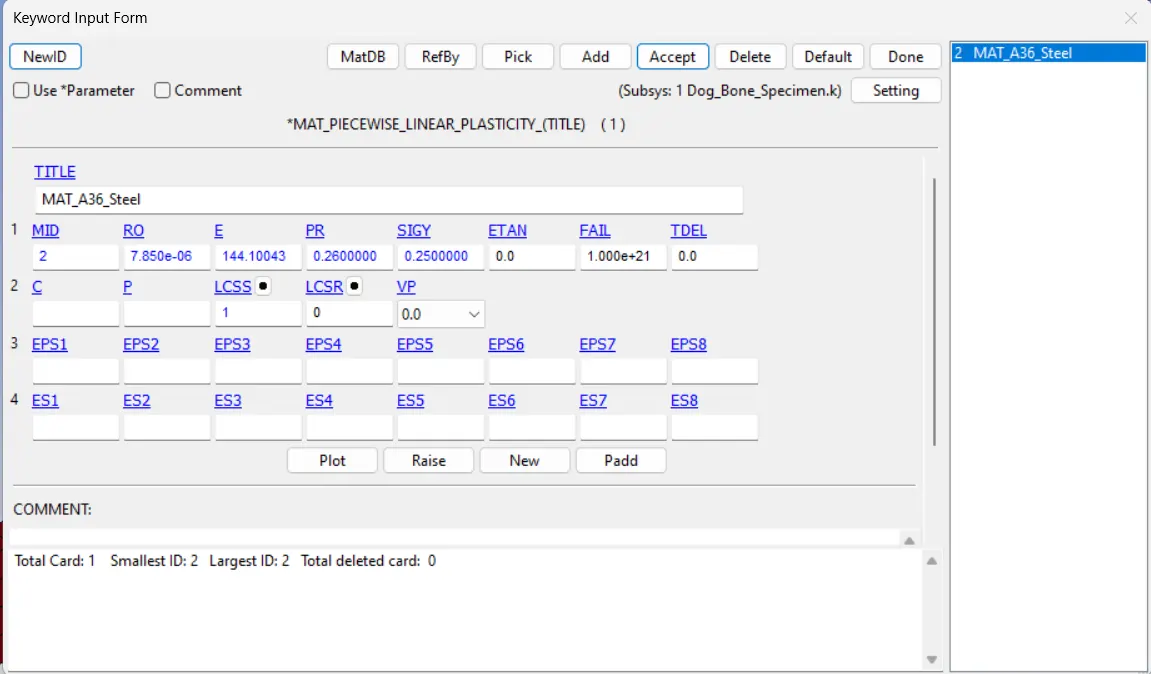
The model comes predefined with a shell section of the appropriate thickness. Assign ELFORM=2 and save the modifications made to the section.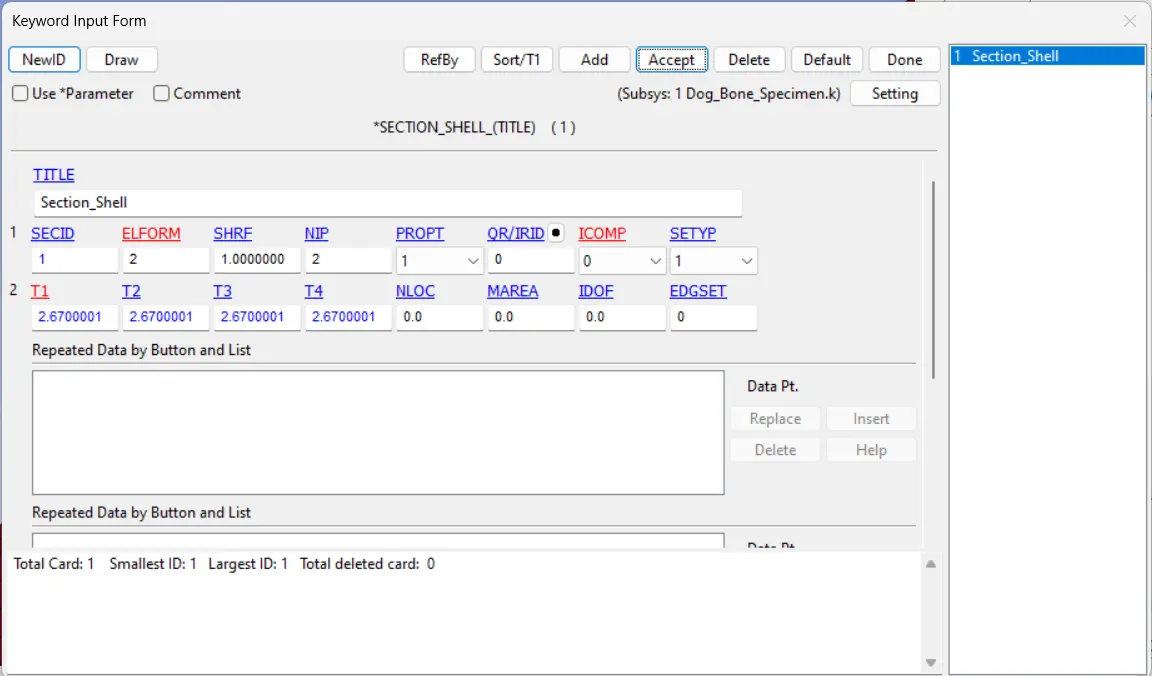
An hourglass card is a component that manages the generation of hourglass energy in a simulation. Define the hourglass card and set IHQ=2. Subsequently, assign the material, section, and hourglass card to the respective part.
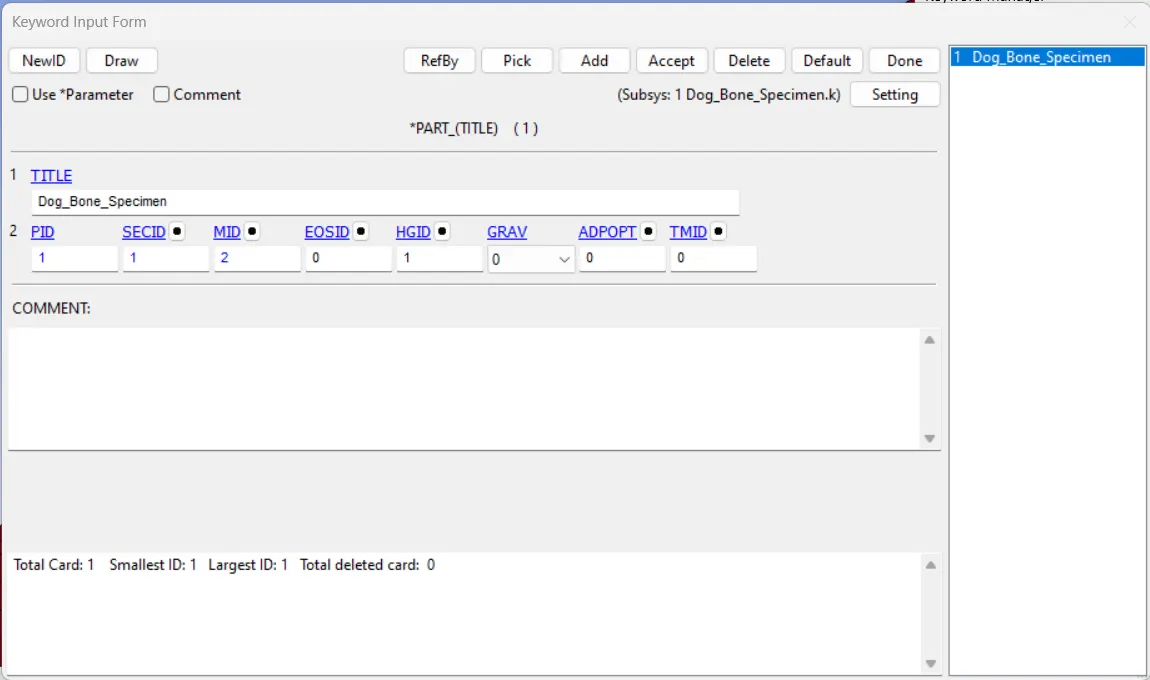
Step 05: Setting Boundary Conditions.
Two sets of node sets regulate the tensile motion. The first node set contains the outermost nodes on the left-hand side (LHS) along the negative X-axis, and it is configured to restrain all degrees of freedom (DOFs). The second node set includes the outermost nodes on the right-hand side (RHS) along the X-axis, where motion is permitted only in the X direction, with the remaining DOFs being restricted.
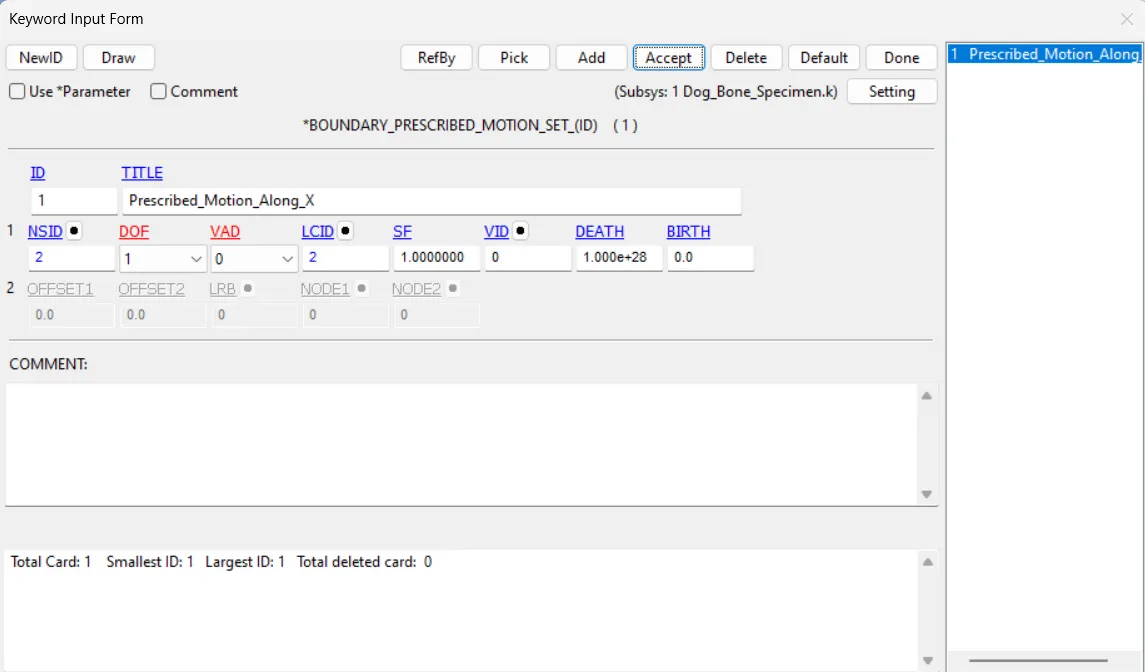
Then we need to add a PRESRIBED_MOTION_SET, to give the tensile motion to the specimen. The motion will be introduced using a displacement curve. The displacement or the change in length can be calculated from the strain
From the figure, the maximum strain experienced in the model is 0.7%, that is 0.007 and we know,
- Strain = Change In Length/Original Length
The original length can be determined by measuring the model using the 'MS Post >> Measure' option. Once measured, the original length of the model is established to be 200mm.
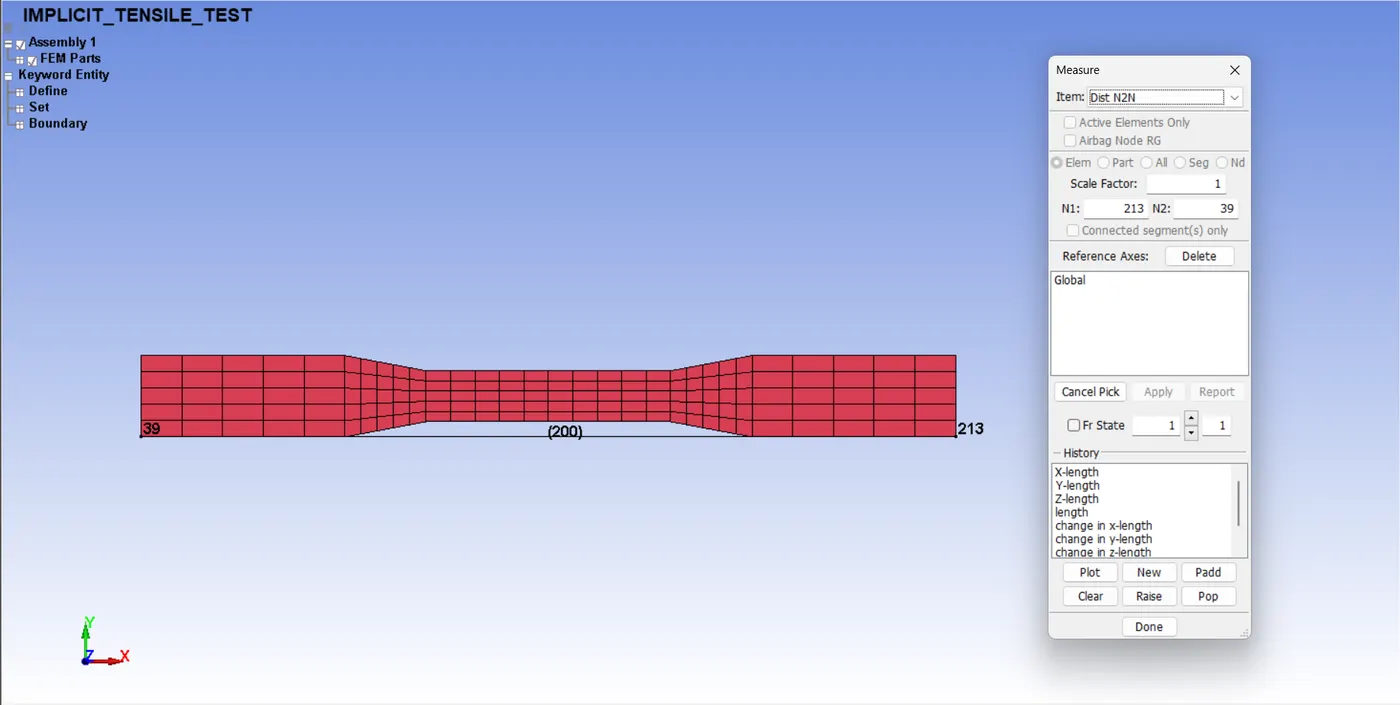
So,
- Strain = Displacement/Original Length
- Displacement = Strain*Original Length
= 0.007*200
= 1.4mm.
Define a displacement curve with a displacement = 1.4mm.
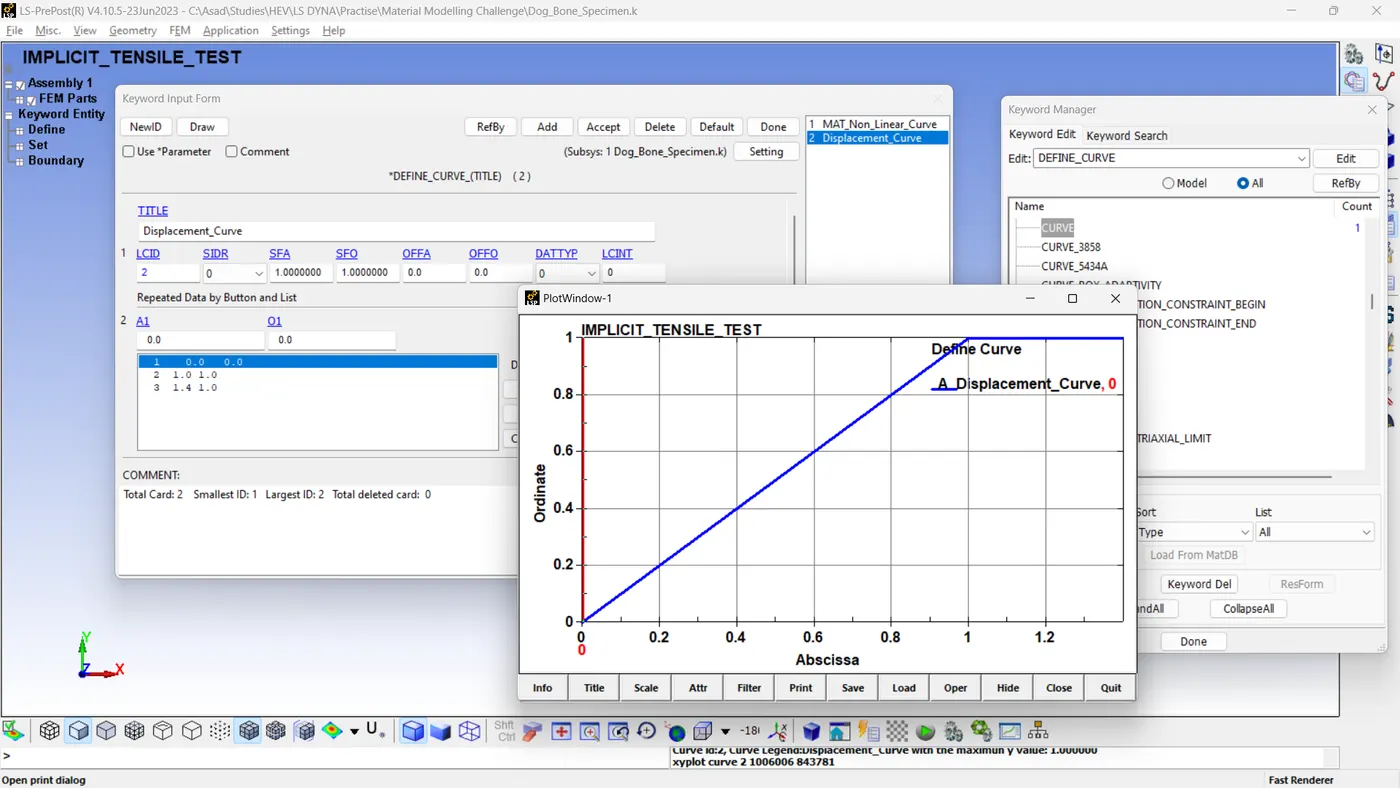
Define a PRESCRIBED_MOTION_SET for the node set on the RHS using the specified displacement curve.
Step 06: Defining Control Cards
The termination card must be defined with ENDTIM=1ms. Because we conduct implicit analysis, it is necessary to define implicit control cards. The following implicit cards should be defined with appropriate values to conduct the implicit simulation
- CONTROL_IMPLICIT_AUTO
- CONTROL_IMPLICIT_GENERAL
- CONTROL_IMPLICIT_SOLUTION
- CONTROL_IMPLICIT_SOLVER
Step 07: Requesting Output
Per the objective, we need D3PLOT as a binary output with DT=0.1ms. Additionally, it is necessary to activate the EXTENT_BINARY database card to manage the content of the binary output databases d3plot, d3thdt, and d3part. We need to enable STRFLG =1. This setting allows the output of true strain rates to be written directly to the output databases.
Step 08: Model Checking and Simulation
Model checking should be finalized, and errors identified within the model must be resolved. Save the file using a suitable name and append the '. K' extension, then proceed to save and run the simulations.
Results
Plot 01: Stress on X-Axis Vs Time (NID 93)
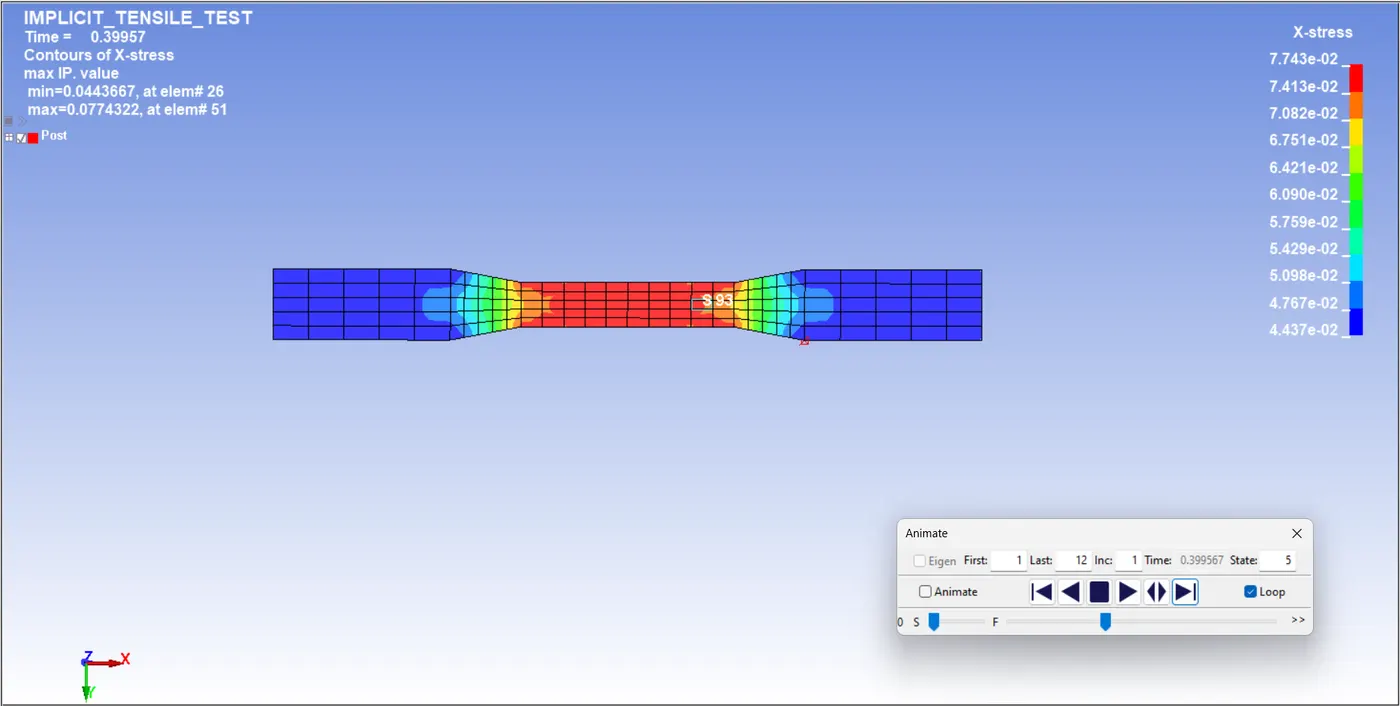
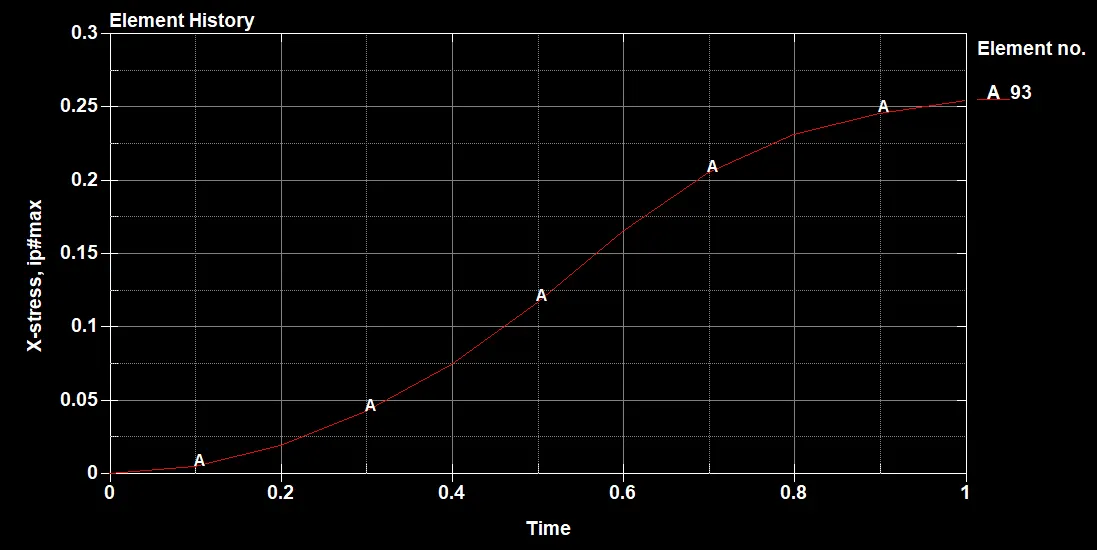
Save the plot in CSV format in a suitable location. Open in Excel to get the data points of the corresponding plot
Plot 02: Effective Plastic Strain Vs Time (NID 93)
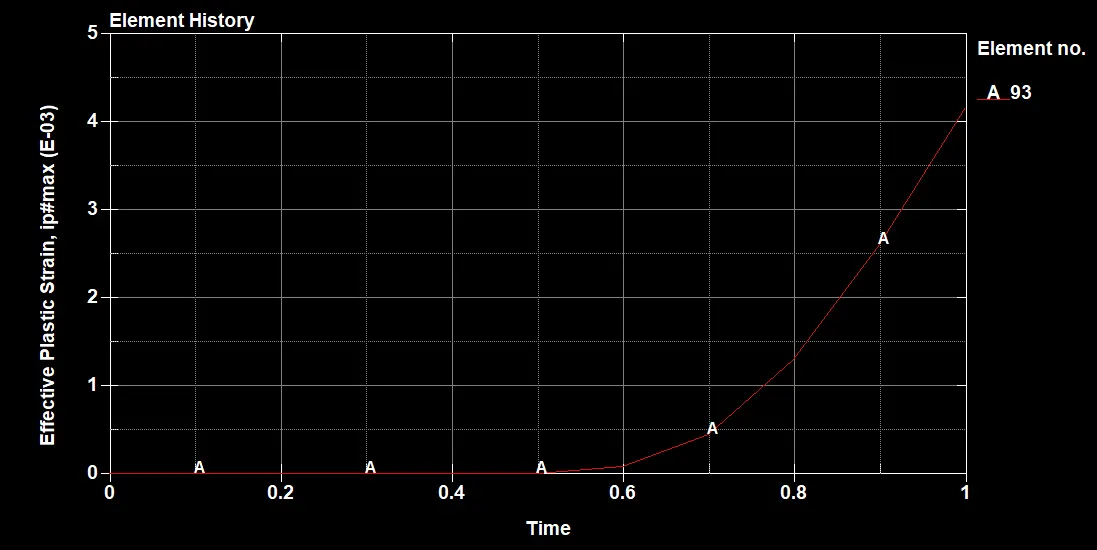
Save the plot in CSV format in a suitable location. Open in Excel to get the data points of the corresponding plot
Plot 03: Effective Plastic Strain Vs True Stress (NID 93)
Using Excel, extract the stress data, and strain data from the CSV file. Combine it and plot the True Stress Vs Effective Plastic Strain graph. This is the graph generated from the simulation data. Copy the plot generated from the raw data and paste it into the simulation data plot. Analyse the results
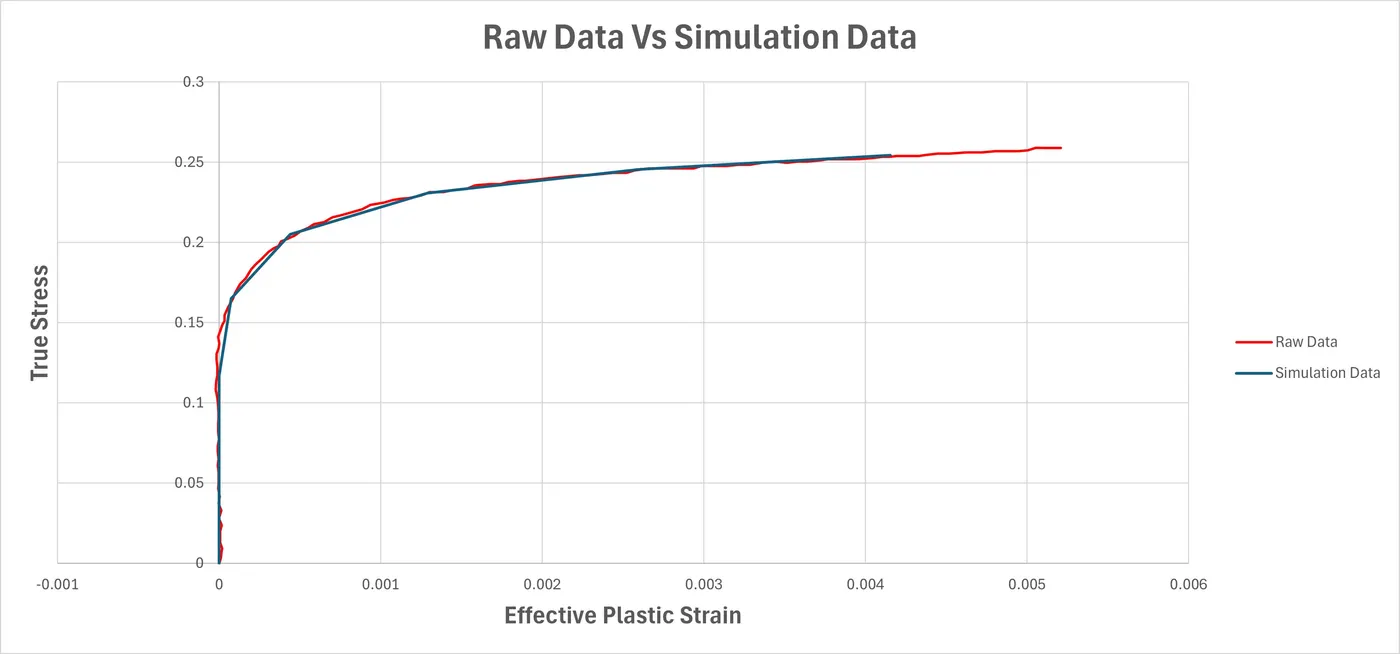
Conclusion.
The stress-strain values obtained from raw material data are found to be similiar the simulated values.
OneDrive Link: https://1drv.ms/f/s!AmE_q2zSv4Bzl2SXofd0HBX2Bt5o?e=B9yPlx