Week - 9 Material Modeling from Raw Data
AIM:
By using the diagram of the true stress/strain curve given for graphite iron casting. Create a material model for the dog bone specimen. Validate the created material model card by performing a tensile test on a dog bone specimen.
DATA EXTRACTION FROM THE CURVE IMAGE.
In general the material test data is collected as,
1. Force vs Displacement
2. Engineering stress vs Engineering strain
In this case, we got an image representing a True stress/strain curve with 3 different strain rate. From the graph, we can see the material shows elasto-plastic behavior with the elastic and plastic region although many material model exist for elasto-plastic , one of the most robust model is *MAT_024 or *MAT_PIECEWISE_LINEAR_PLASTICITY. It can also handle viscoelastic behavior.
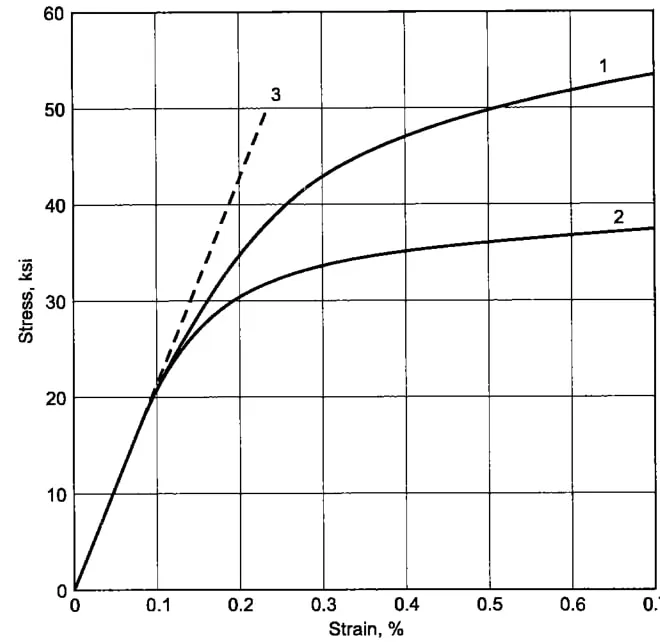
From the above plot , we will take the curve 2 data point. By using GET DATA GRAPH DIGITIZER application, the data point are extracted from an image file.
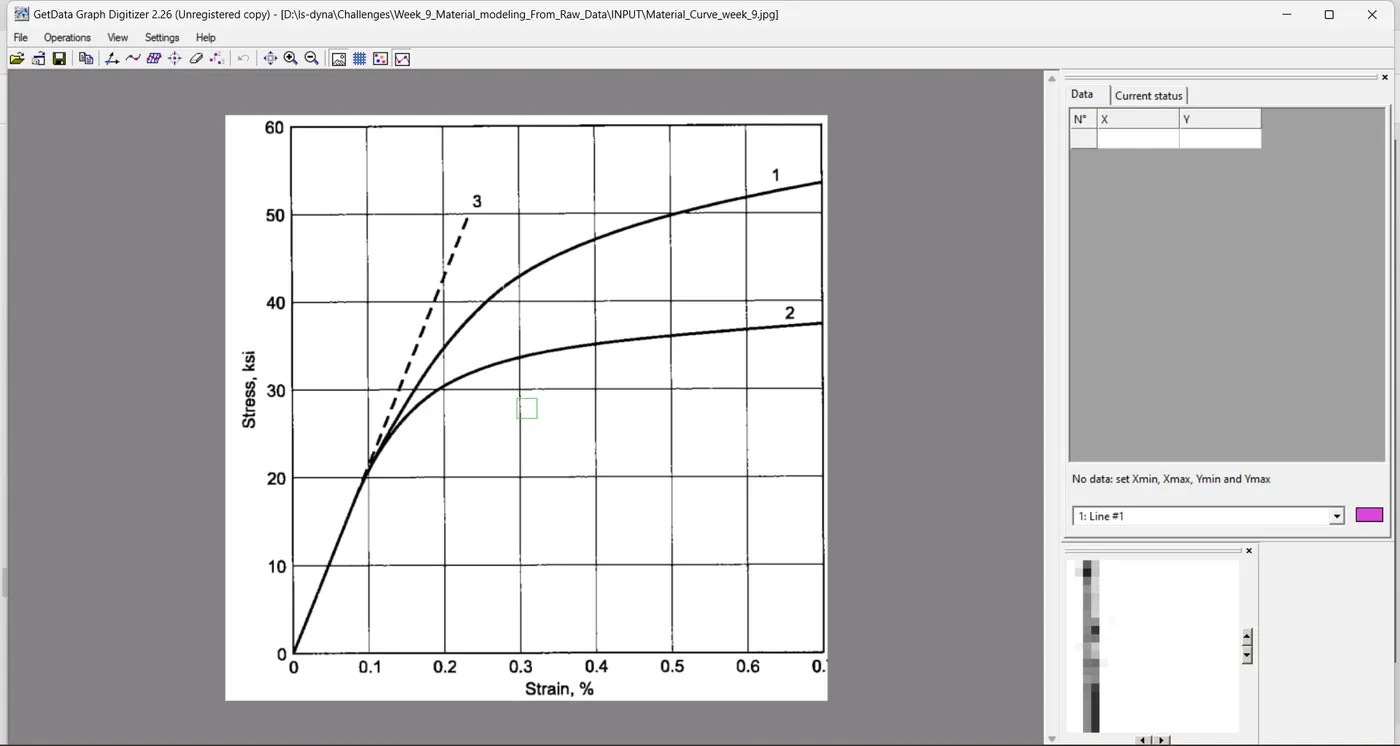
First, the image processed and the x and y are decided (min, max values). Then data point are selected from the image. Finally the file is saved in a suitable format in the local directory file.
DATA CLEAN-UP CURVE FITTING.
The data point extracted from the image is always noisy and the data point are selected manually by picking each point so there will be some human errors. We need to clean up the curve and fit the rough data. This is done by using microsoft Excel.
DATA/UNIT CONVERSION.
For the material card model we are using the SI units ie, kg/mm/ms , but if we noticed from the stress and strain graph units is given in ksi for stress and percentage for strain. So the unit of stress has to be changed from ksi to Gpa and for strain has to be changed from percentage to actual value.
0.2% OFFSET YIELD STRENGTH:
The conversion from elastic to plastic can be very subtle for many materials. So it might not be always very easy to figure out the yield point, That is ,the point on the stress-strain curve, where elasticity changes to plasticity.
In this case the offset yield strength is determined. A line is constructed parallel to the initial portion of the stress-strain curve but offset by 0.002 in/in(0.2%) from the origin.
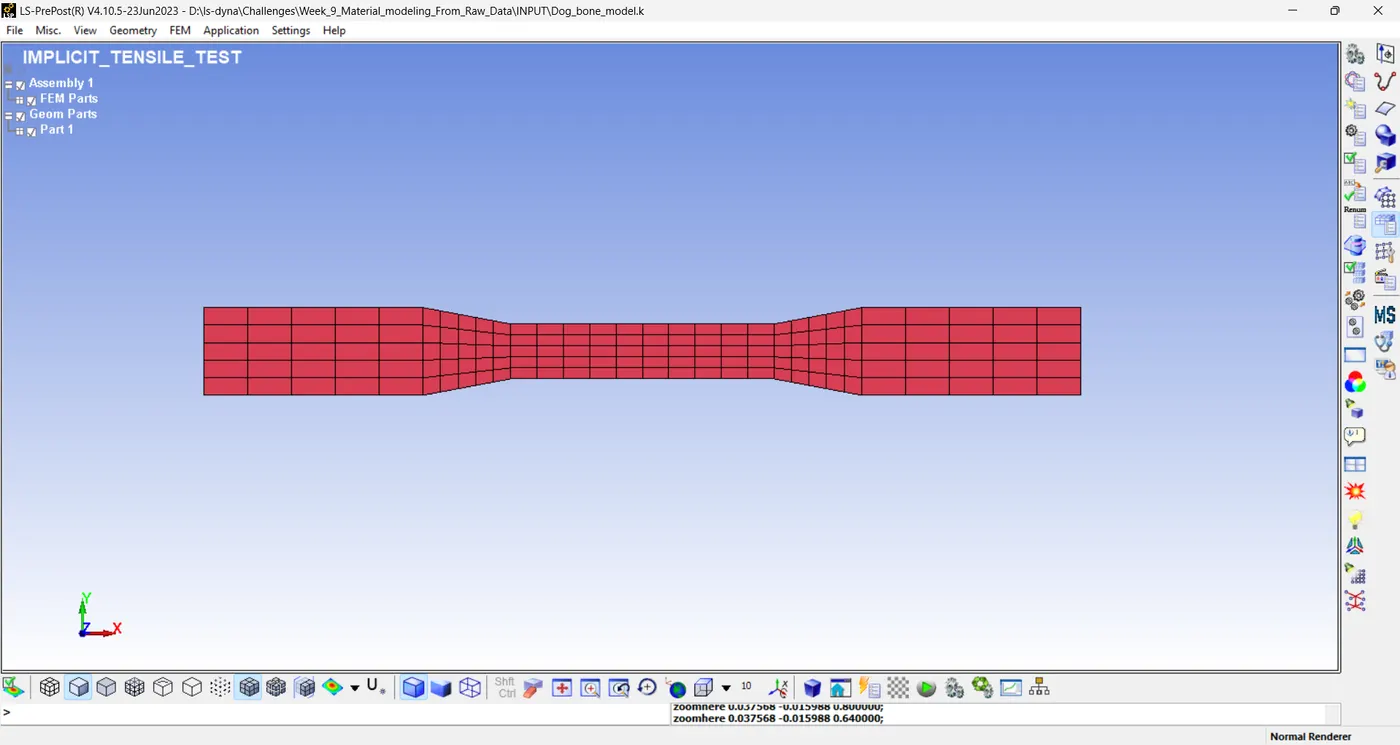
STEP 1: IMPORT THE MODEL
STEP 2: DEFINE STRESS/STRAIN CURVE FOR MATERIAL MODEL.
The stress/strain for the material is now in the form of effective stress and effective plastic strain which can be implemented on the *MAT_024. These data points for the stress/strain curve are inserted to *DEFINE_CURVE card with LCID.
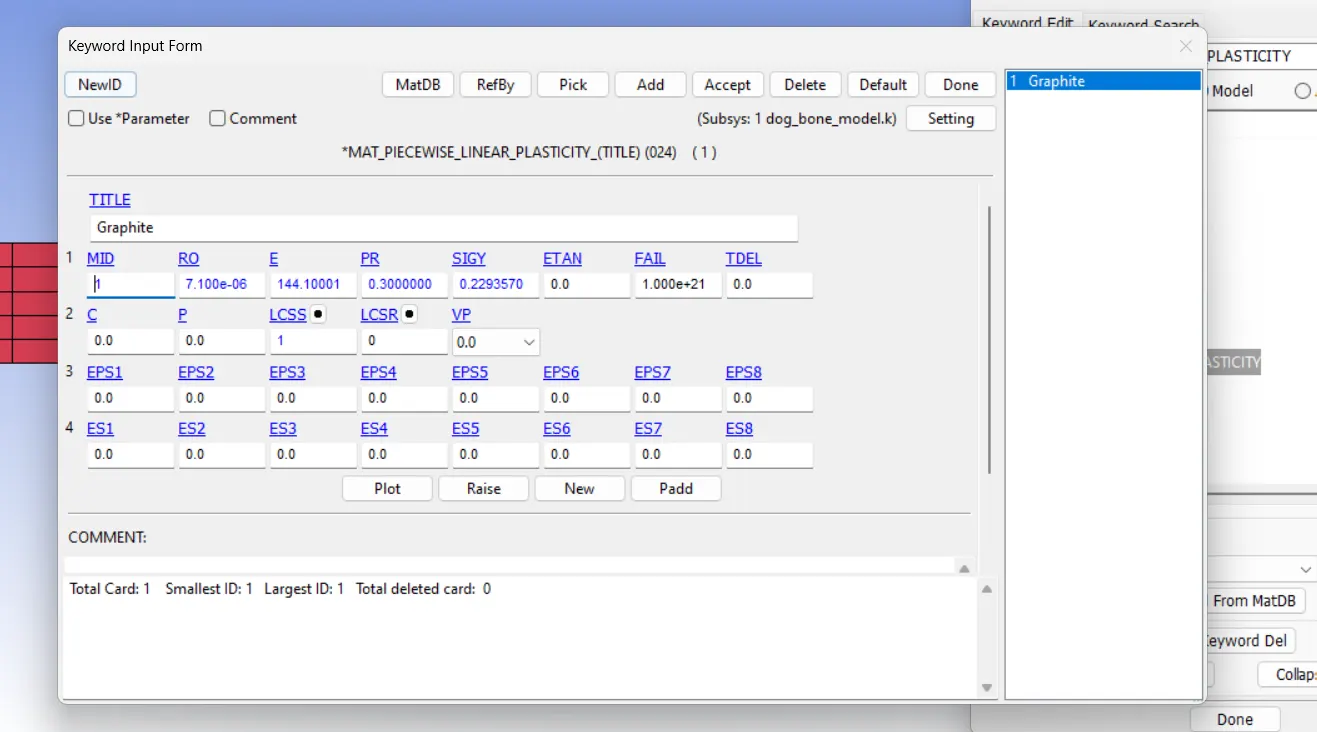
STEP 3: DEFINE MATERIAL.
STEP 4: DEFINE SECTION.
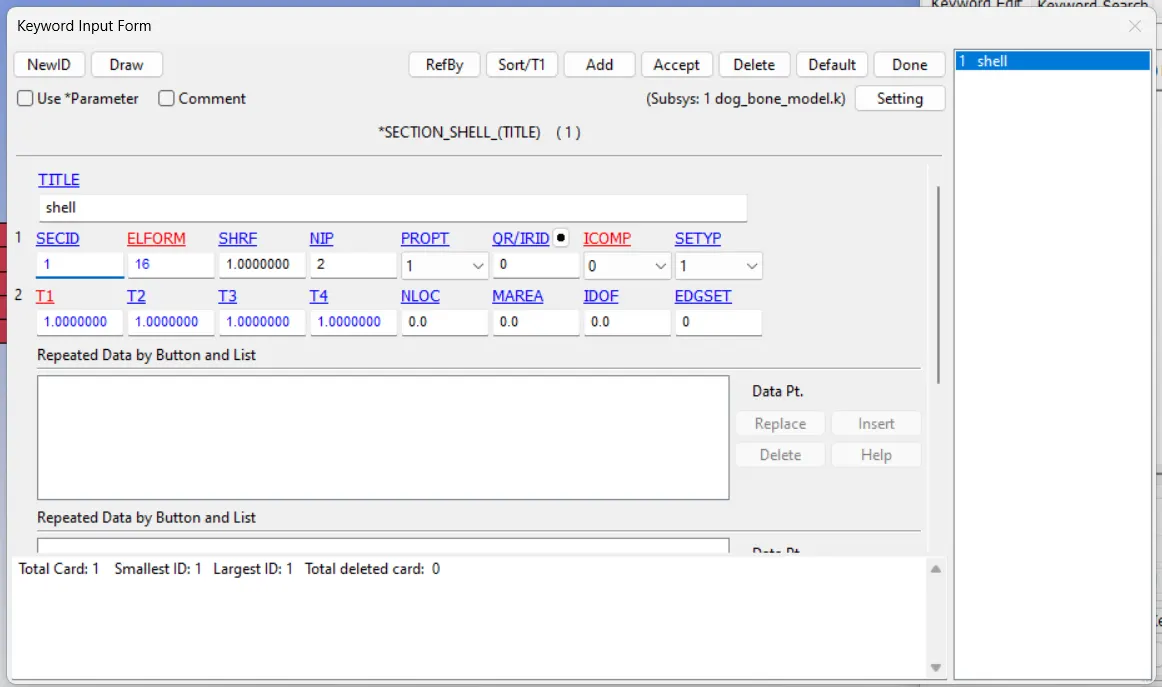
STEP 5: DEFINE BOUNDARY SPC
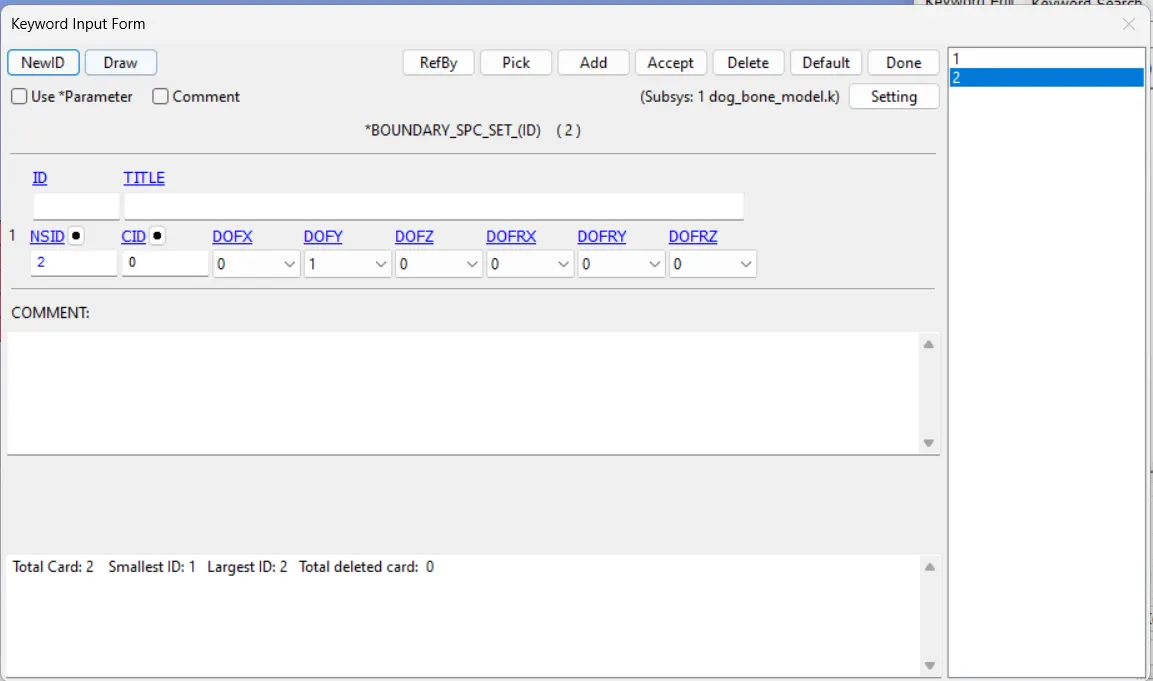
To fix one end of the model, we will constraint all the DOF except y-direction.
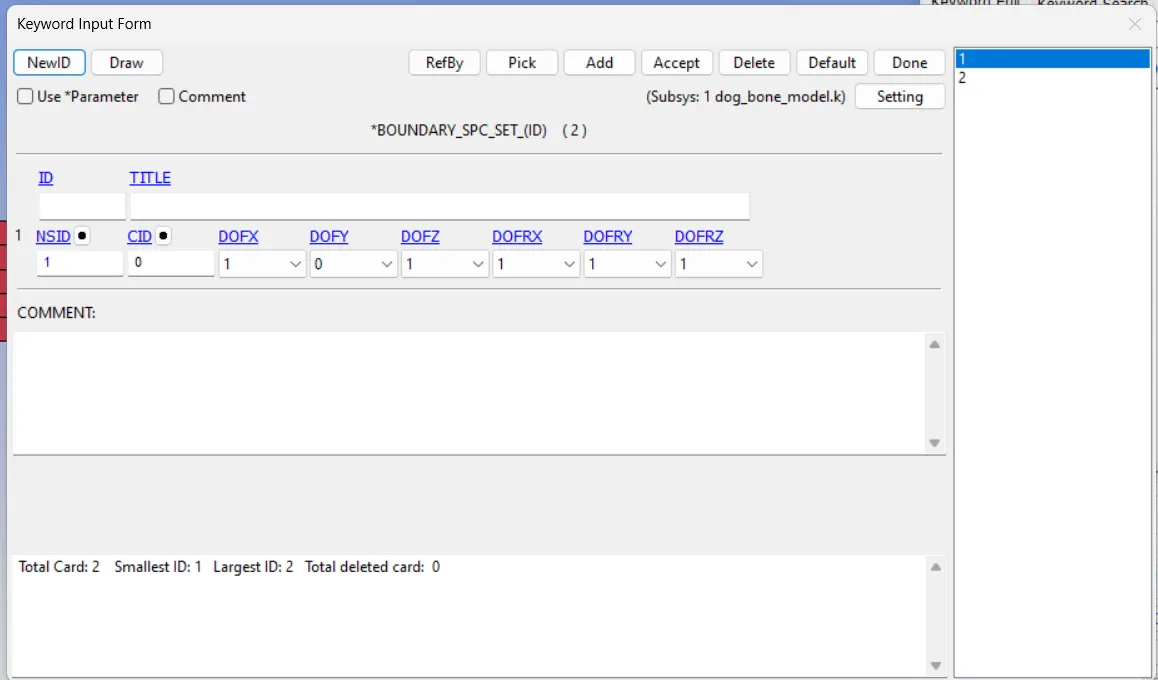
We will select the mid node on edge of both ends of the model and constraint only y-direction.
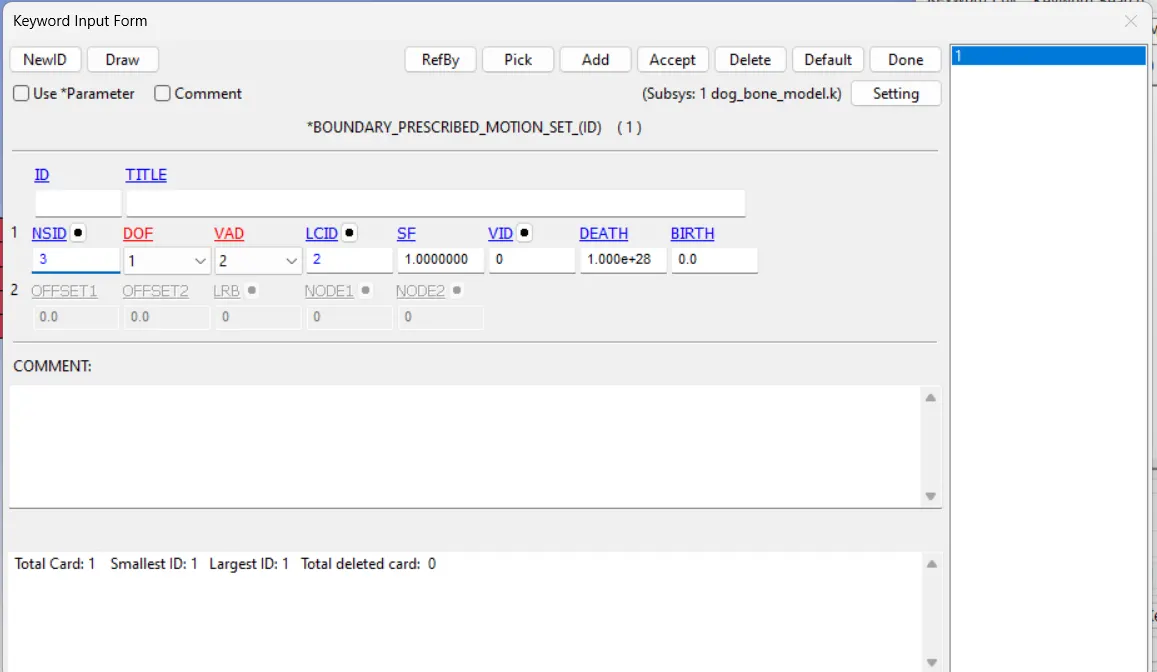
STEP 6: DEFINE MOTION.
A set of nodes is created on edge of the model in which displacement is applied.
STEP 7: DEFINE CONTROL CARDS.
1.CONTROL_IMPLICIT_GENERAL
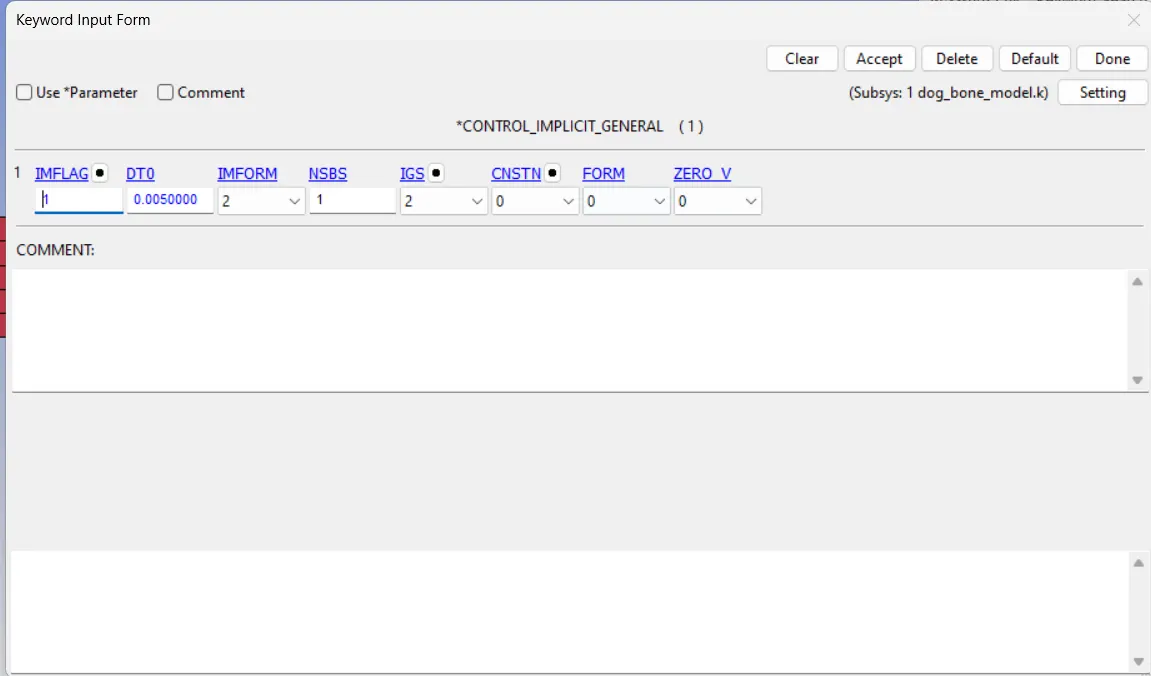
2.CONTROL_IMPLICIT_SOLUTION.
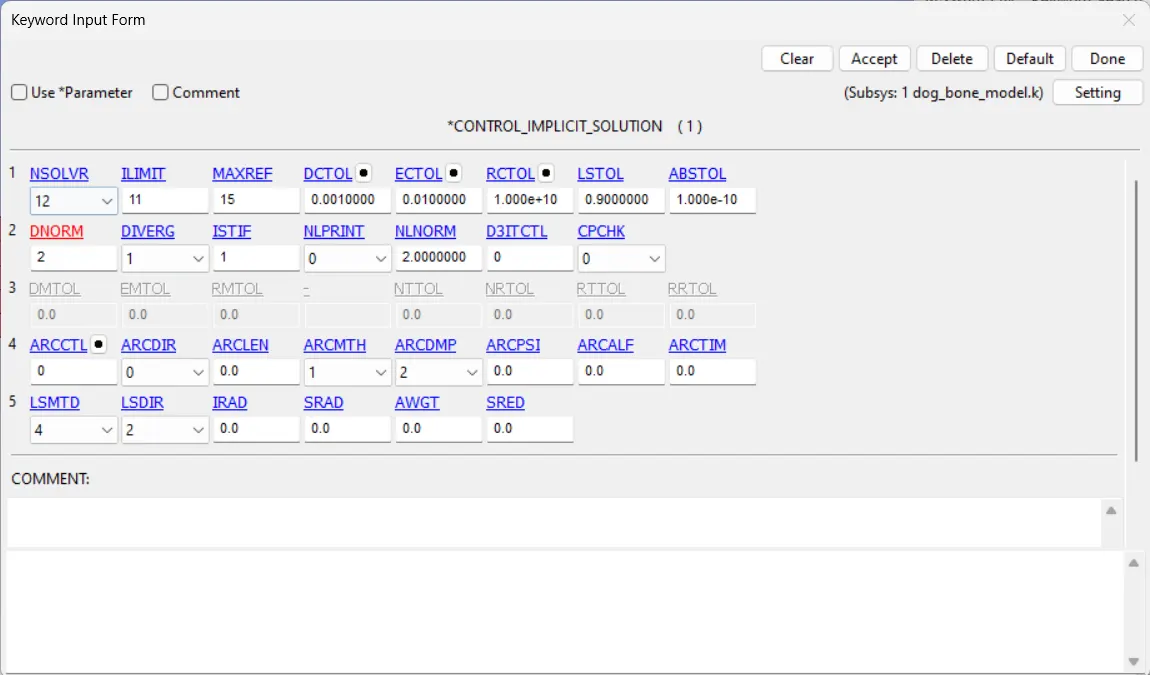
3.CONTROL_IMPLICIT_AUTO.
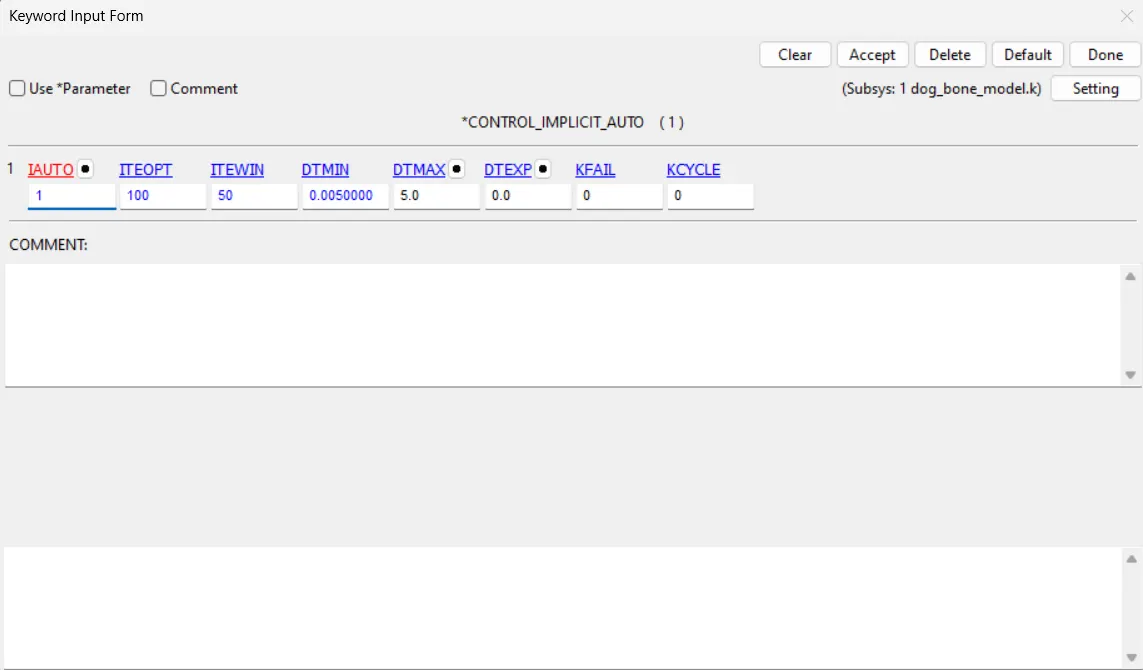
4.CONTROL_TERMINATION.
ENDTIM=10 MS
STEP 8: DEFINE DATABASE.
BINARY_D3PLOT, DT= 5.000e-05 ms
DATABASE_HISTORY_NODE: It defines nodes on model to measure the effective stress and plastic strain in both shell and node. Which possess high deformation during the tensile load.
DATABASE_EXTEND_BINARY: This writes the strain tensor to d3plot when STRFLG is set to 1.
ASCII: GLSTAT,MATSUM,ELOUT.
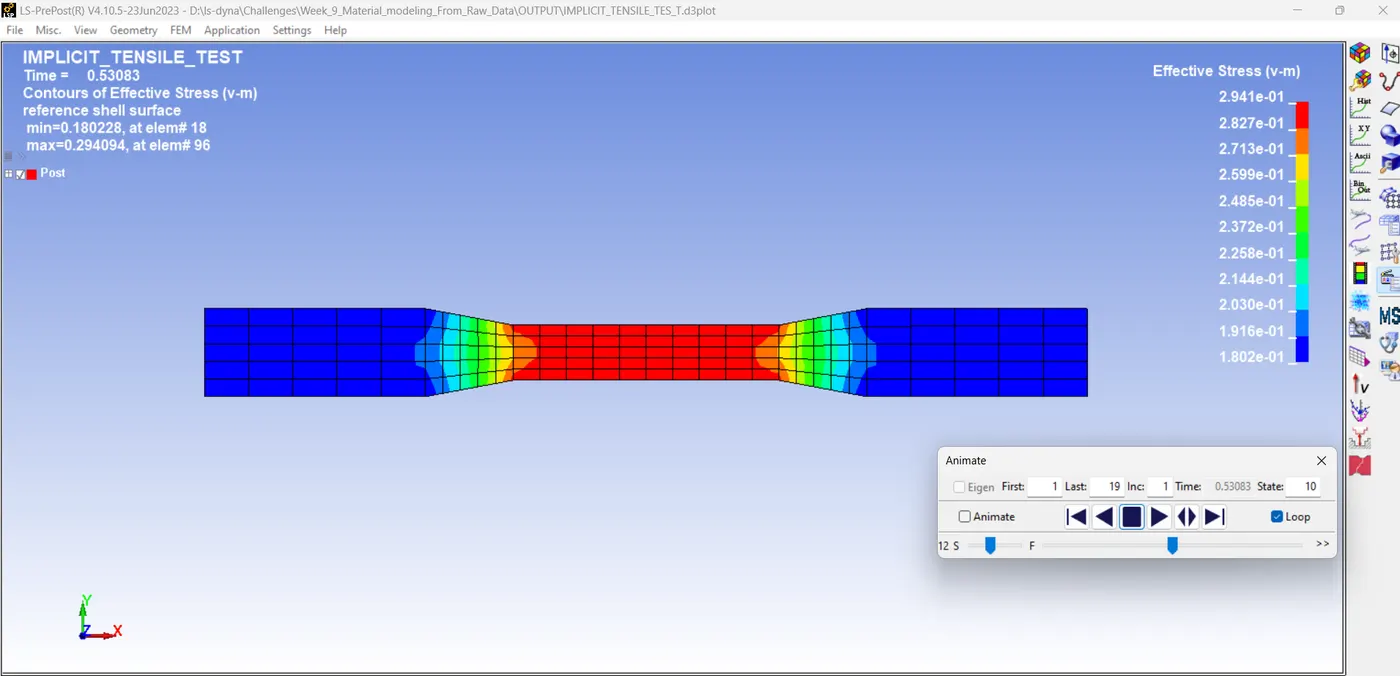
RESULT:
von mises stress
CONCLUSION:
The stress-strain data extracted from the image is validated with the MAT_024 model. The stress-strain behaviour after yielding is considered by a hardening curve which is given as input through MAT_024 card.
========================Thank You===================================