Week - 9 Material Modeling from Raw Data
*Project name:-
Material modeling from raw data
*Aim:-
Material modeling of MAT_024 (PIECEWISE_LINEAR_PLASTICITY) using digitizer and LS-DYNA.
*Objective:-
- Extract the data from the diagram
-Clean the data and visually confirm that it matches the original data.
-Here elastic modulus is 20.9E+06 psi.
-Convert the data to (kg-mm-ms) unit system
-Process the data and create the material as demonstrated
-Use the material model with a dogbone specimen and validate the same.
*Procedure:-
1) Data extraction
2) Data calulation & stress-strain curve created
3) Material creation
4) Section creation
5) Assign material & section in to part
6) Include material data in to curve
7) Definding boundary conditions & specifying initial velocity to the box.
8) Creating the control termination
9) Implicit card creation
10) Binary_D3plot & ASCII_opction define
11) Model check
12) plotting the result
1) Data extraction:-
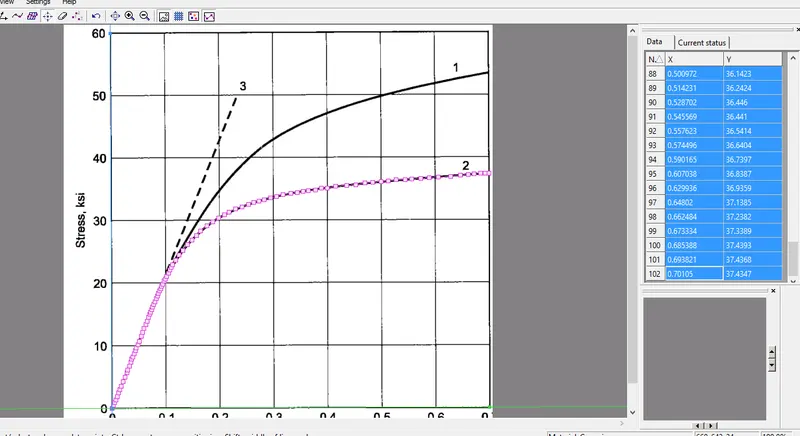
-First of all image available in the qurstion is in the png format, but in data digitizer its not support. so we need to convert in to the jpg format.
-After that we provide the Xmin, Ymin, Xmax and Ymax value and then select number of points on curve
2) Data calulation & stress-strain curve created:-
-After the number of stress-strain points generation, its copy-paste in to the microsoft excel.
-This stress-strain are engineering stresses and engineering strains value. But we required to effective plastic stresses and effective plastic strain value.
-Here engineering stresses value in the ksi(Kilogram square per inch), so first of all we need to convert in to our unit system. here, our unit system is Kg,mm,ms.
-We know the relation, `1 ksi=6894.76×10^3 (kg)/(m×s^2 )`
`1 ksi=6.89476×10^(-3) (kg)/(mm×ms^2 )`
-First of all convert to true stress and true strain.
`ε_T=ln(ε_E+1)`
`σ_T=σ_ε×e^((ε_T))`
-Now convert in to effective plastic stress and strain.
`ε_effe=ε_T-(σ_T/E)`
`σ_effe=σ_T`
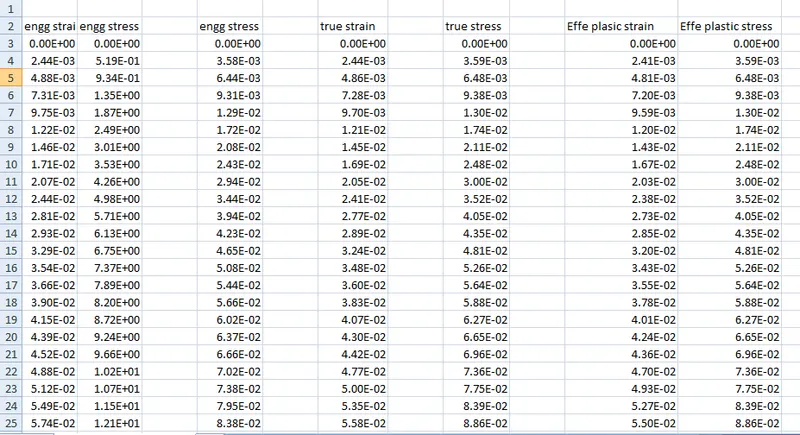
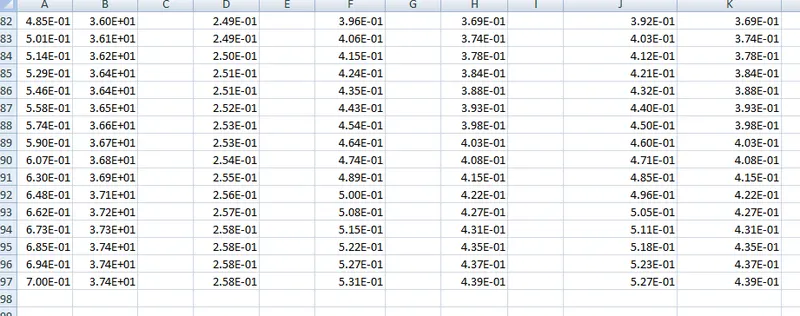
-Here use 95 strains and stresses value for define the curve.(We creates this points between 50 to 200 for best result)
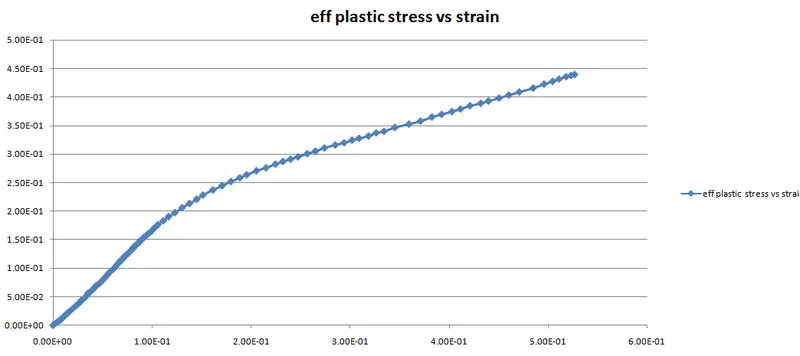
-Also plot the effective plastic stress and effective pklastic strain curve.
3) Material creation:-
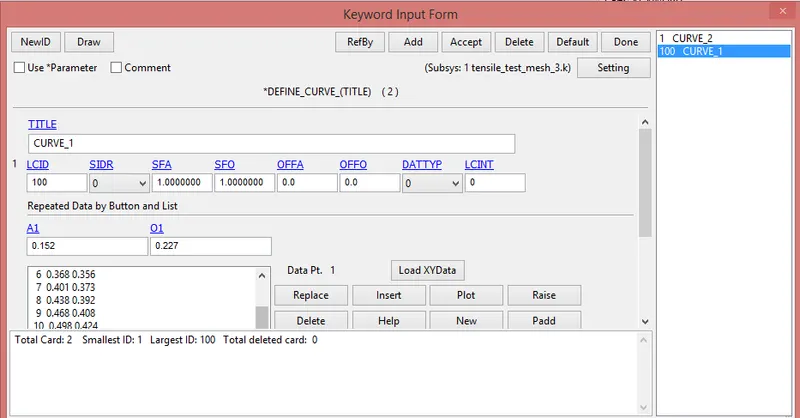
-For that first of all define the curve.
-For that go to Model and part> Keywords> All keywords> Define> Curve
-Then create the curve without the input values f stresses and strains.
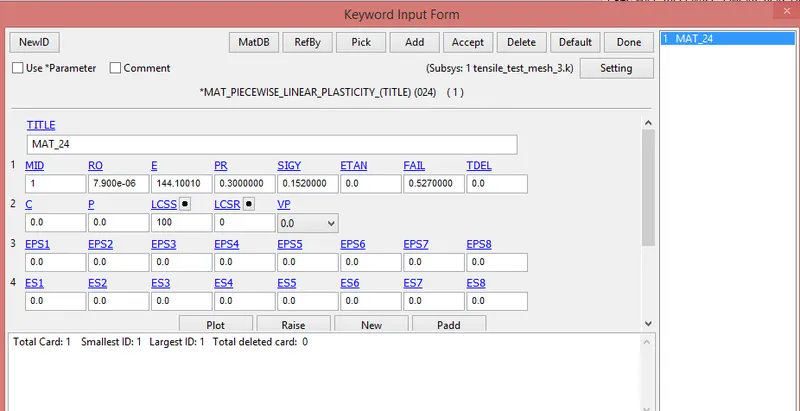
-Hete we create *MAT_PIECEWISE_LINEAR_PLASTICITY model.(*MAT_024)
4) Section creation:-
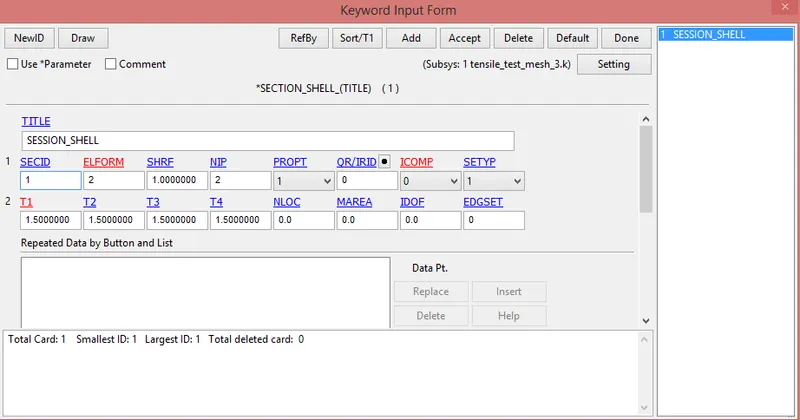
-Now we create section shell.
-For that go to Model and part> Keywords> All keywords> Section> Section shell
5) Assign material & section in to part:-
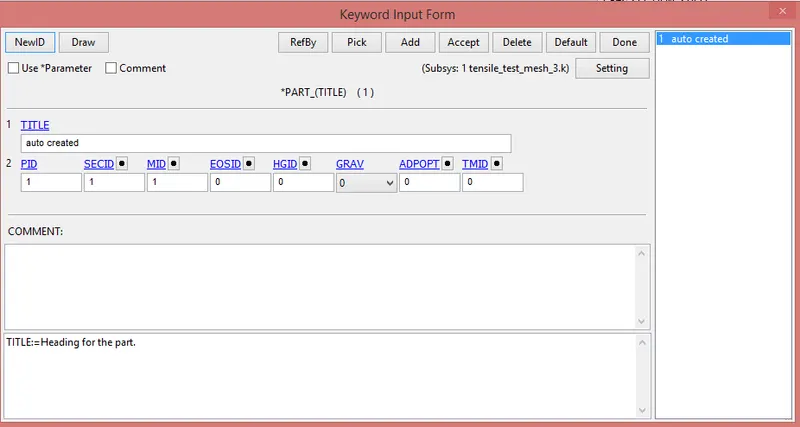
-After the material and section creation next step is that assign in to the part.
-For that go to Model and part> Keywords> model> part
6) Include material data in to curve:-
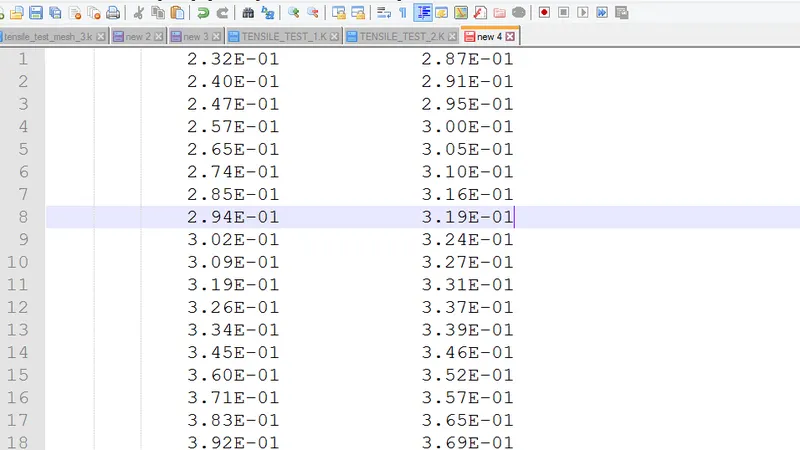
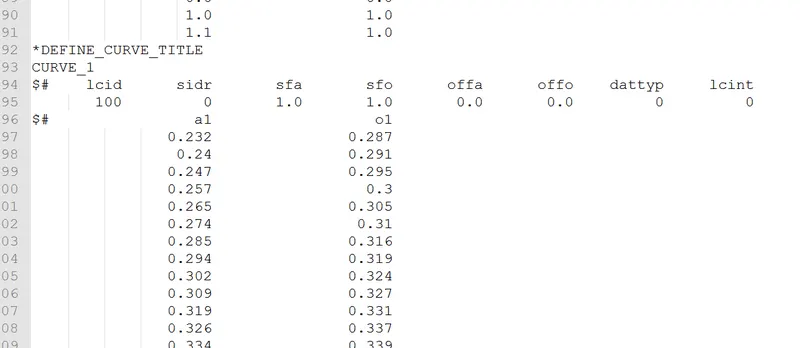
-The data of effective plastic stress and strain are copy and paste in to the notepad++ and its inclue in to the curve_1.(It is create for the material)
-This values also put in the curve in our keyword file.
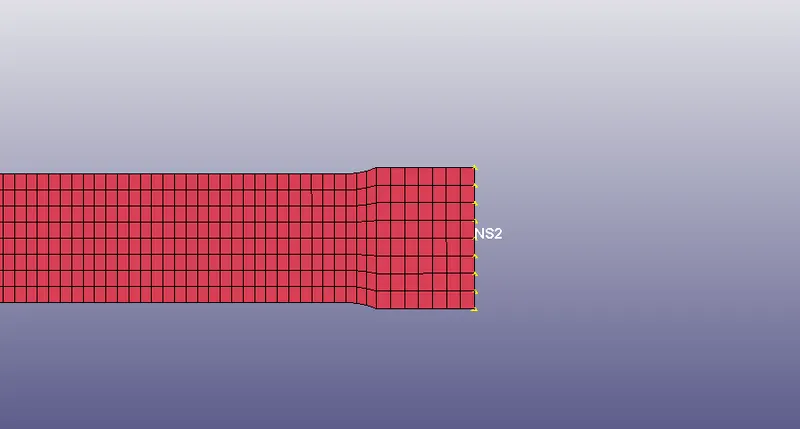
7) Definding boundary conditions & specifying displacement:-
-In this model we do a tensile testing.
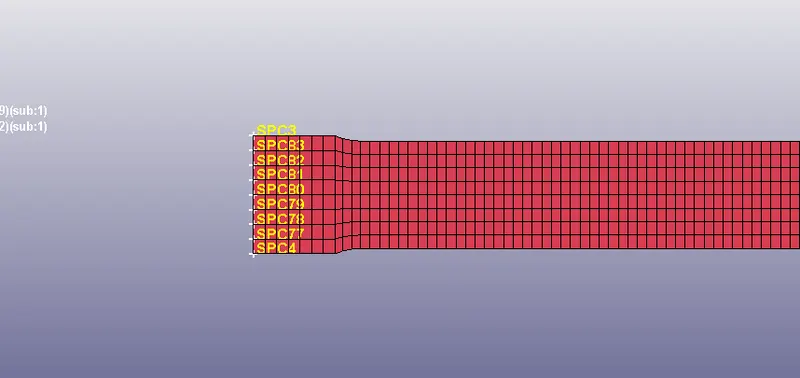
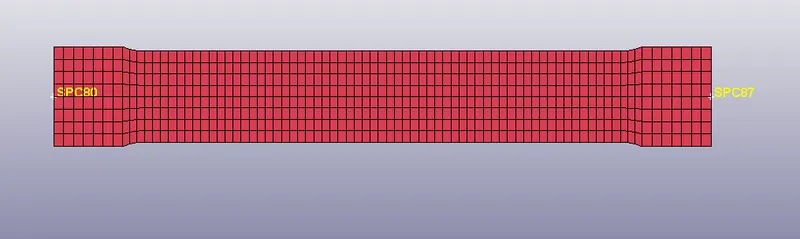
-For that we provide one side is fixed and apply displacement to another side.
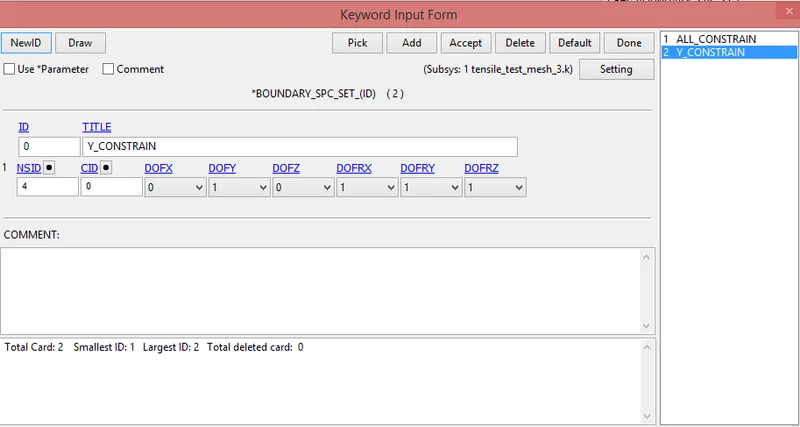
-There are two types of boundary condition provide for this model.
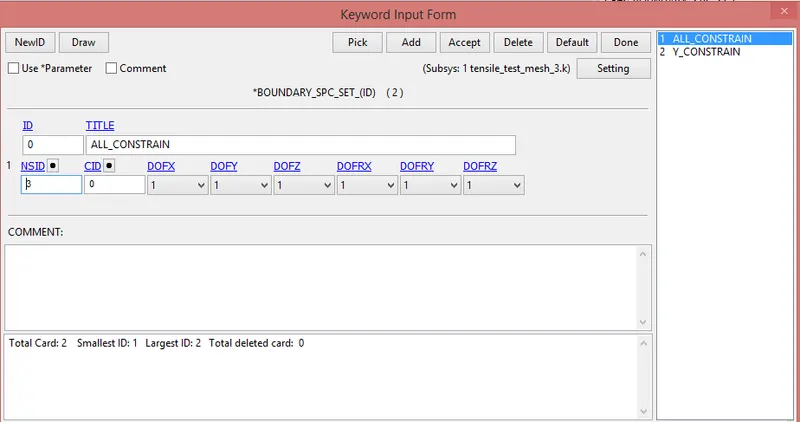
i)SPC:-
-Here nodes are fixed in all direction.
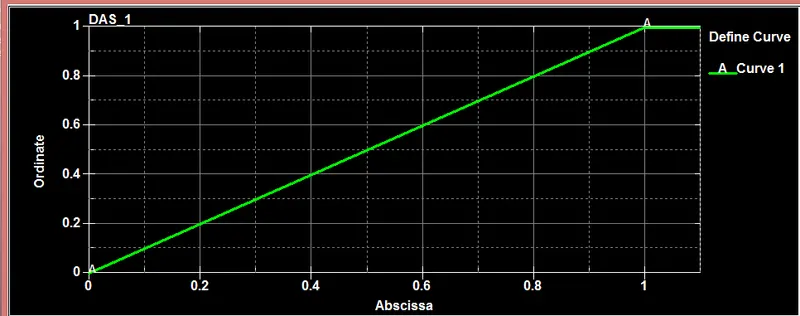
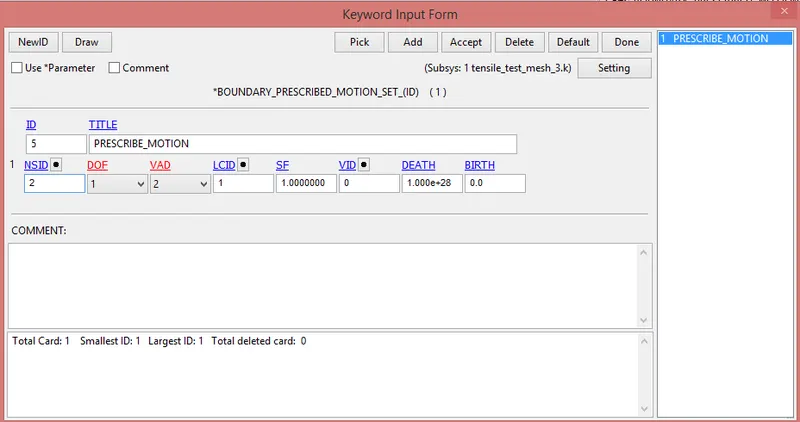
ii) prescribe motion set:-
-First of all create the curve for define acceleration.
-For that go to Model and part> Keywords> All keywords> Define> Curve
-Then go to boundary and select this data.
8) Creating the control termination:-
-For that go to Model and part> Keywords> All keywords> Control> Termination
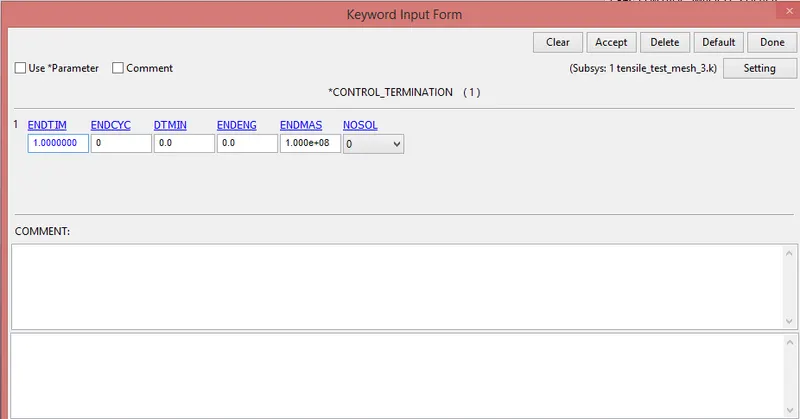
-Here provided termination time is 1 ms.
9) Implicit card creation:-
-For runing static strutural analysis implicit solver is a best, So we required some control card t convert implicit from the explicit.
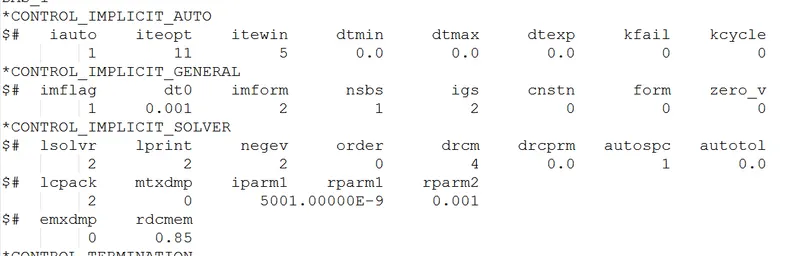
-CONTROL_IMPLICIT_AUTO card is used for control timestep during implicit analysis.
10) Binary_D3plot & ASCII_opction define:-
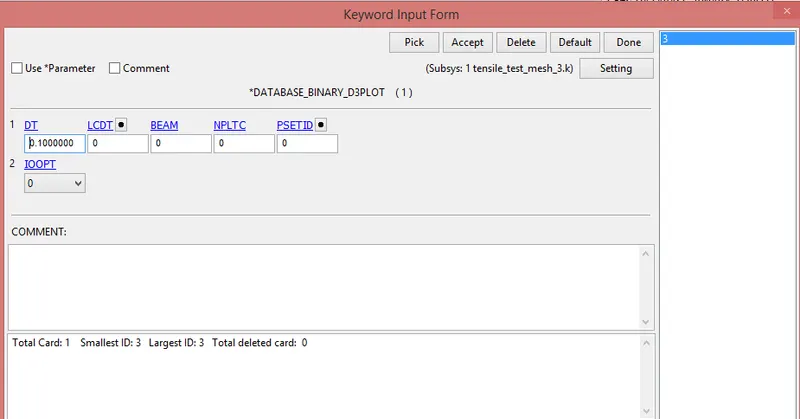
*BINARY_D3PLOT:-
-In this keyword the frequency with which the animation is to be crated will be given and is set to 0.01 ms.
*ASCII_OPCTION KEYWORD:-
-in this keyword
1)GLSTAT-Global data
2) ELOUT
 11) Model check:-
-After assigning all the keyword check the model using the model checker and find any error or not.If any type of error then remove it.
-After that save the file as a".k" format.
-Run the file in the solver. if it's end as a normal termination then model is correct.
12) plotting the result:-
-After that open D3 file in LSPP.
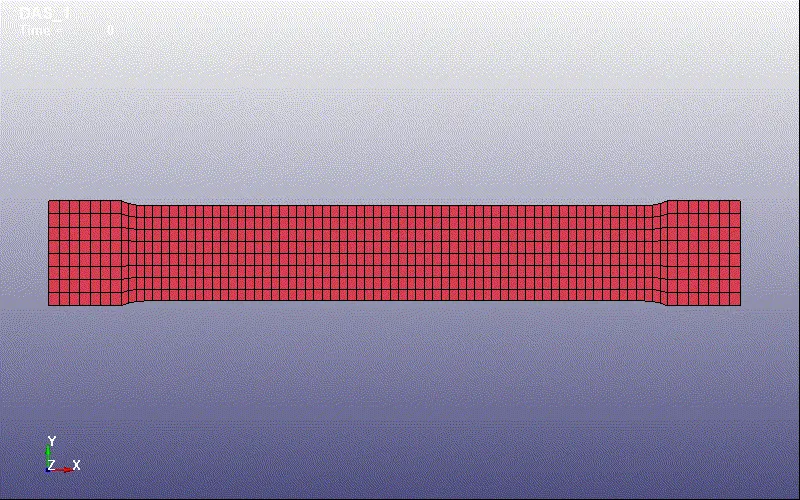
1)Animation is as shown below:-
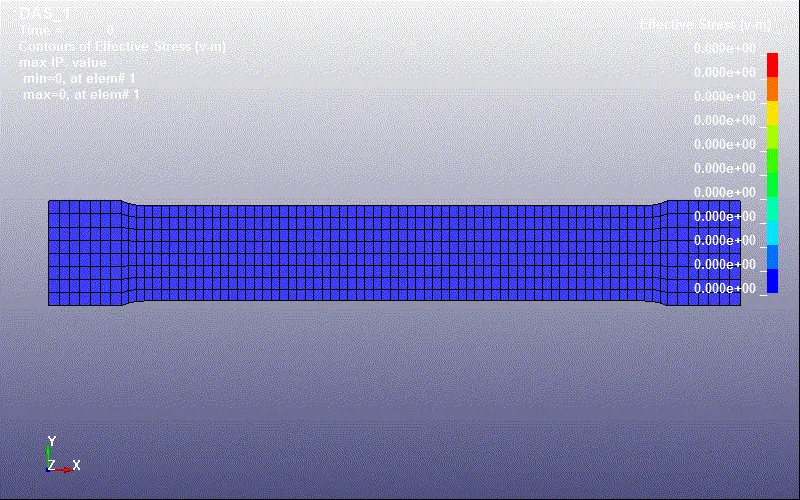
2)Animation of von-mises stress is as shown below:-
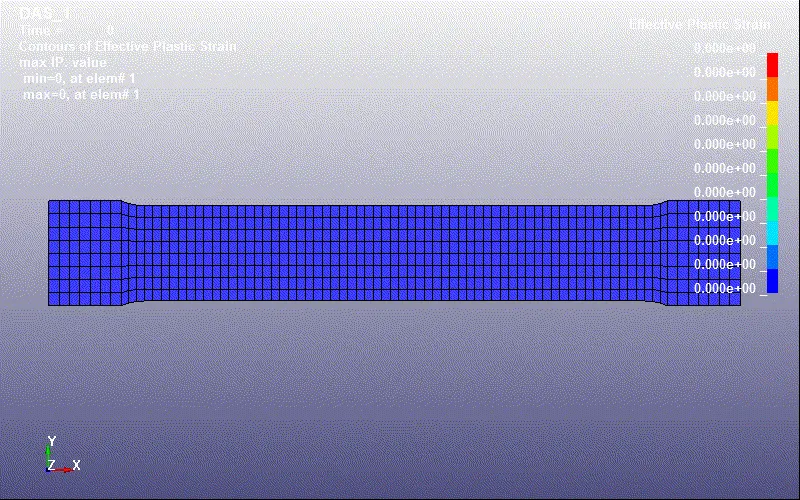
2)Animation of effective plastic strain is as shown below:-
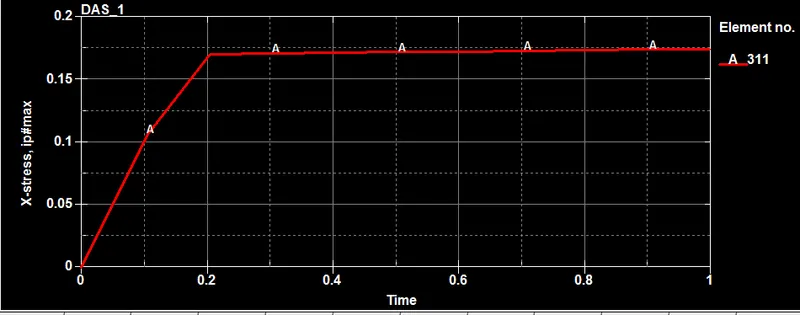
*Graph of X-stress vs time-
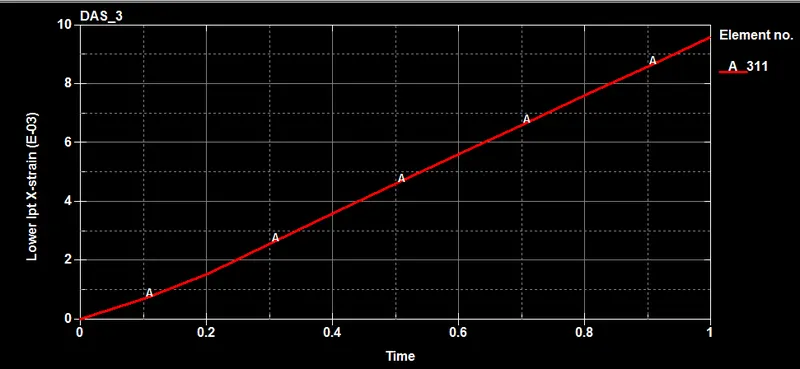
*Graph of lower IPT X-strain vs time:-
*Graph of X-stress vs lower IPT x-strain:-
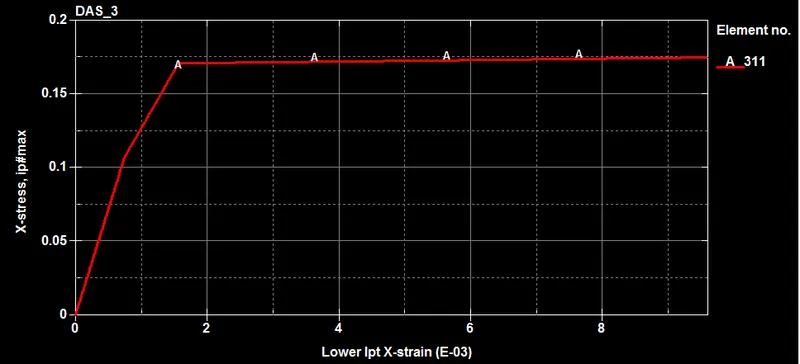
-This data is stored and export in the excel for the validation.
-The lower ipt x-strain data is considered as a true strain.