Material Modeling from Raw Data
AIM:
Material modeling of MAT- 024 (PIECEWISE_LINEAR_PLASTICITY) card from raw data using data digitizer and Ls-Dyna.
OBJECTIVE :
1. Extract the data from the given graph image by using a data digitizer.
2. cleaning the data and plot the graph to check the data is matching with original data.
3. Convert the data into the required SI unit by calculation. here the unit system taken is kg-mm-ms, GPA.
4. Plot the data as a curve to define in the material card.
5. Setup the simulation for the tensile test on dogbone specimen to get the results.
6. validate the output data by checking that it matches with the original data.
PROCEDURE :
Lab test data of Graphite Iron casting Image is provided where the data points should be Extracted.
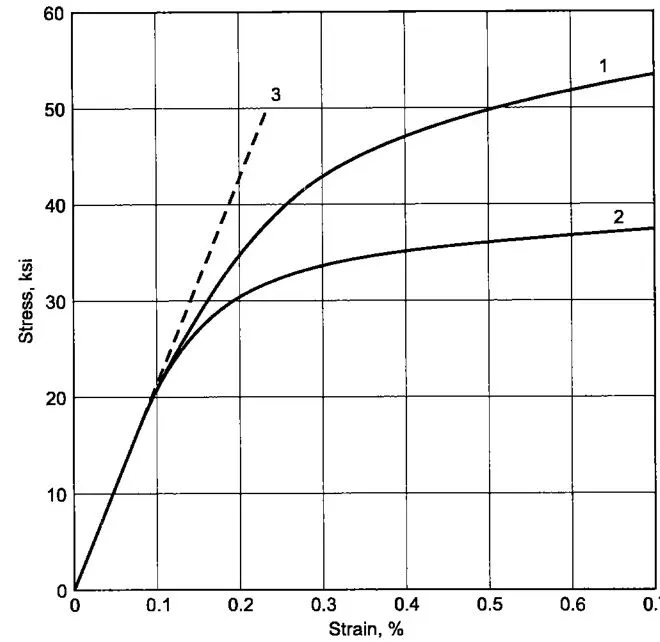
The Data Points can be Extracted with the help of a Data digitizer, Scale the X-axis with its limit (0, 0.7) and Y-axis with its limit (0, 60)
select points on the curve Using the point capture option.
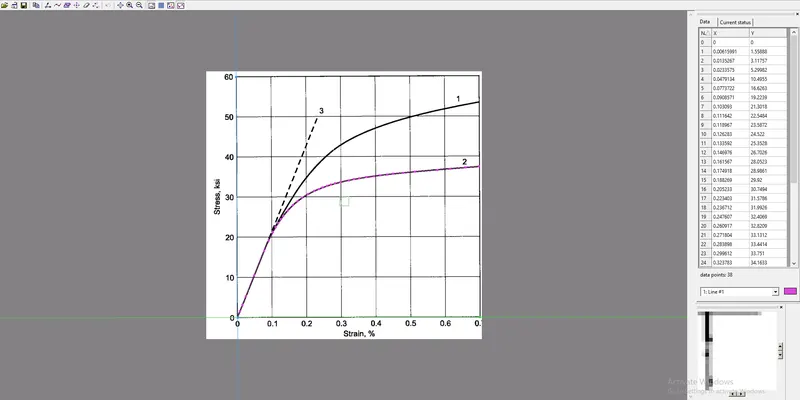
The points Exported Excel format where the data has to need cleanup so that it works perfectly in the LS-DYNA.
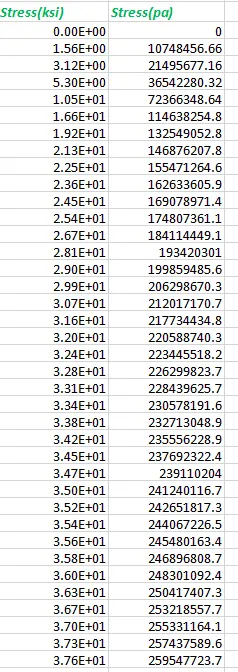
The Stress is plotted in Ksi and the Strain is in %, so the Conversion is done in excel and The Effective plastic strain Curve is Applied to the Material MAT_024_Peicewise_linear_plasticity
The Graph is Plottted using these points.
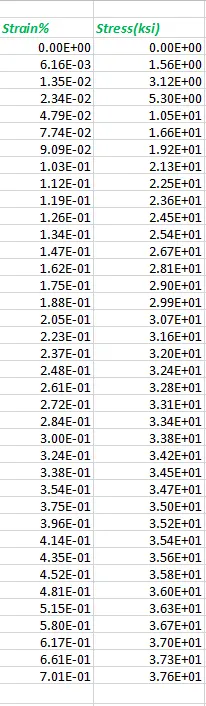
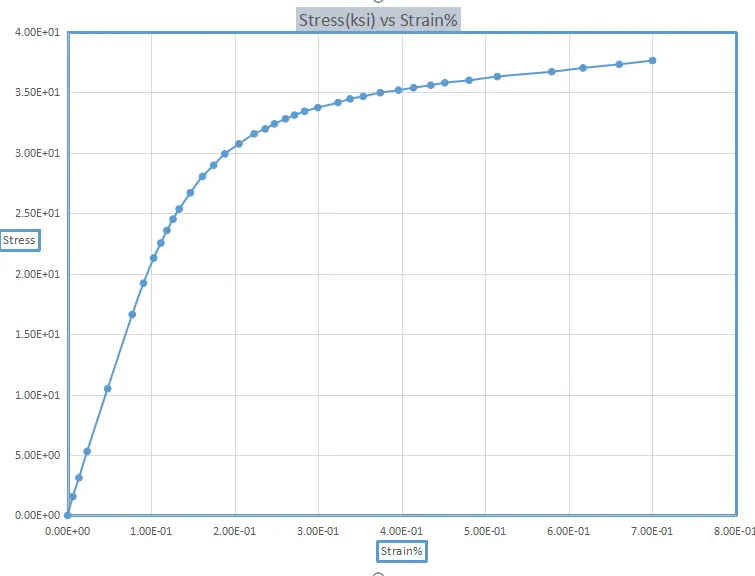
The Graph indicates the Stress(KSI) vs Strain% graph with the Points captured from the image, to make sure that the data points are giving the exact same plot as the material curve. So the curve in excel seems to be an exact copy of the material curve, but we can see some noises in some regions. This is due to human error associated with picking the points. So we need to clean up that data. The solver rejects the curve if it is Noisy Ls Dyna will accept only the monotonically increasing curves. So we need to clean up that curve.
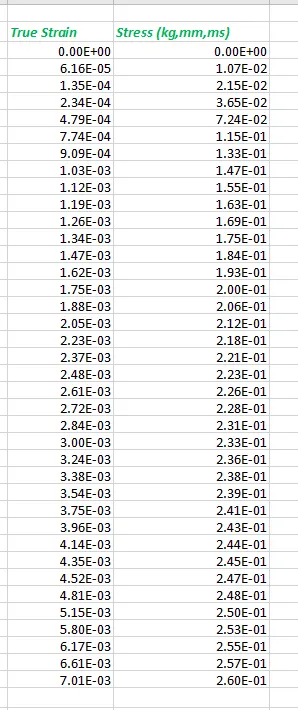
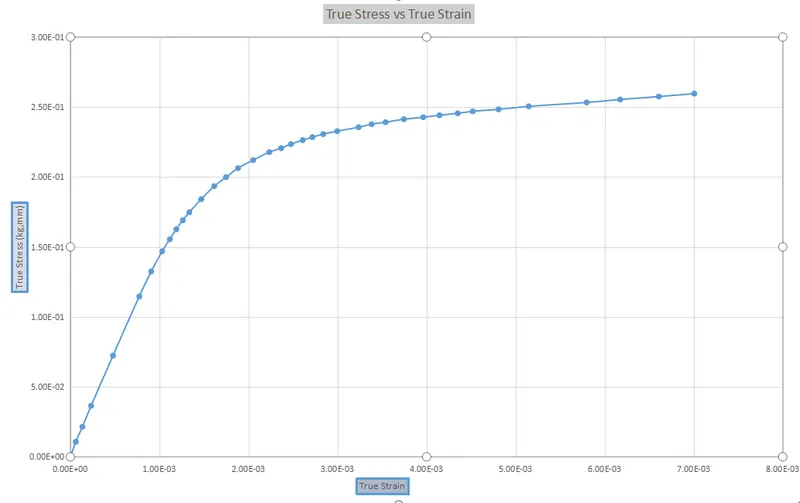
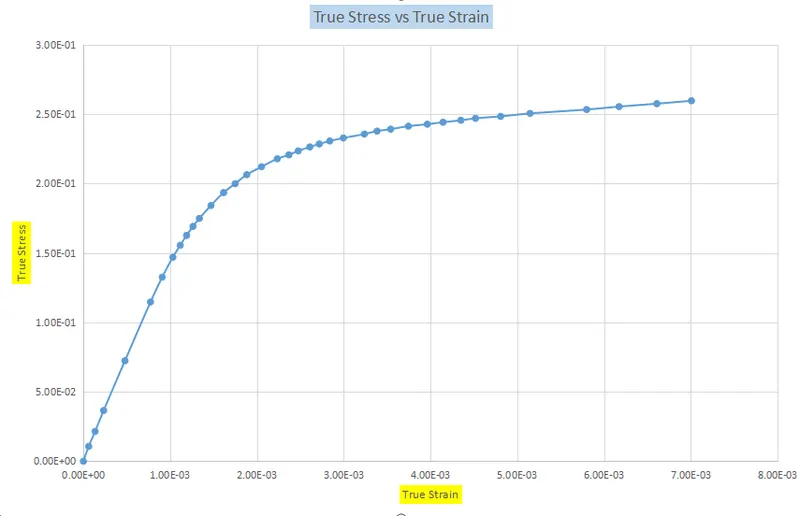
The Value Obtained are True stress and Strain values, The Strain% is Converted into True Strain by diving 100 by it, and the Stress is Converted in Kg, mm, ms, and True Stress vs True Strain Graph is Plotted
Calculations:-
The Stress value Is Converted from kilo pound per square inch (KSI) to pascal.
The Unit kg/mm/ms is used in the system. The conversion factor from Pa to kg/mm/ms for pressure /stress is 10^-9. The Stress value is Multiplied with E-09 to get Effective Stress values
The Effective Stress vs effective Strain Graph is Plotted
Young's Modulus:
The Value of Youngs Modulus Given from the Data is 20.9E+06 psi.
The SI unit of Young's modulus is pascal
20.9E+06 psi=144100427423.7 pascal
It is then multiplied by factor 10^-9 to KG, mm, ms
Young's modulus=144.1004
The Effective Plastic Strain is Calculated from the True Stress And Strain values to Input the Plastic region in the Curve
As the Elastic region of the curve can be easily fitted Using Values Like Density, Youngs Modulus, and Poissons Ratio, The Plastic region of the curve is obtained by neglecting the Elastic region of the Curve (ie) From the yield point
Fro Calculating Effective Plastic Strain:-
Elastic strain = True Stress /Elastic modulus
Total true strain = Plastic strain - recoverable strain
The Effective Plastic Strain= Total True Strain-Total True stress / E
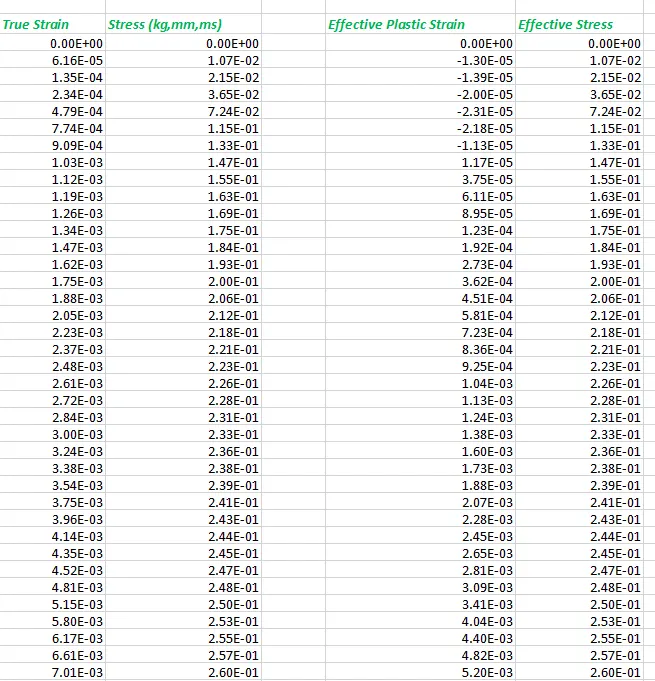
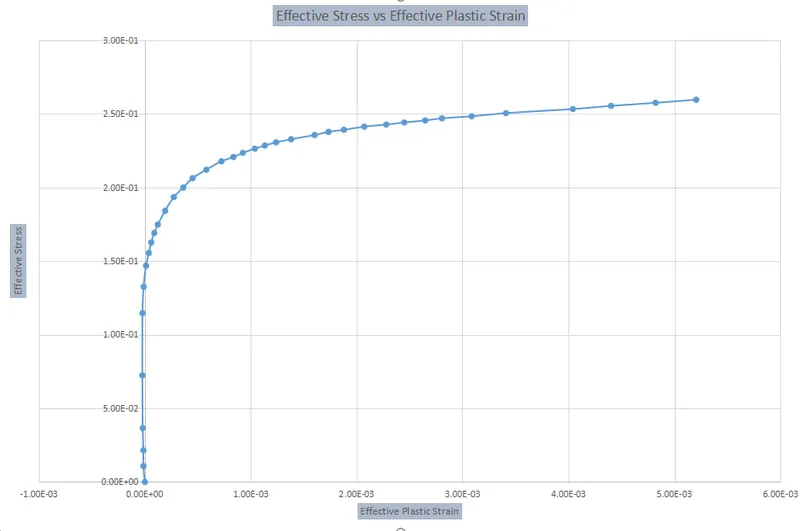
From the Graph, we can see that The Non-leniarity of the Curve Strats at 1.47E-01 Gpa, So it's Considered as the Yield Point and The Curve after the Yield Point is Taken.
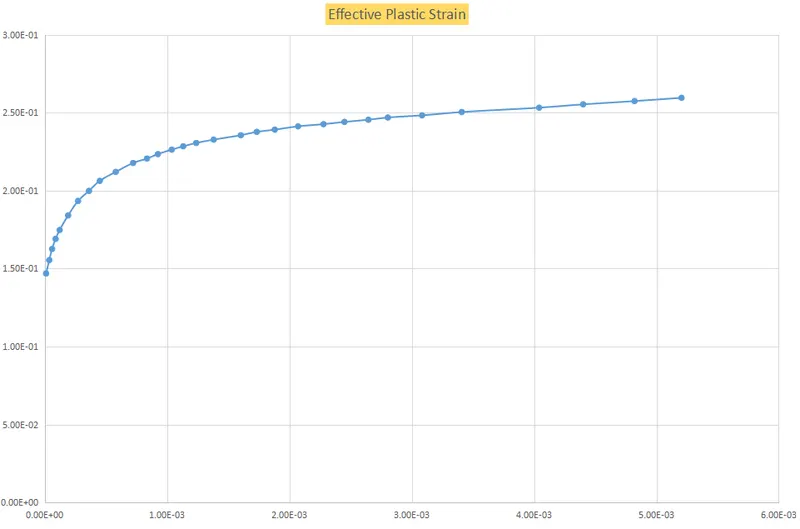
These Values are Taken into account and Inputted as Load curve LCID For Tensile Test using Dogbone Specimen In LS-Dyna
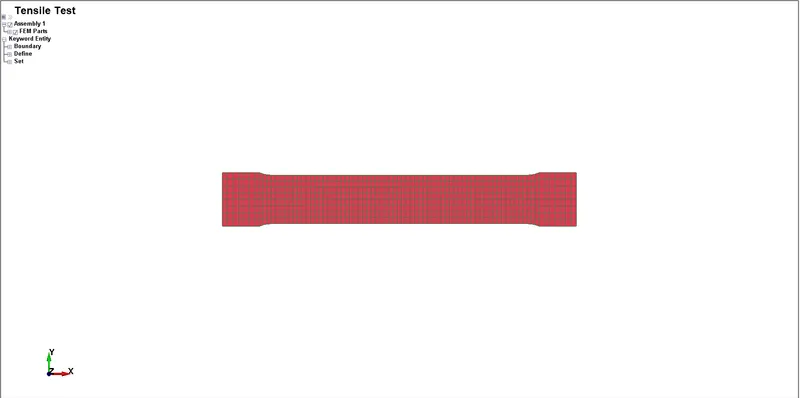
The Keyword Tensile_Test_mesh Is opened in LS-Dyna
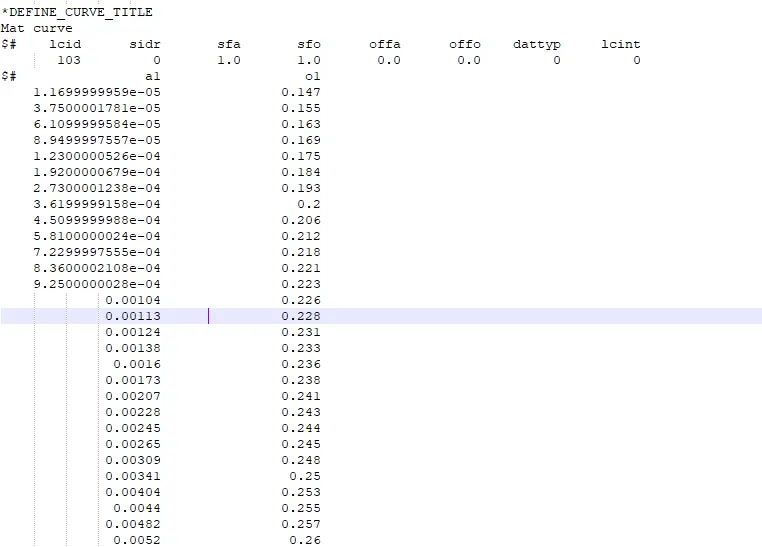
For Inputting the Values Choose to Define > Curve In keyword and Input the Values Starting from the Yield Pont
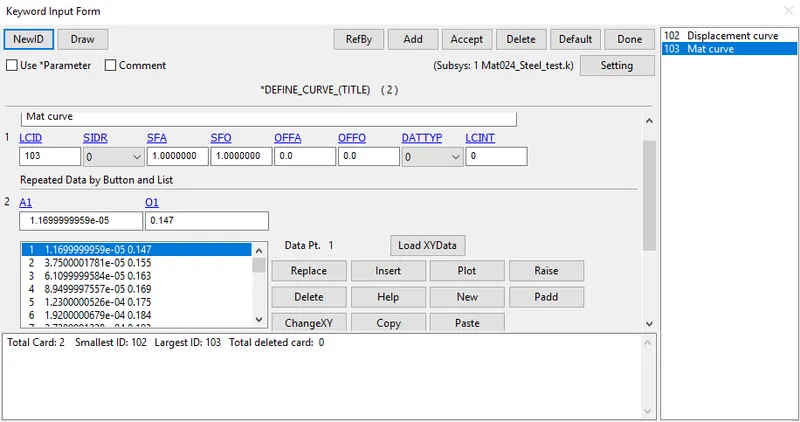
Section Creation:-
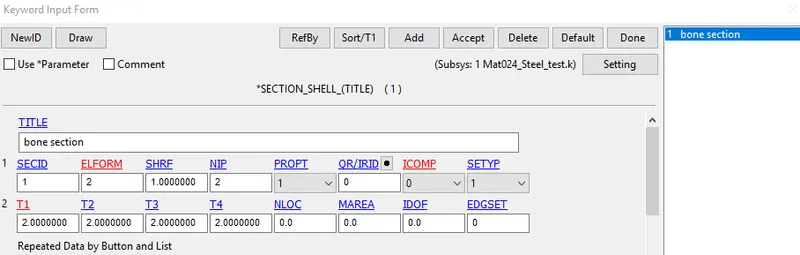
Section Shell is Assigned to the Dogbone Specimen with ELFORM=2, and Thickness is Assigned as 2mm.
Material:-
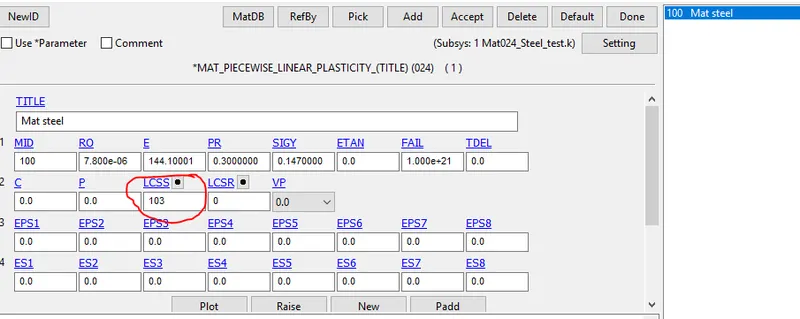
The material card is defined as the behavior of Plastic material MAT_024_Peicewise_linear_Plasticity is Assigned with Material Properties of Steel
The Elastic region is defined by the following Properties
Density=7.800e-06 kg/mm^3
Young's modulus=144.10
Poissons Ratio=0.3
SIGY=0.147 (Where the Plastic region Starts)
For the Plastic Region, the Material Curve is Defined In LCSS
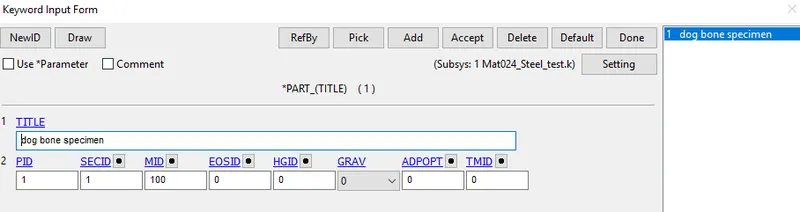
Assign the Section and Material To the Part
Boundary Conditions:-
Tensile testing, also known as tension testing is a fundamental material Science and engineering test in which a sample is subjected to a controlled tension until failure.
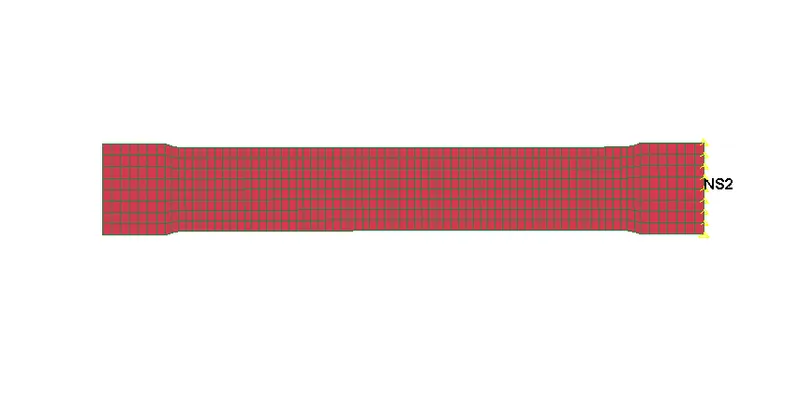
For the Process One end of the Specimen is Fixed and the Displacement is Given at another end
A set Of SPC nodes are Created at one end and Constrained at all Dof's
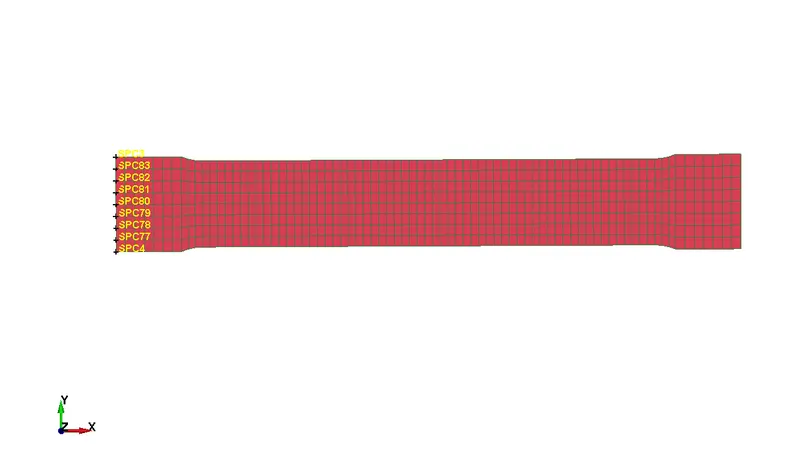
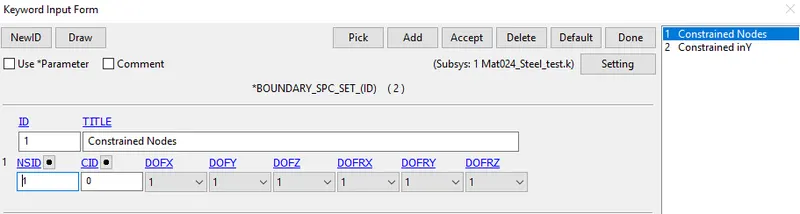
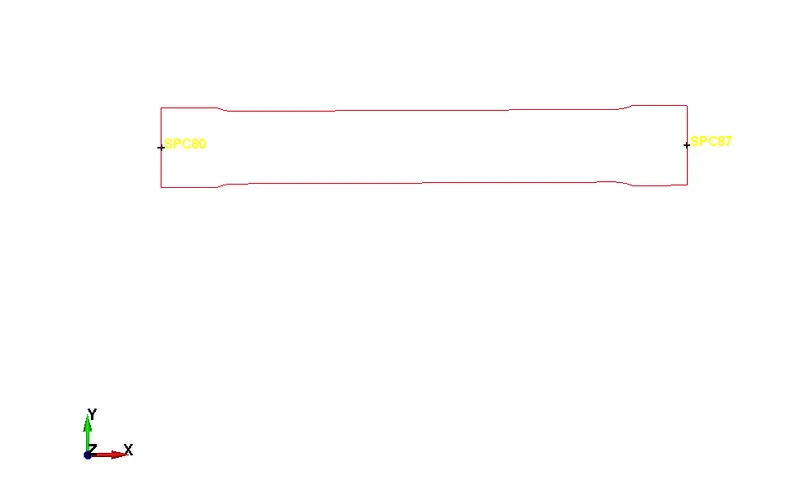
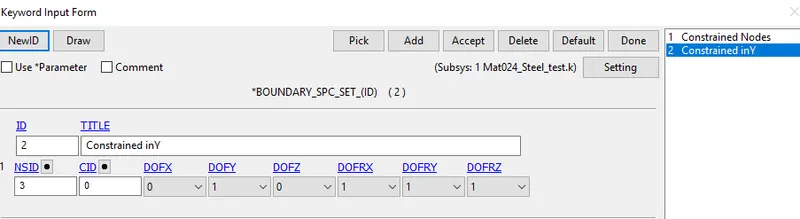
A Node in the Middle is selected from Both sides and Constrained In Y so that it cant Move From centre
Displacement:-
A set of nodes are selected from the Free end By using create entity > Set Node
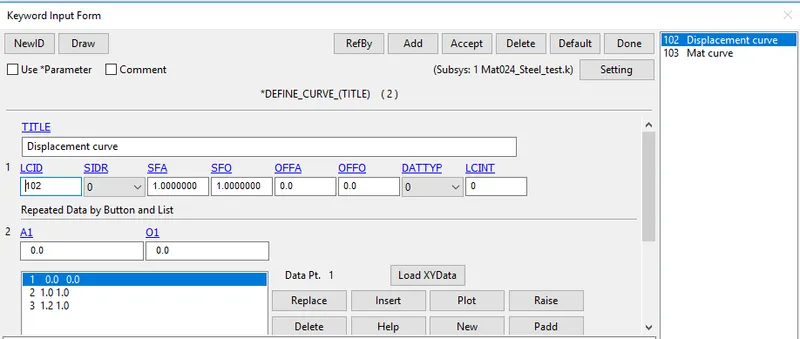
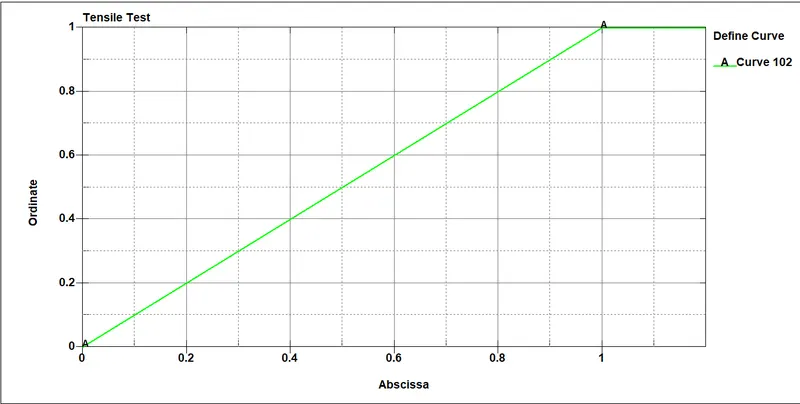
The Displacement Curve is defined Using Define > curve
Boundary Prescribed Motion Set:-
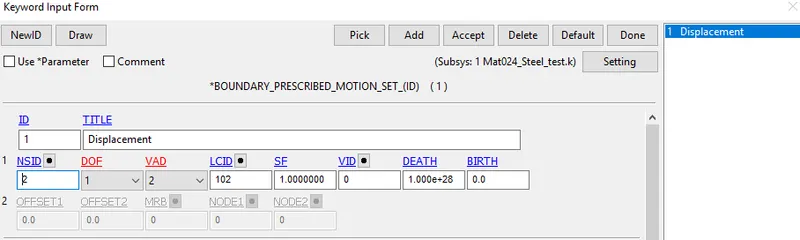
The Displacement Curve is Assigned To the Node set By Boundary Prescribed Motion Set
Choose VAD=2 It refers to Displacement
To Record, the Strain In order to Plot Effective Plastic Strain vs Effective Stress Database Extent Binary Plot is Created to record the Strain tensor Values While STRFLG is set to 1
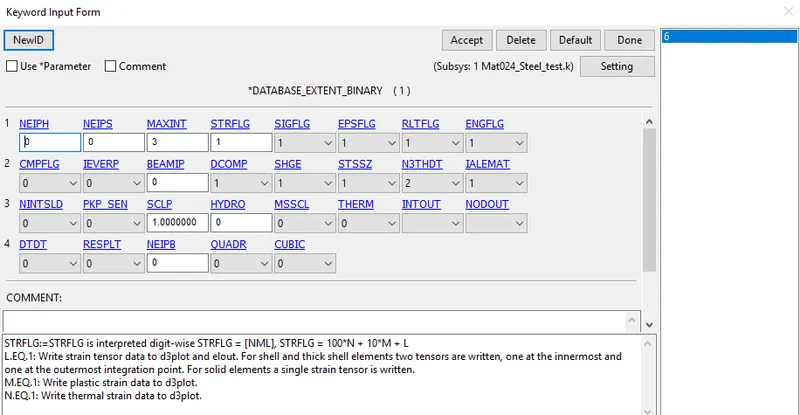
For running The Static Structural Analysis Implicit Solver is Best, So Implicit is preferred here for Simulation
As the LS-Dyna is explicit software in General, Some Control cards must be defined For switching to Implicit
1.Control_implicit_Auto:-
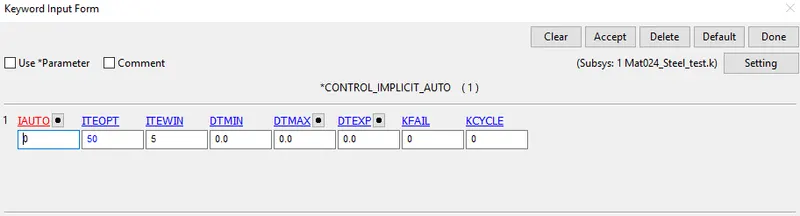
CONTROL_IMPLICIT_AUTO card is used for automatic time step control during implicit analysis. Input value for Automatic time step control flag = IAUTO = 1.
2.Control_Implicit_General:-
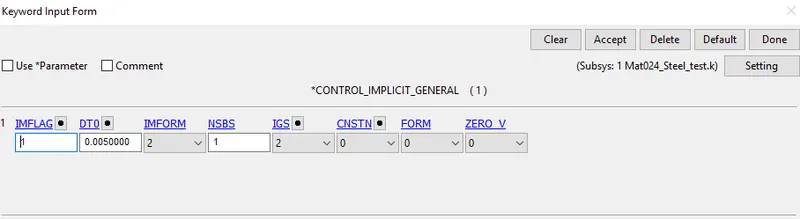
CONTROL_IMPLICIT_GENERAL card is used to activate implicit analysis and define associated control parameters. This keyword is required for all implicit analyses.
The input value for IMFLAG=Implicit/Explicit switching flag = 1 (implicit analysis)
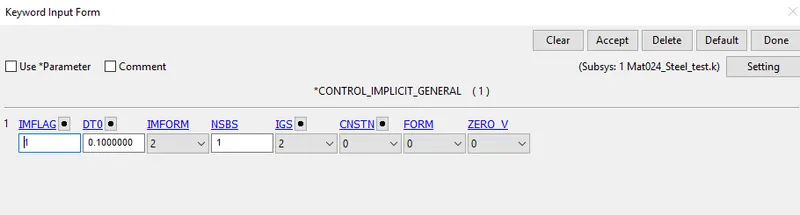
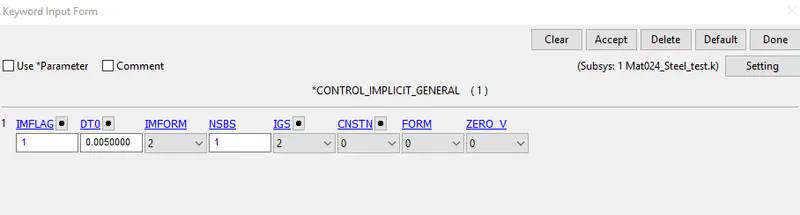
DT0=Initial time step size for implicit analysis = 0.005
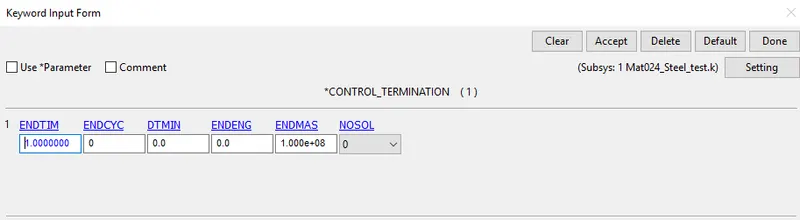
Control Termination:-
Control Termination Card is used to define the End Time of the Simulation
Output Requests:-
1. To view the results of Simulations Following Steps are Specified.
2.The time interval between the outputs is 0.1 is defined in D3plot
3. Go to Keyword Manager > Database > ASCII select GLSTAT, ELEOUT with DT 0.1
Run the Simulation:-
1. Save The Keyword And Run the Simulation in LS Run
2.Open The D3Plot to Plot the Results.
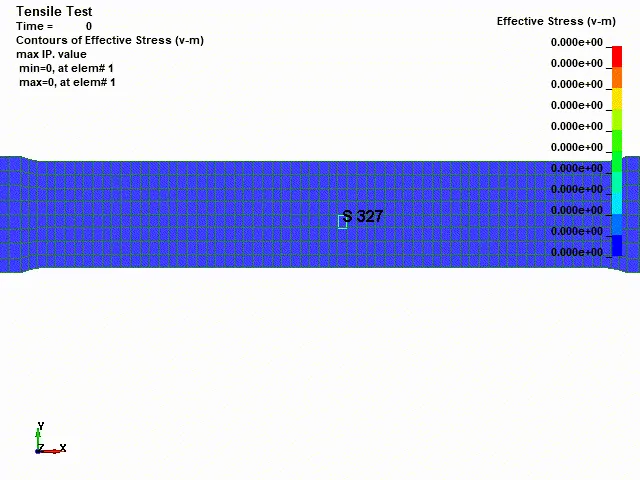
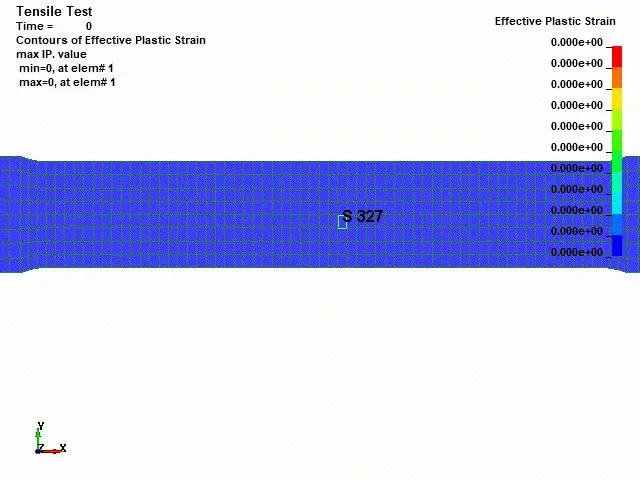
From the result data, it is observed that the max effective stress-induced is 0.2753 Gpa and the effective plastic strain is 0.007140.
Effective Plastic Strain vs Effective Stress Is plotted for an element
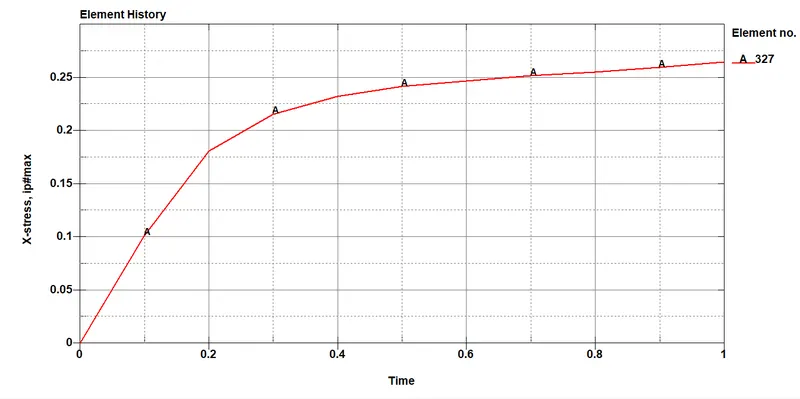
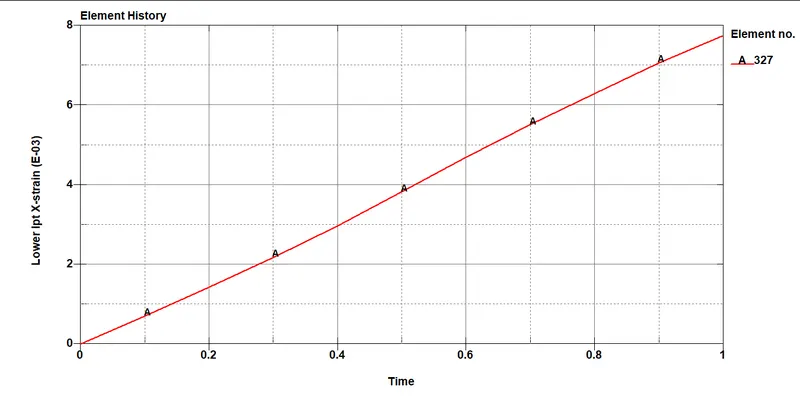
Stress vs Strain:-
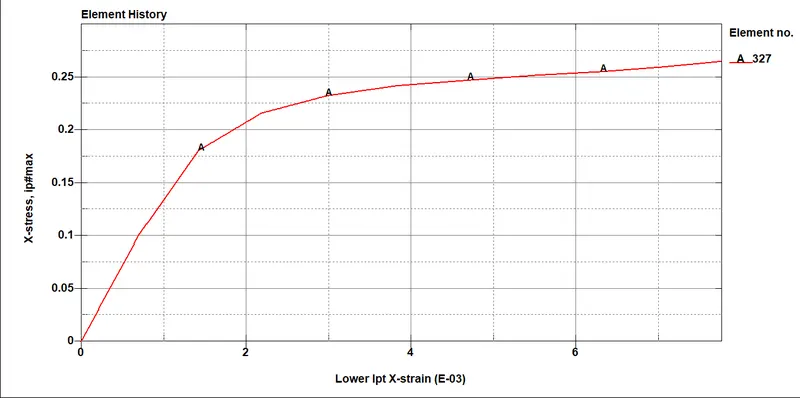
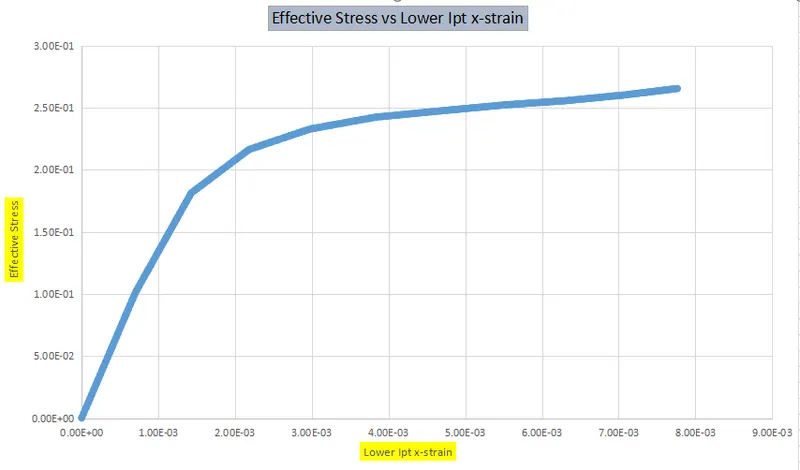
1. The following data is stored and export in the excel sheet for validation.
2. the Lower Ipt x-strain data is considered as true strain.
Comparison of Simulated Values with RAw data Values:-
RESULTS:-
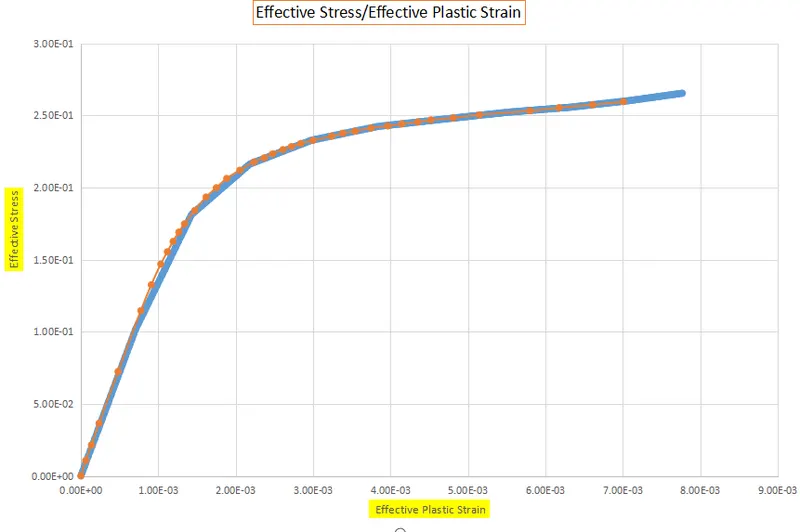
1. The True stress and strain values obtained from the Graphite Iron casting is found to be Similar to the Simulated value
2.The Curve Changes in accordance with the Stability of the Model; for eg The Model Is simulated with initial time Step DT=0.1 in Control Implicit General, and DT=0.005, the results obtained are;
DT=0.1 DT=0.05
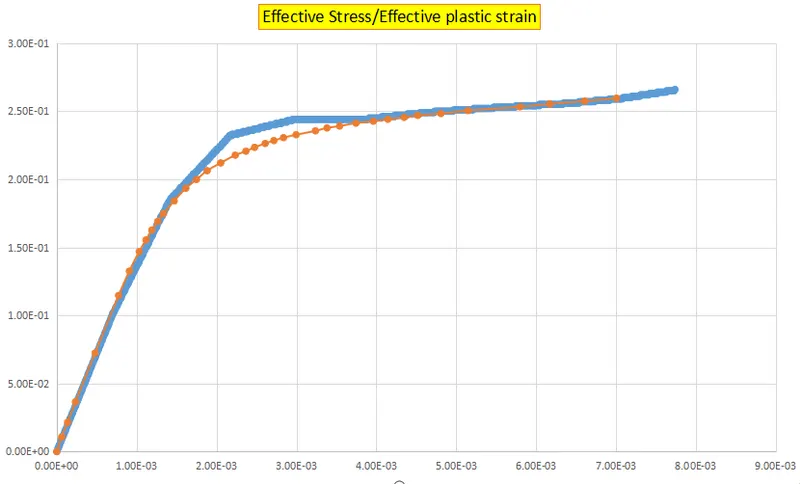
3.From the Graph we can say that decreasing the Timestep will Cause an Increase in the Stability of the solution as it takes more steps to solve so the Accuracy of the curve in capturing the Points will be more accurate
4.In case the Curve is too Noisy even after the Simulation and more accuracy is requires Curve fitting is done and it compares the Fit with the Simulated curve and shows the result.
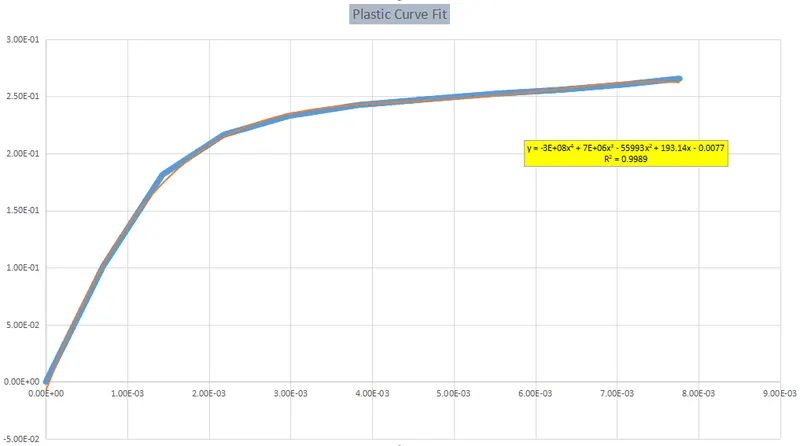
5. From the Graph, we can see that `R^2=0.99`which is the Curve fitted by the Polynomial Equation is 99%in match with the original curve, and using the equation the Values of X and y can be obtained and the new value is Plotted as Graph.
6.As a result the Simulated curve From Ls-Dyna fits Comparatively with the Raw data which validates the material Model well Satisfied.