Week - 9 Material modeling from raw data
Objective :
To extract the data from the given stress-strain curve and model a material using the Ls-Dyna material cards and to perform the tensile analysis inorder to check the our material card is correct or not.
Procedure :
Step 1: First we need to extract the data from the given stress-strain curve which is in the .jpeg format. To get the data we are using the Graph data digitizer software.
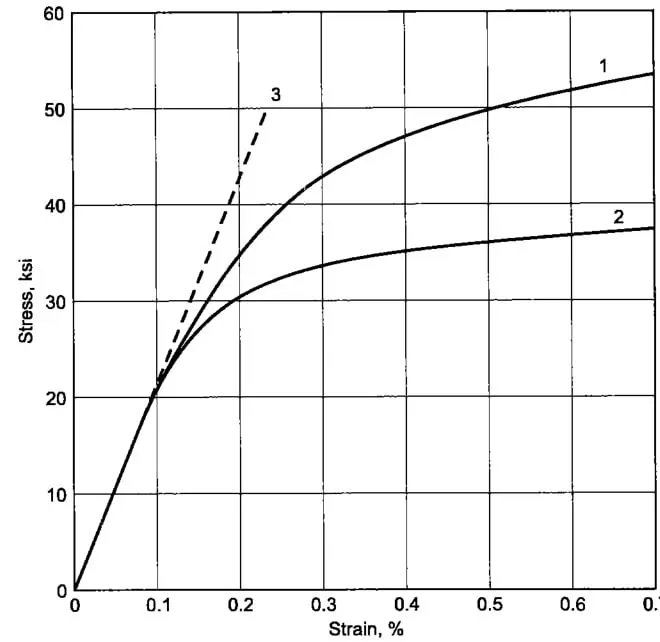
Step 2: Open the image in the Graph data digitizer and give the x-min,x-max and y-min,y-max values and select the points which is in the stress-strain curve, like this we can get the data and save the data in the ms excel file by copying.
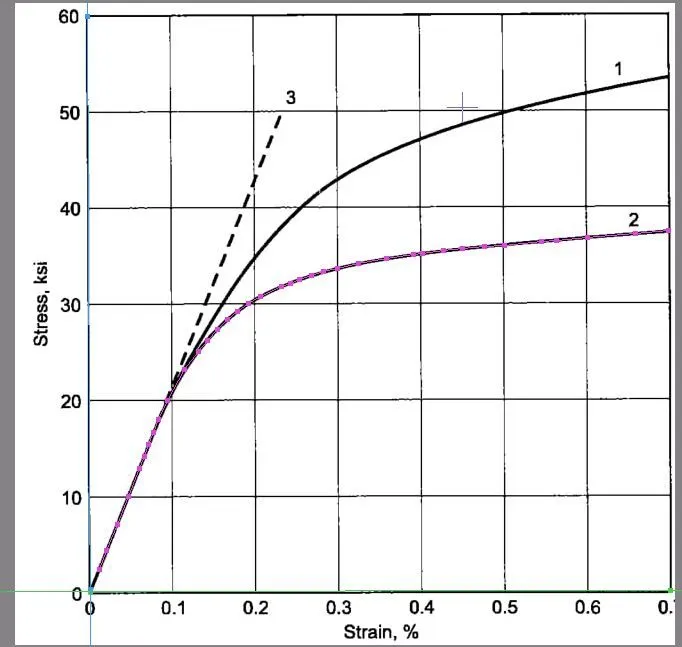
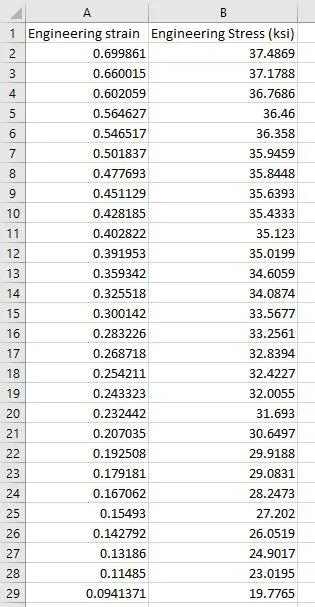
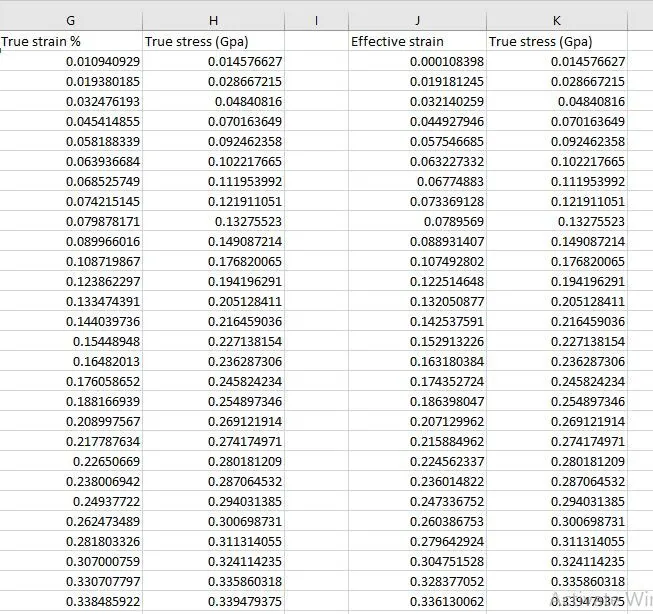
Step 3: Now we have the stress and strain data but the data of stress in the ksi and we need the True stress, True strain and Effective strain data. To get them we use below formulaes.
True strain = Ln(1+Engineering strain)
True stress = Engineering stress * (1+Engineering strain) { 1ksi = 0.00689GPa }
Effective strain = True strain - (True stress/Young's modulus)
We have the given value of Young's modulus E = 20.9E+06 psi but this has to be converted in kg-mm-ms i.e, is in gpa by converting E = 144.1GPa
Step 4: Now we have to convert the data into Effevtive strain and True stress using above formulaes using the excel sheets.
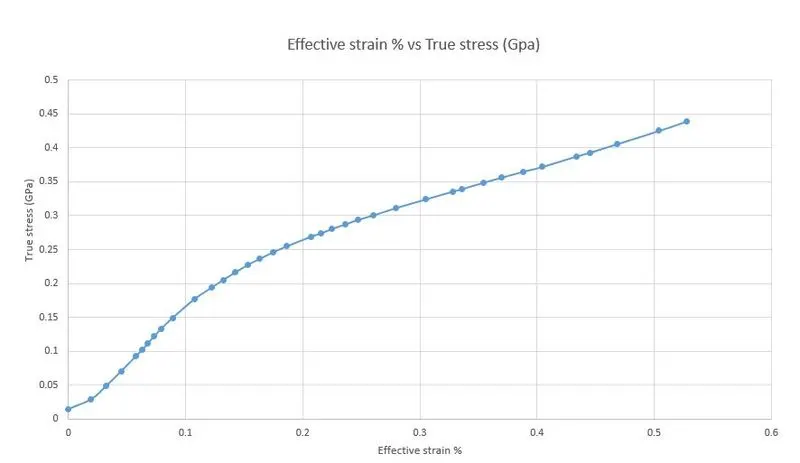
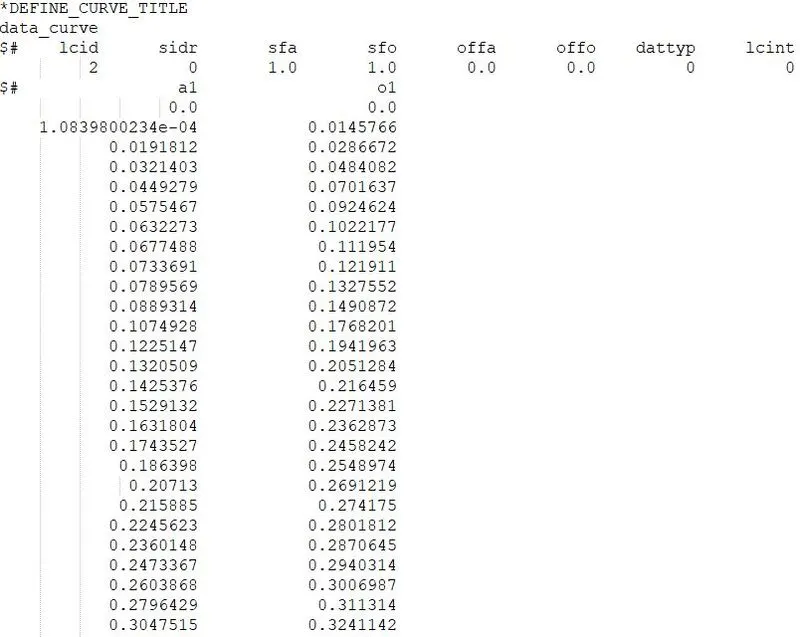
Step 5: Now we have the data to create a material card, go to the ls dyna and open the dopbone specimen file and open the define curve and accept it and save the file. Now open notepad++ and open the saved file in it and add the data of effective strain and true stress under the define curve and save the file.
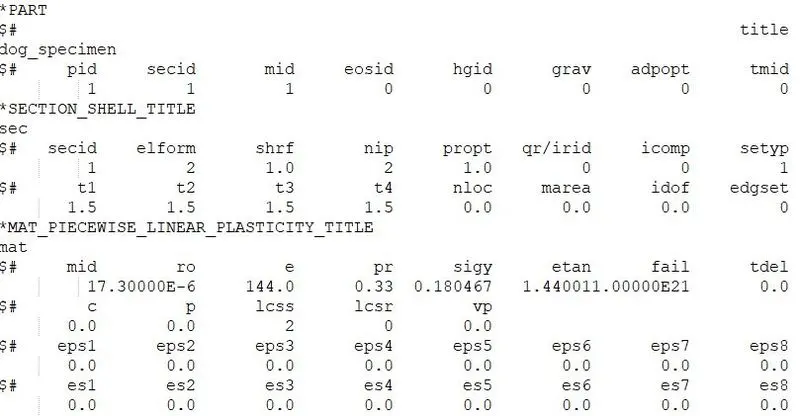
Step 6: Now we have the material data in ls dyna file but we need to create the material card (mat-24) and section card. After creating the add card id into the part card.\
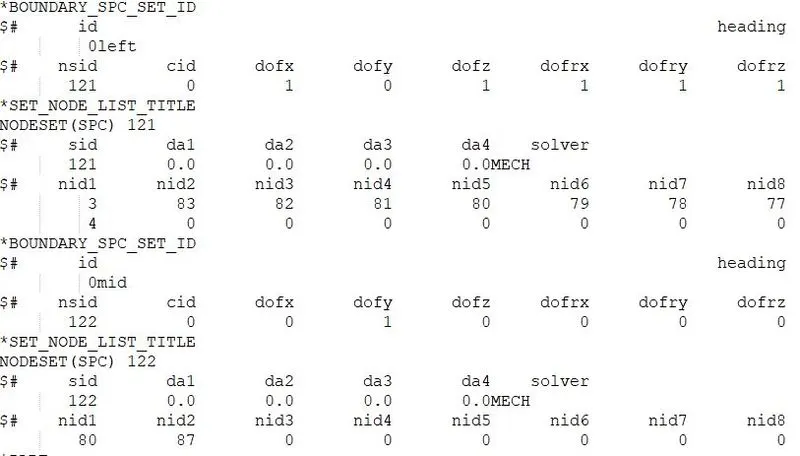
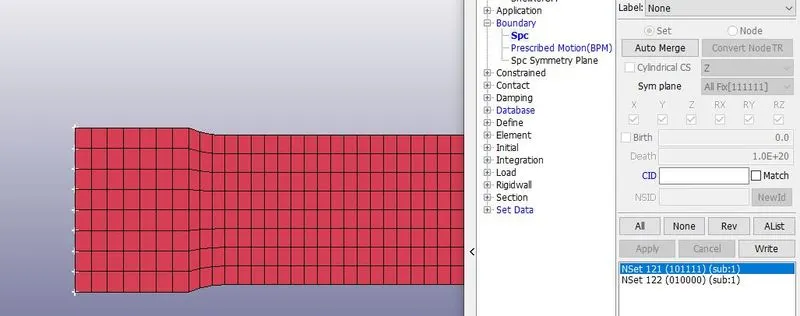
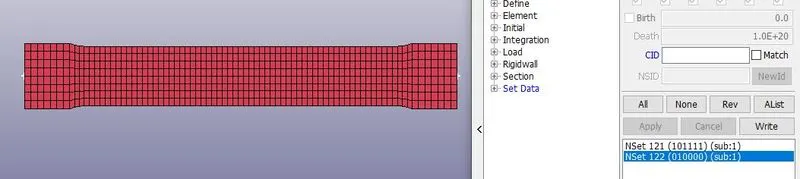
Step 7: After that we need to create a spc boundary card to the model whhich constraints the model. First we need to constraint all dof except trans Y in the left side of the model and after that we need to create mid trans y on the both sides. The reason we did not constrained on the y direction is because we are performing the tensile test on the y-direction.
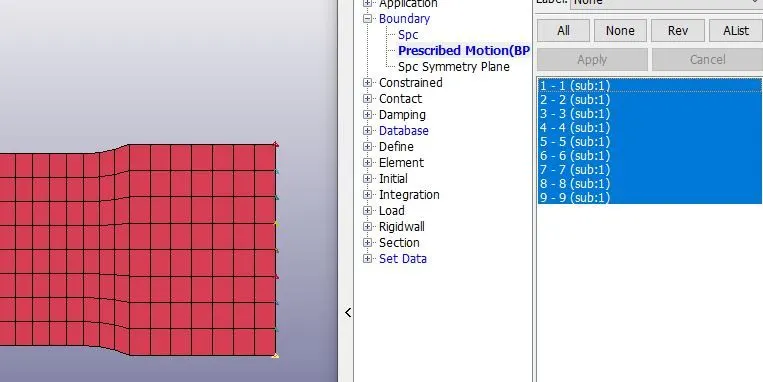
Step 8: Now we have to create a motion for the model on the y-direction, so select the right side nodes and create motion using the prescribed motion card.
Step 9: We have created every card for analysis except the database and control cards. These cards are used to extract the data of analysis and for the termination of the solver. Here we are using the Implicit cards for the analysis.
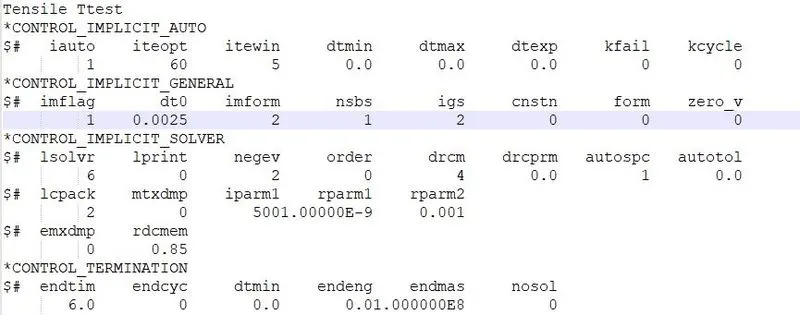
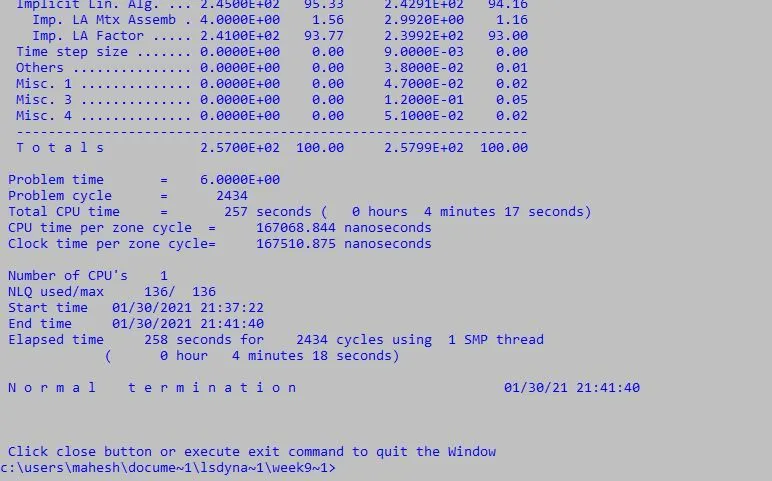
Step 10: Now save the file in the .k format and open it in the ls manager and run the file and it shows normal termination.
Results and Discussion :
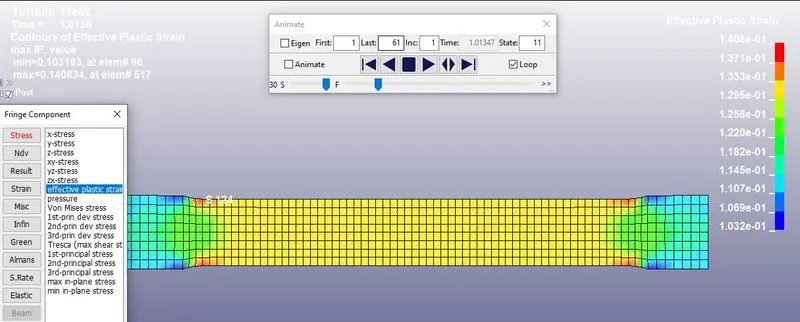
1. Open the d3plot file in the ls dyna file and run the simulation of the X stress and effective strain.
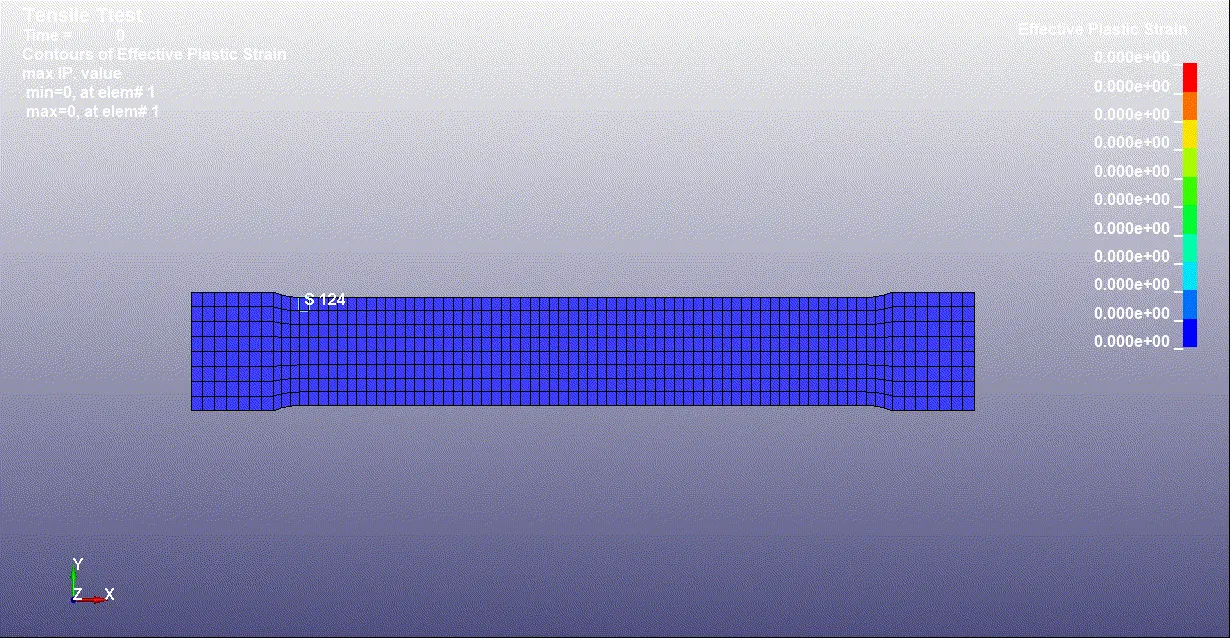
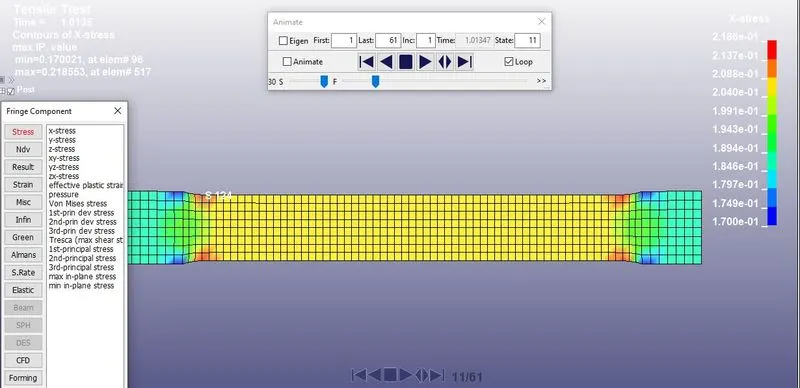
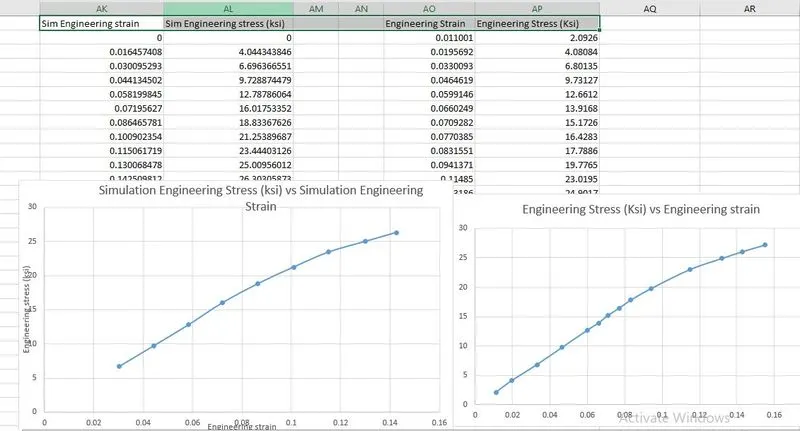
2. Now we need to extract the data from the plot x stress and effective plastic strain. To extract the data from the plot open the hist option and select the x stress and select the element and plot the graph. Now we have the plot, these plot has to be saved as .xml format so we will find the engineering stress and strain.
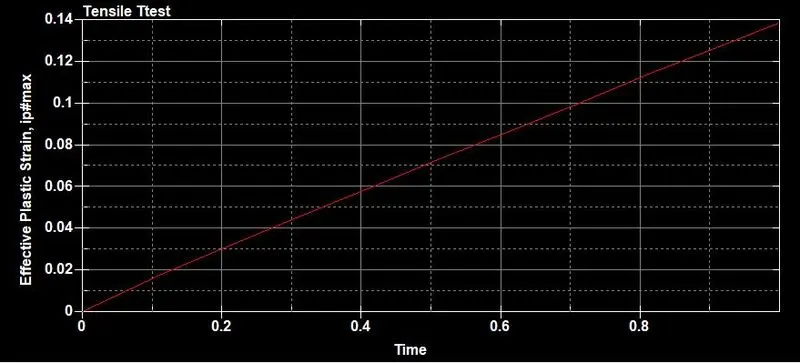
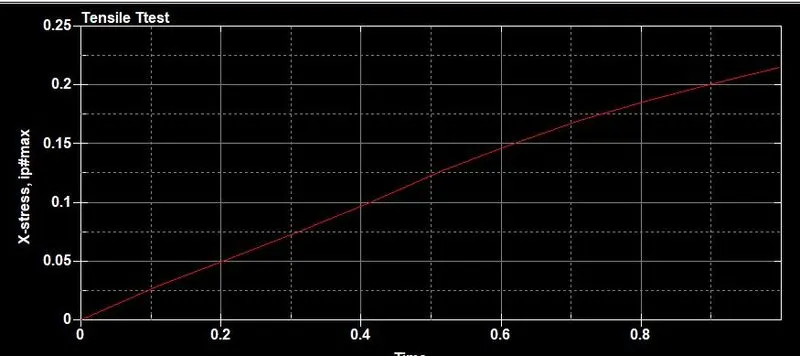
3. Now open the plot data in excel sheet and convert the data into Engineering stress and strain using the above formulae.
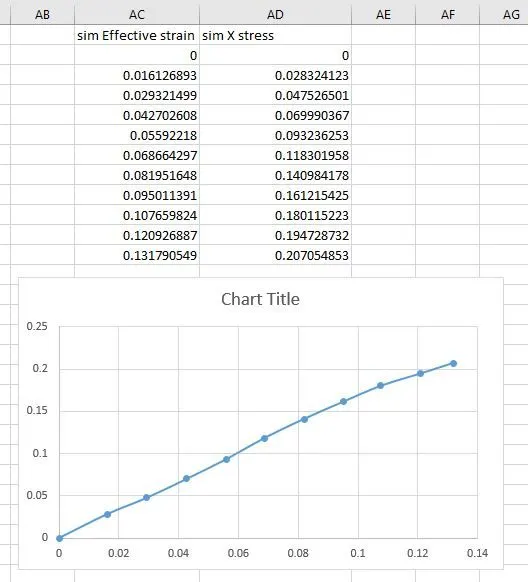
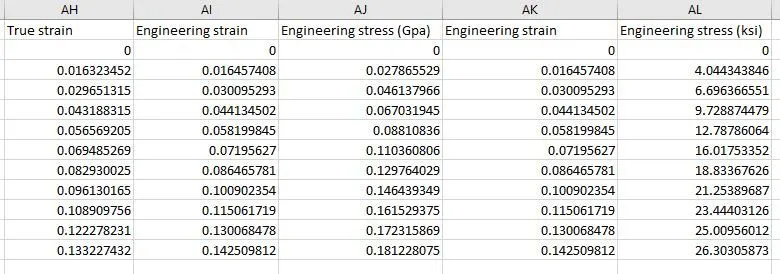
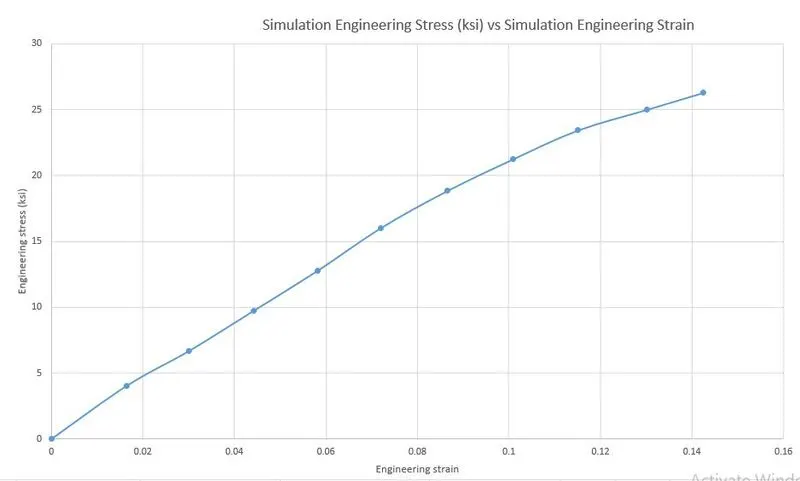
4. Now we have the data which is converted in engineering stress and strain but the data is im kg-mm-ms it has to be converted in ksi using the excel sheets.
Conclusion :
Thus we have created a material card using the stress-strain curve and performed a tensile test using that material card and extracted the data from tensile test to prove that we taken correct material card using Ls-dyna software.