Week - 9 Material Modeling from Raw Data
AIM
Material modelling of MAT 024 by the help of digitilizer app for extracting the data from graph.
OBJECTIVE
- Extracting data from graph
- Material curve
- Cleaning data of graph
- Create material card
- Simulate the dog bone with material
PROCEDURE
- Extract the data from graph
For this DIGITILIZER APP is used where individual points are extracted.
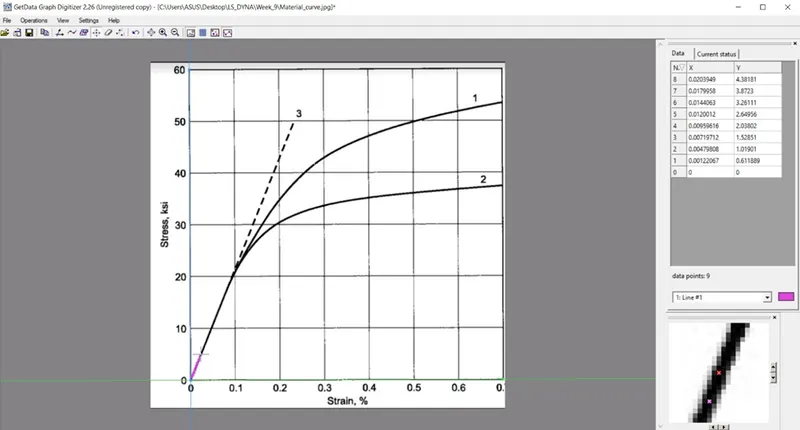
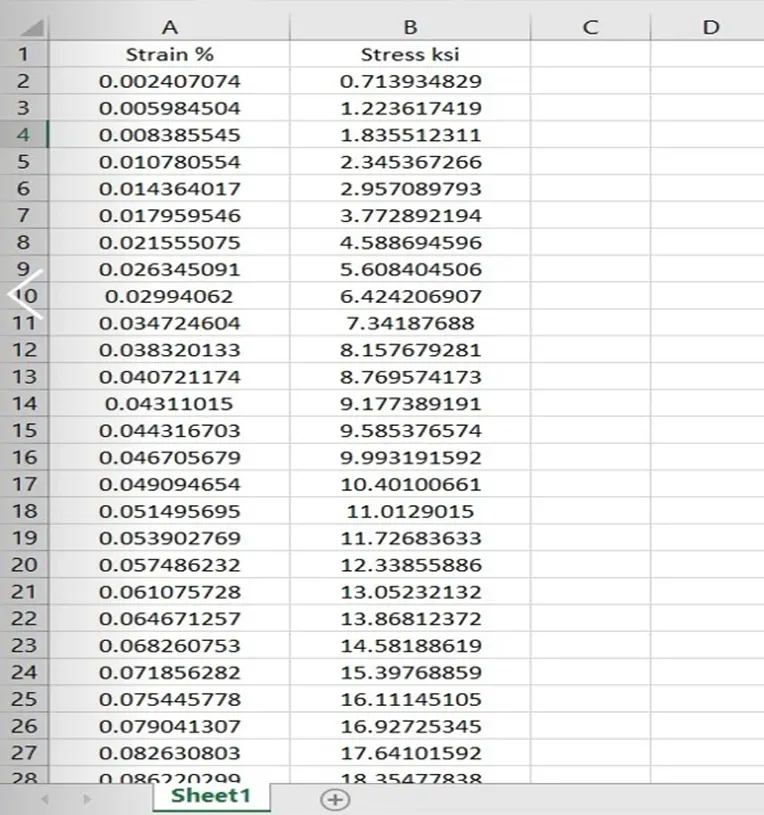
Open data extracted in Excel sheet.
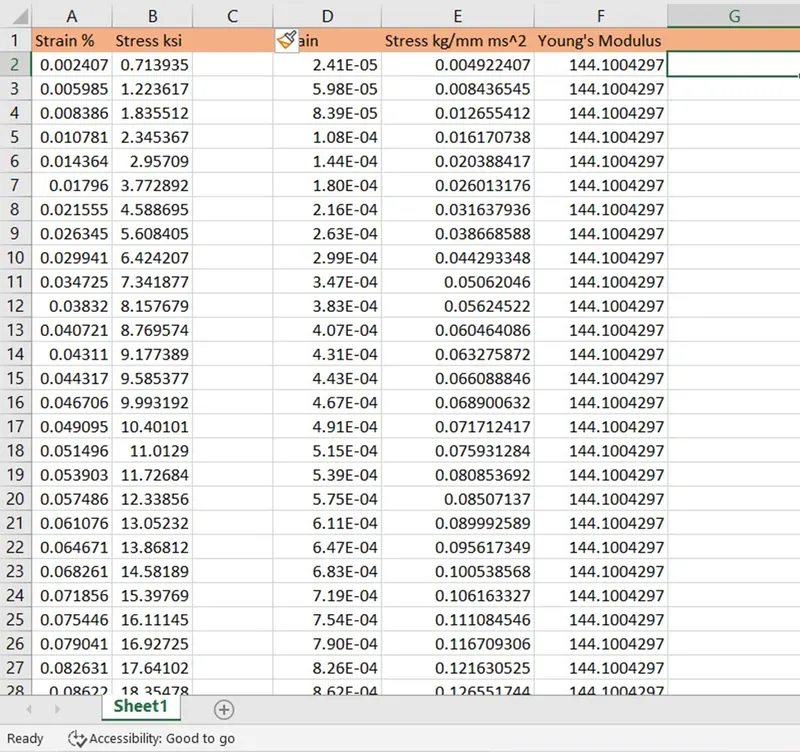
- Conversion of data into suitable unit system
Conversion of Stress units into Kg mm ms and strain ratio into strain.Young’s Modulus unit is also converted into kg mm ms
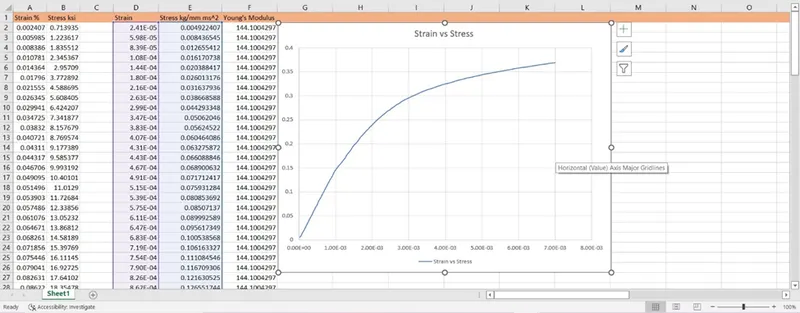
- Refining/cleaning data for modeling
First graph is plotted stress vs strain and it is found there are impurities.
For cleaning the graph strain value is written in the Form of Arithmetic Progression for 50 number of terms.
Zeroth term is 0
Last of 50th is 0.007008024 which is last value of extracted strain value
Common difference is found by formula =(Last term – First term)/(No of terms -1) = 0.00014
First term = Zeroth term + Common difference
Second Term = First term + Common difference
.
.
.
Fifty term = Forty nine term + common difference
Hence the strain value is formed.
Now for Stress value The equation is used which is generated by stress vs strain graph.
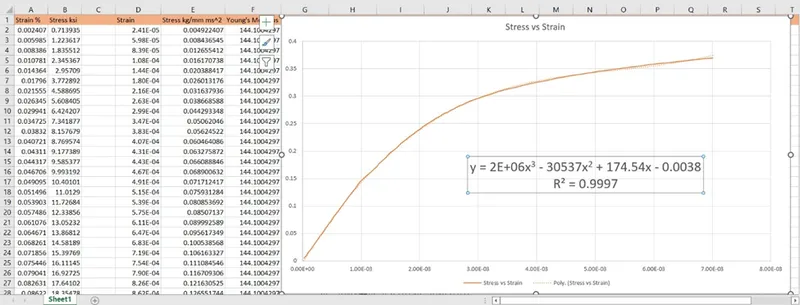
In this equation y is Stress and x is strain.
After generating stress value again graph is formed and checked.
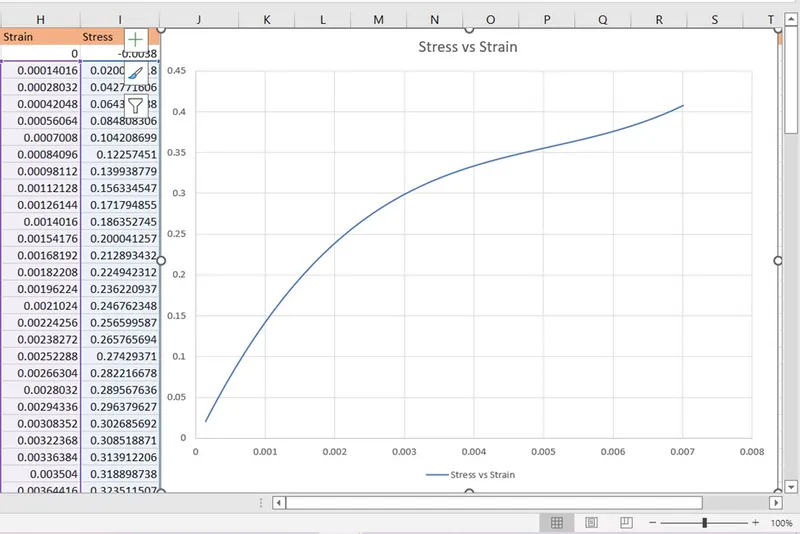
Now Effective plastic strain is computed.
Effective Plastic Strain = Total Strain – (True stress/Young’s Modulus)
Now again Stress vs Effective plastic strain is plotted.
- Material curve creation
In this value of Effective plastic strain value and stress is inserted.
MODEL > KEYWORD >DEFINE > CURVE
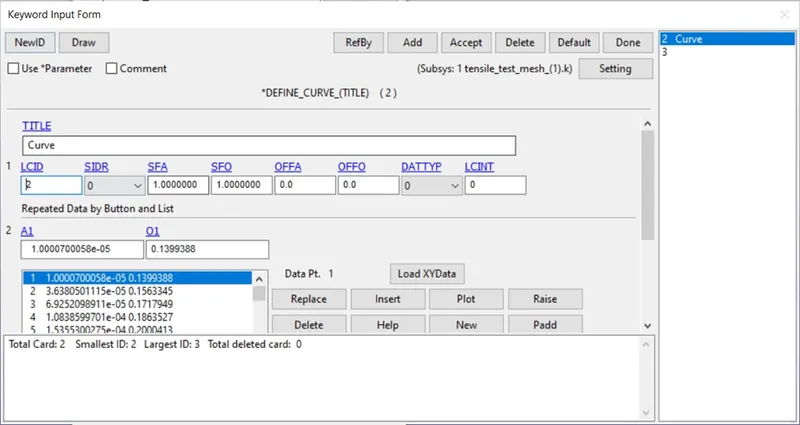
- Material card creation
MODEL > KEYWORD > MAT > 024 PLASTIC LINEAR PLASTICITY
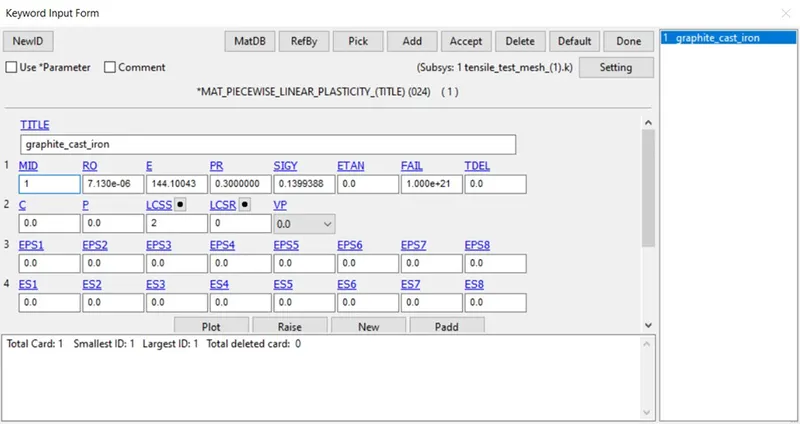
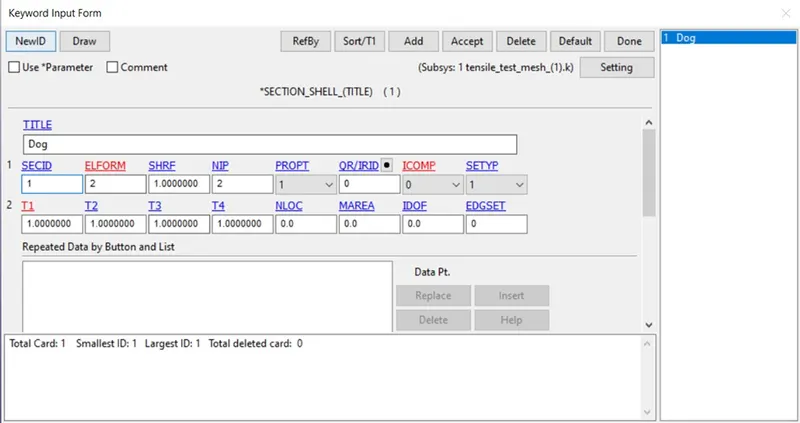
- Shell creation
MODEL > KEYWORD > SECTION > SHELL
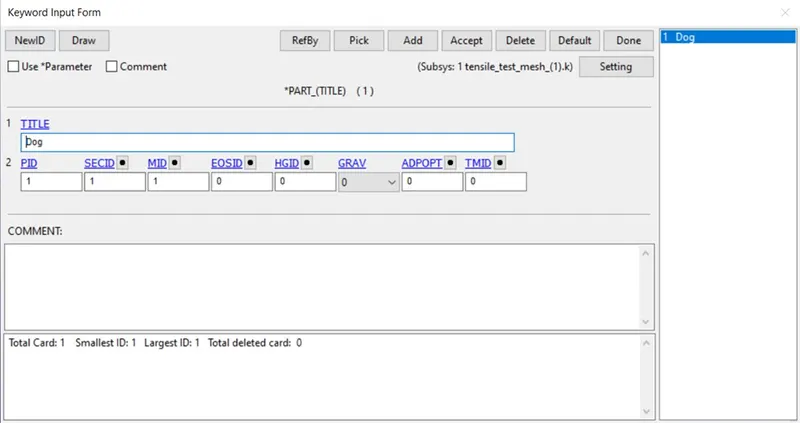
- Parts formation
MODEL > KEYWORD > PARTS
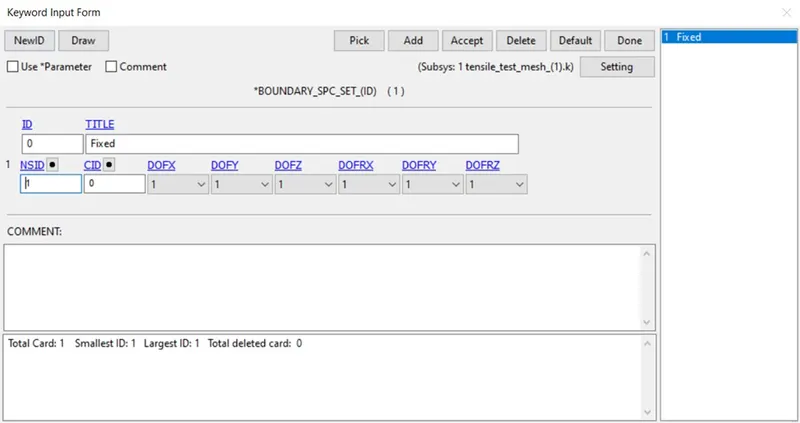
- Boundary Condition
SPC set is formed.
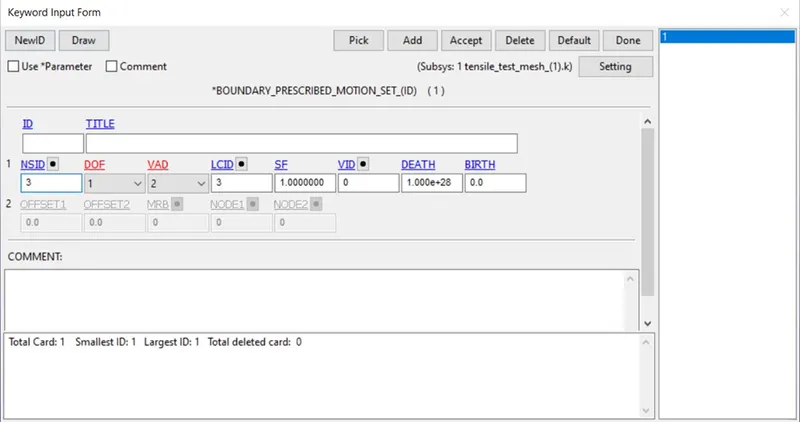
Prescribed motion set
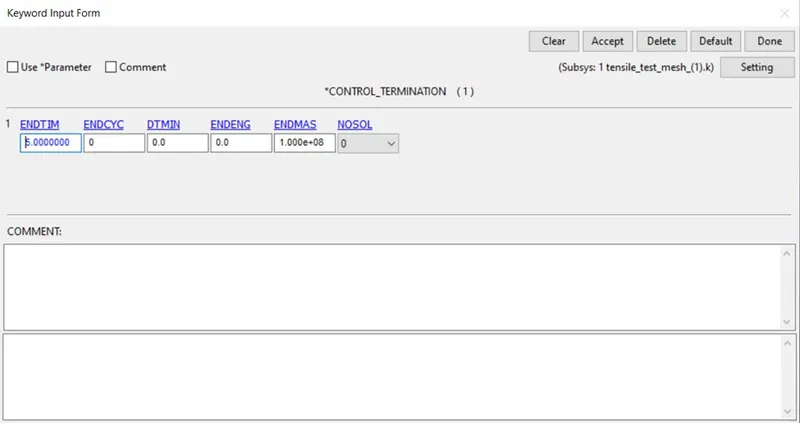
- Termination
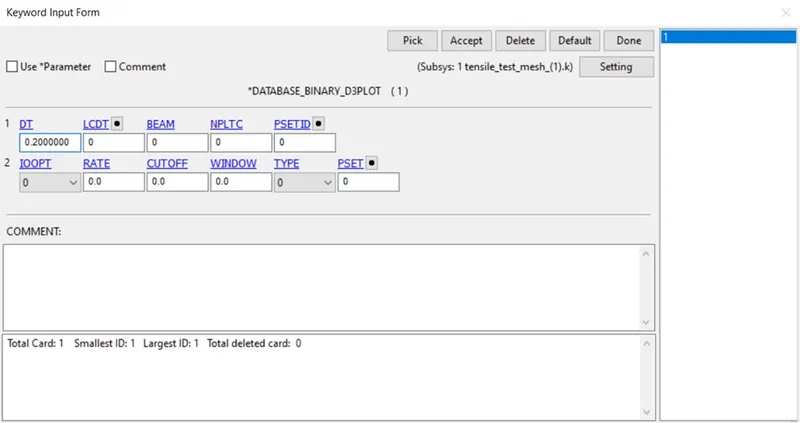
- Output
Binary D3 plot
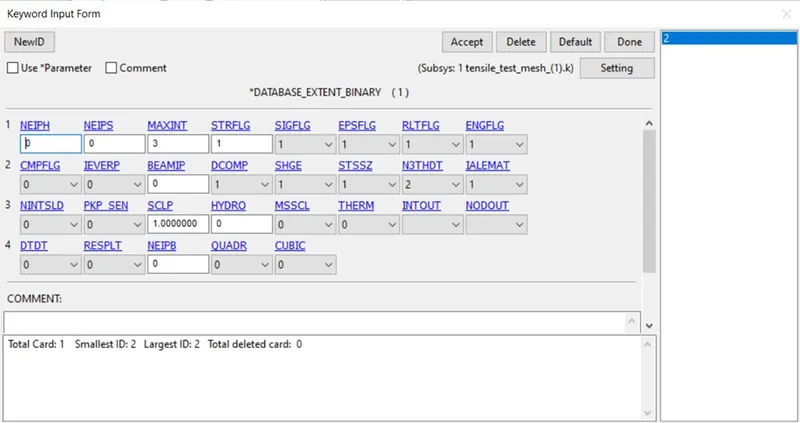
Extended binary
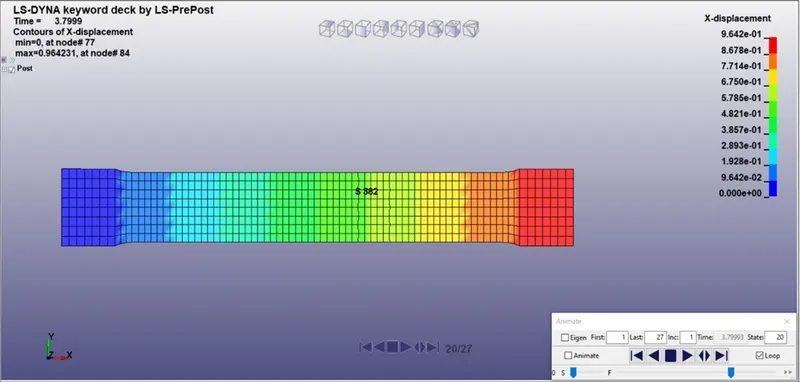
RESULTS
- Simulation
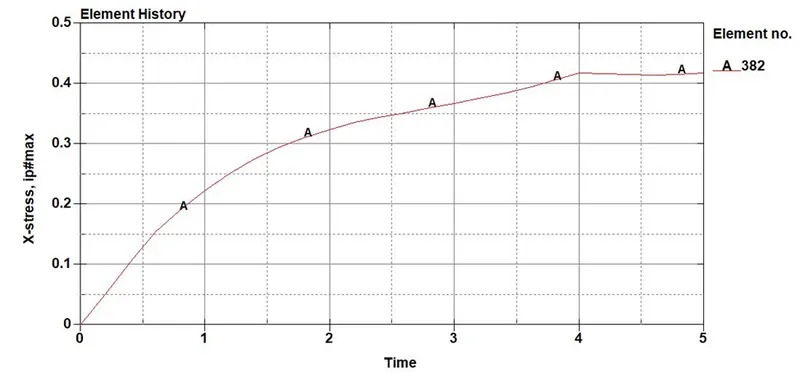
- Stress graph
POST > HISTORY > STRESS
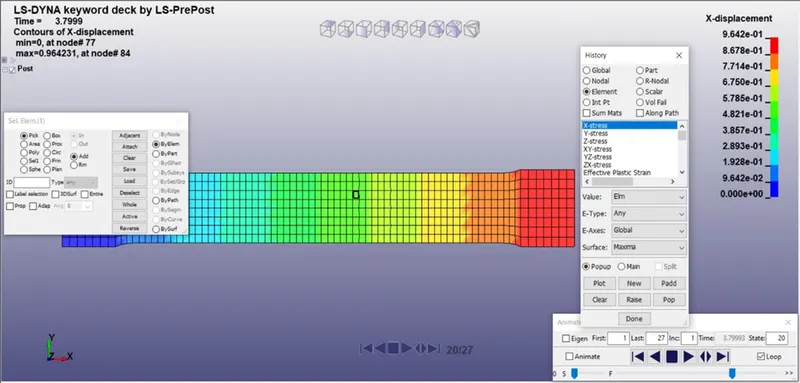
After plotting graph minimize the graph
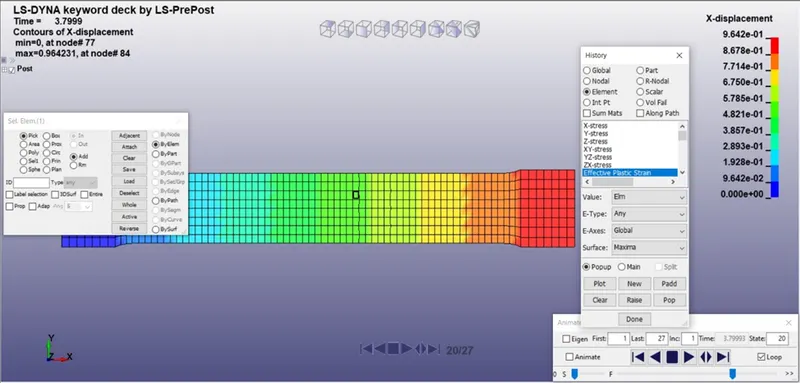
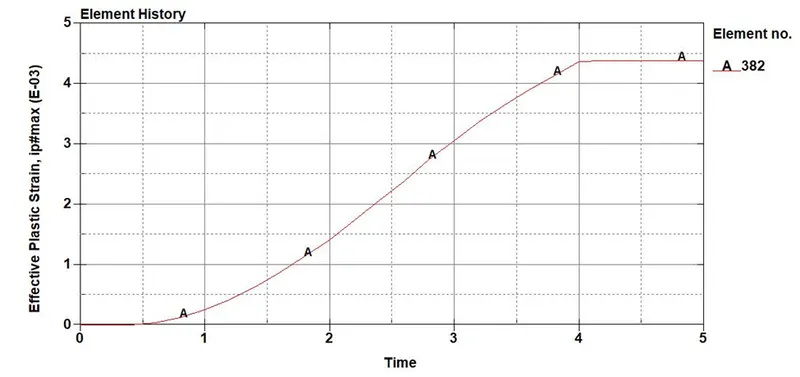
- Effective Plastic Strain graph
POST > HISTORY > EFFECTIVE PLASTIC STRAIN
- Graph intercross
POST > HISTORY > XY PLOT
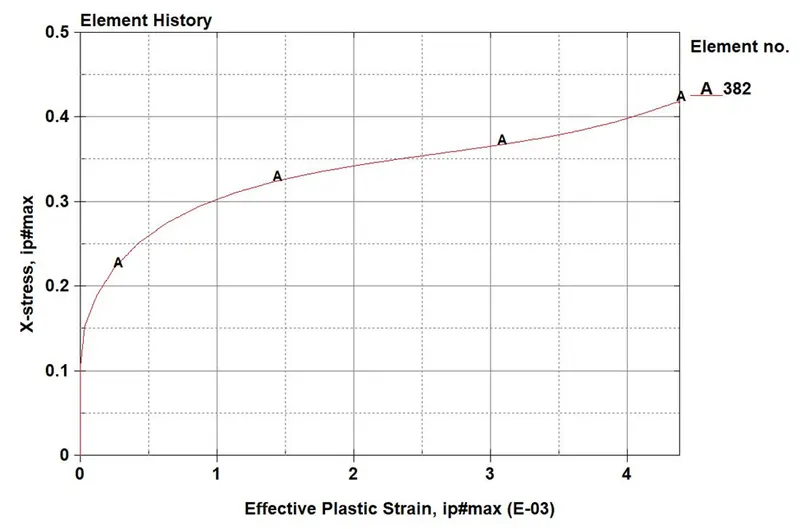
CONCLUSION
It is evident from simulation that the material is modelled successfuly however by comparing the result plot to the original plot it is found that there is difference in both graph.