Week - 9 Material Modeling from Raw Data
AIM: To Extract the stress-strain data points from the image and input them into LS-Dyna and compare the results of simulation with that obtained from the raw data.
PROCEDURE:
- Firstly we will extract the data from the curve 1 of the image given with the help of data digitizer tool.
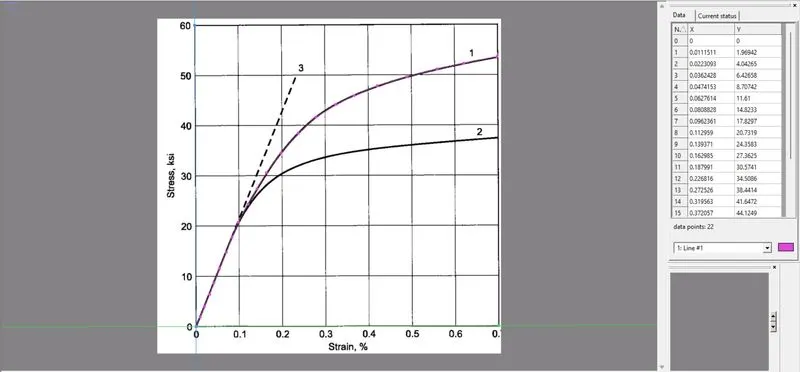
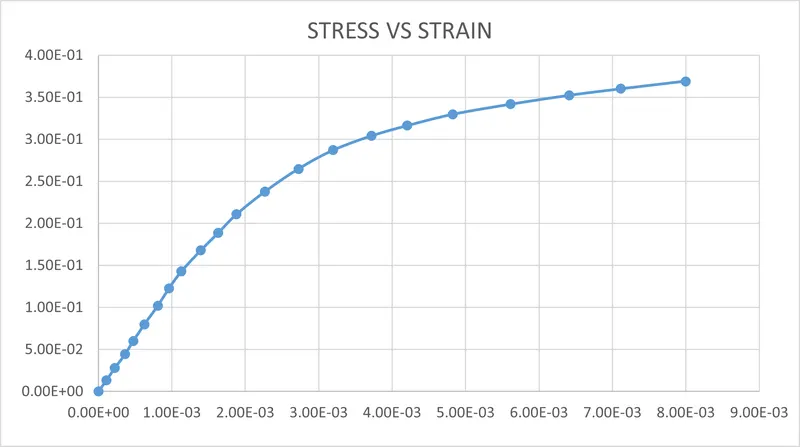
- Now these traced data points which represents the true stree-strain values are exported to an excel sheet and the values of true stress and stain are plotted below on graph.
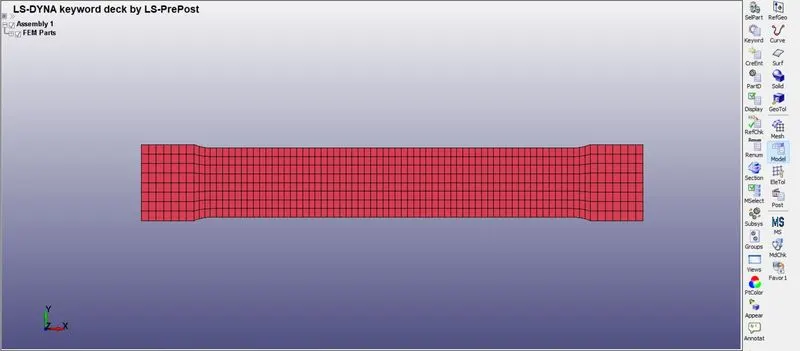
- We will now setup the model in LS-Dyna workspace.
- Firstly importing the dogbone model and assigning the boundary conditions to it.
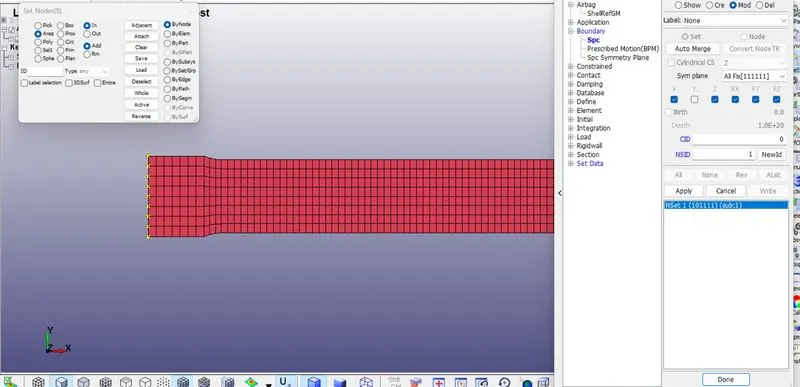
- We will be giving boundary condition to the dogbone. At first we will be selecting left edge of the specimen and constrained in the X and Z Directions. They are not constrained in Y-Direction, since the specimen undergo lateral elongation during the test.
- Then we will be selecting center nodes on the either sides of the edges and constrained in Y-Direction.
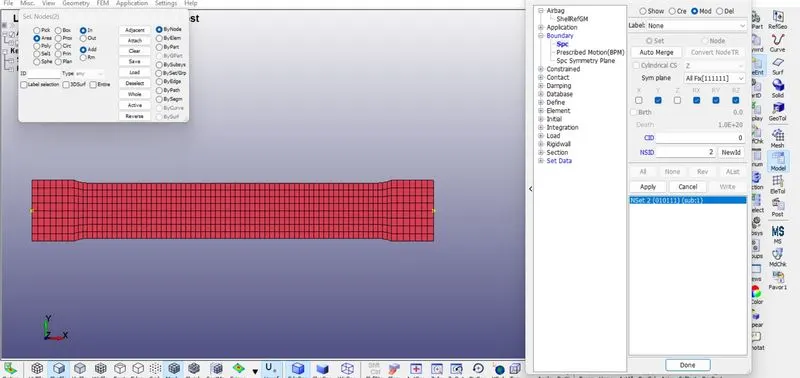
- After this we will assigning the displacement at right edge of the specimen as shown.
- The value of displacement will be derived using following method -
- As per the curve the maximum strain value is 0.008.
True Strain=Displacement/Initial Dimension
Therefore, Displacement=True Strain*Initial Dimension (0.008*145=1.16)
- Hence, the displacement taken as 1.1mm. Which is inserted via load curve.
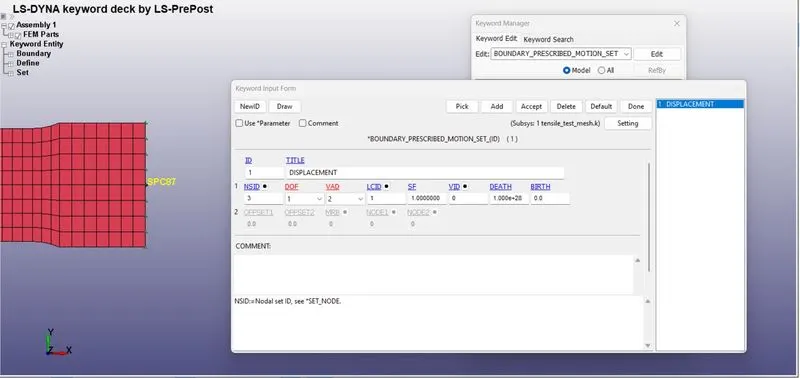
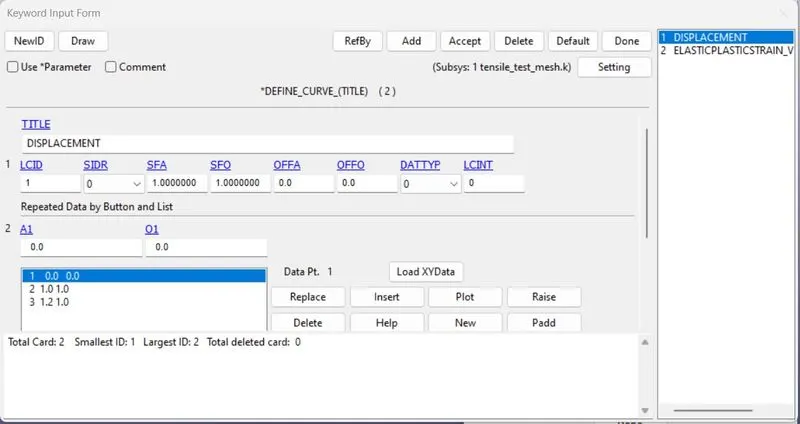
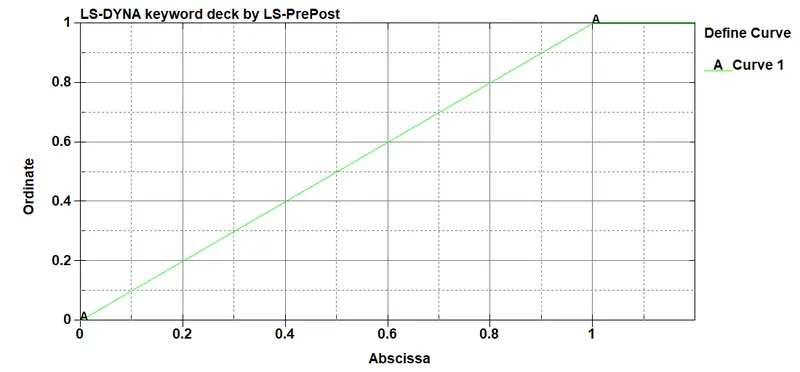
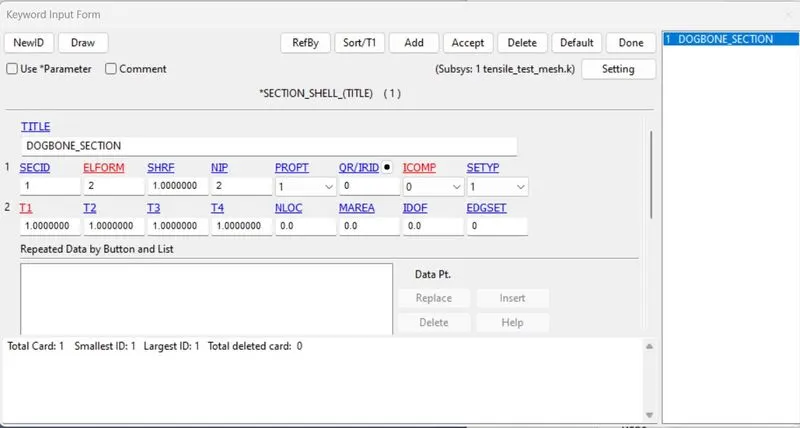
- Now we will define section and defined with shell element and thickness as 1 mm and ELFORM as 2.
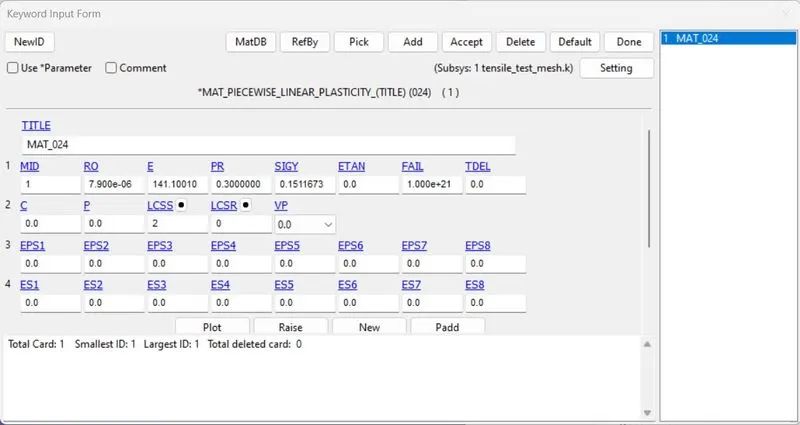
- Material card will de defined now we will select MAT_024_PIECEWISE_LINEAR_PLASTICITY as per given unit system KG-MM-MS. The Youngs modulus (E) is given as 20.9E+06 PSi which we will convert it into 144.1001 GPa. The value of density (RO) and Poission's Ration (PR) are given accordingly.
- As given the material curve image we will take out the data with the help graph digitizer and insert it into the .k file.
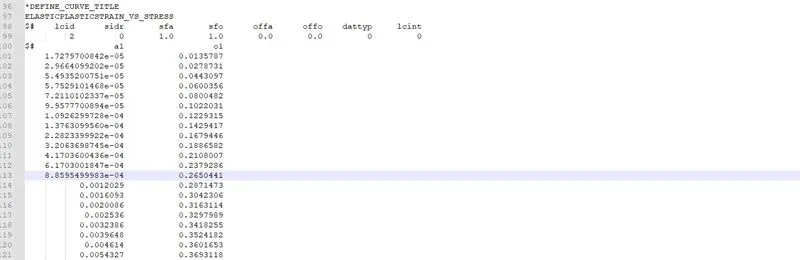
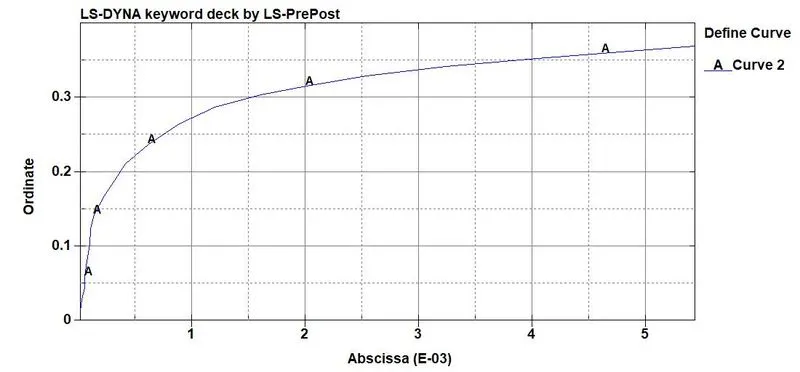
- After this we will be defining the part where we will assigning the material id and section id.
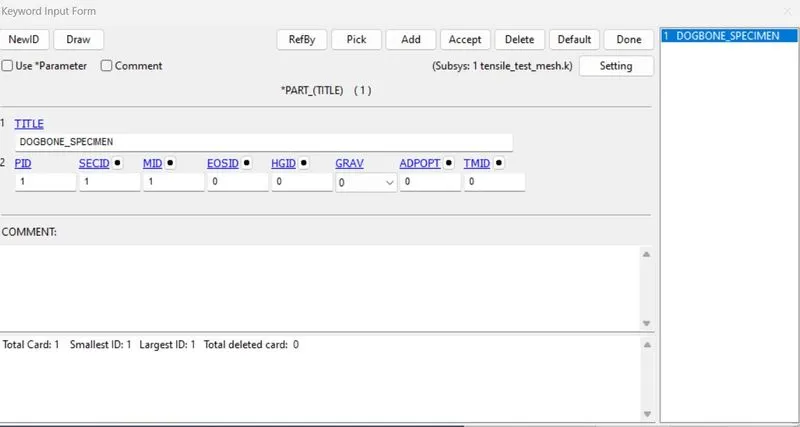
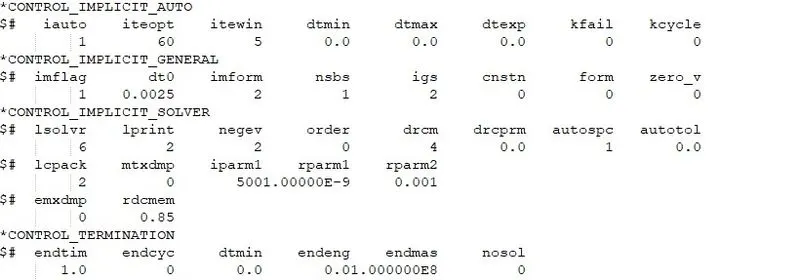
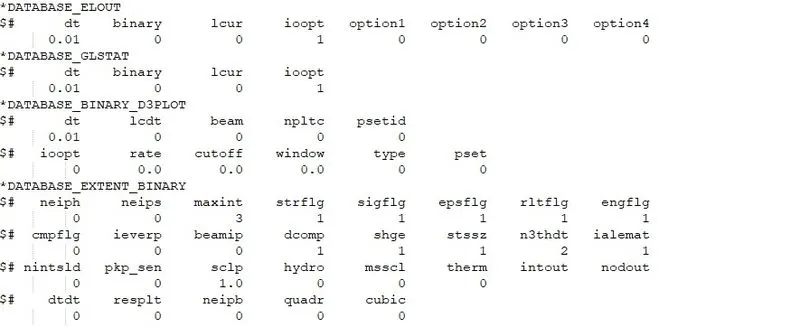
- The database and control cards are defined as shown below.
- The timestep for BINARY_D3PLOT and DATABASE_ASCll for GLSTAT and ELOUT are 0.1ms.
- DATABASE_EXTENT_BINARY card with STRFLG=1 is used to compute the elastic strain in the model.
- Since the tensile test of the specimen is quasi-static analysis, it is carried out using an implicit method.The dt 0 value 0.0025 ms.
RESULT:
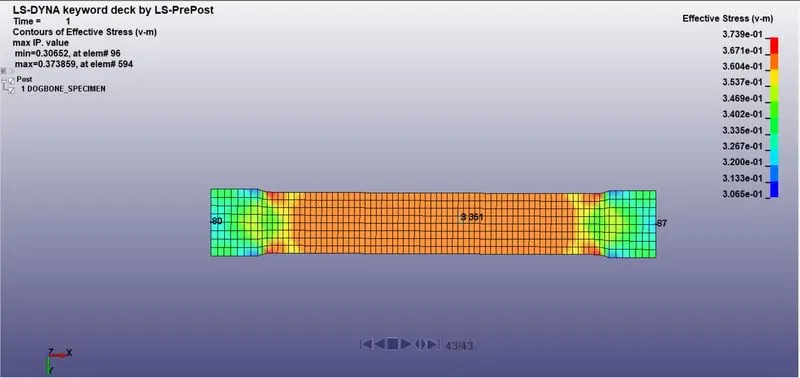
- In VON Mises stress the maximum stress is observed is 0.373859 GPa. Here it inferred that plastic deformation is observed and also necking is not observed which signifies there is strain hardening taking place and the necking value is not achived till the end of simulation. So, the stress value increases within the timestep. The maximum stress is obtained in the middle region of the specimen.
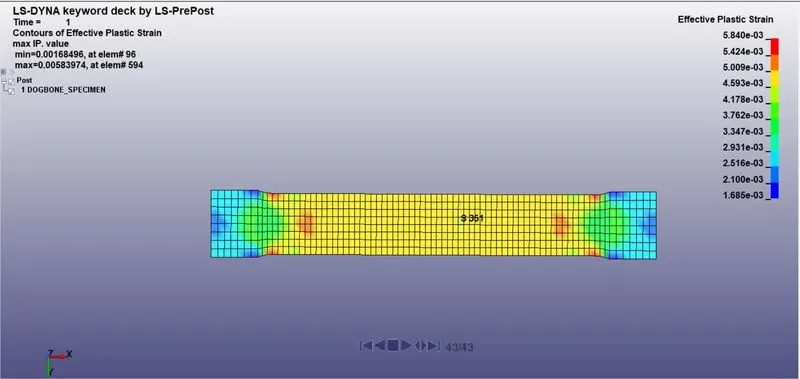
- As per the defined displacement, the maximum value of effective plastic strain obtained is 0.00583974. The strain propagation is trying to reducing the cross section region and propagating further towards the center.
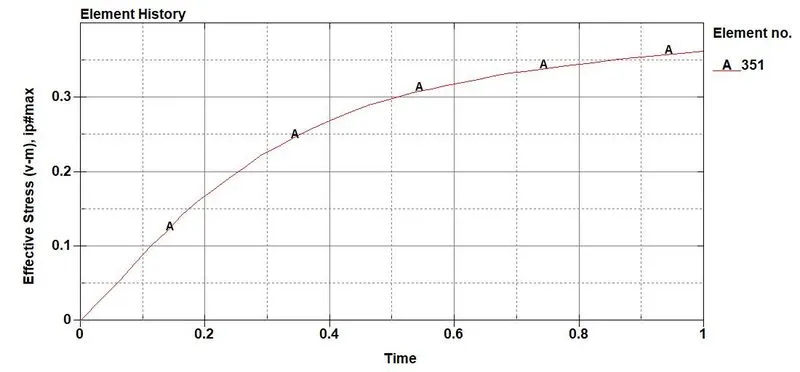
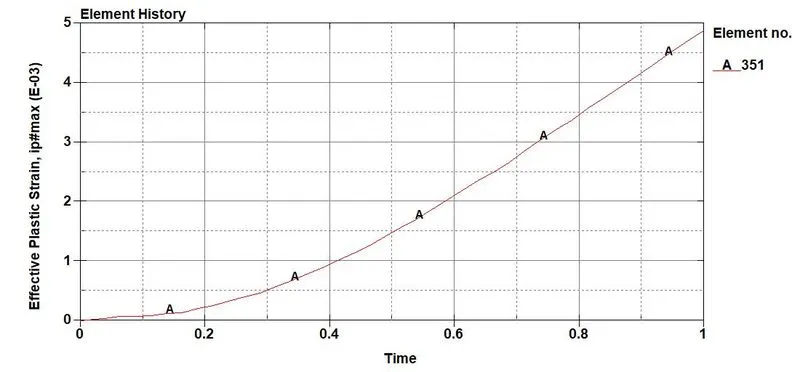
- From the two plots, it can be inferred that the same behavior is obtained as given by the contour. The element number 351 is in middle portion of the specimen.
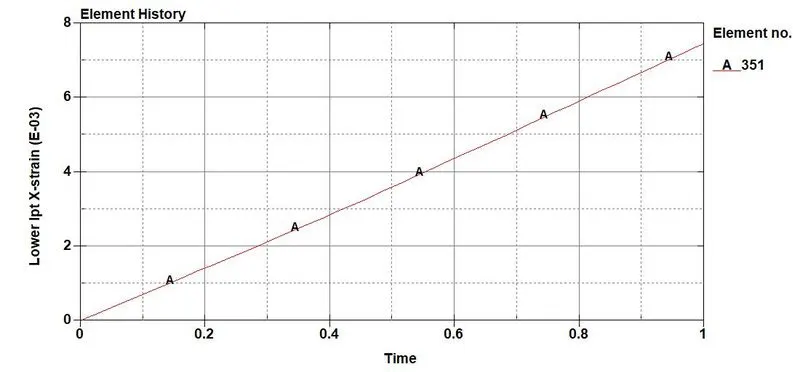
- To validate the stress-strain data, we have to plot stress-strain using the data obtained above. This can be done in LS-DYNA using cross option.
- The Lower lpt X-Strain is chosen because the strain is maximum along x-axis since the displacement is applied along the x-axis.
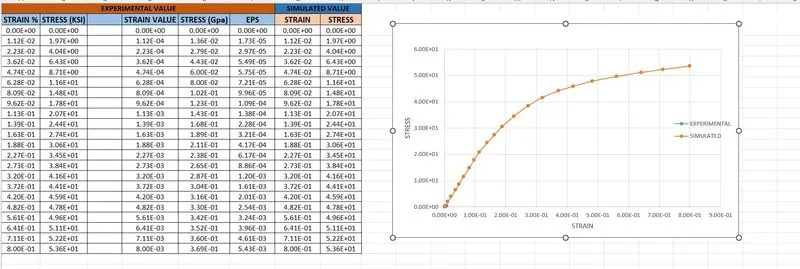
- The experimental values and simulated values are compared in the ms excel sheet as shown. The simulated values are saved in ms excel formate in LS-DYNA Prepost.
- The results are validated by comparing the values in experimental data. Th curve we have obtained exactly fits the experimental data. Thus the given values are validated using MAT_024 material card.
CONCLUSION:
The given DOGBONE Specimen is gone through tensile test and simulated values of true stress and strain are validated with the experimental data.
(Excel sheet calculation attached with this challange.)