Week - 9 Material Modeling from Raw Data
AIM:
Using the given true stress-strain curve of graphite iron casting and creating MAT_024 material model and then validating it.
The given curve:
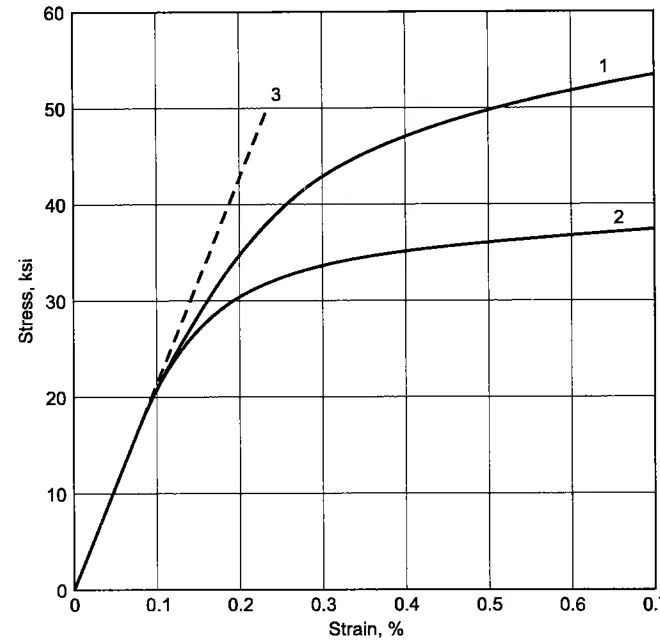
The given true stress strain curve data is digitized for curve 1 and confirming it matches with the given curve.
|
strain % |
stress (ksi) |
| 0 | 0 |
| 0.00988471 | 2.28227 |
| 0.0308506 | 6.74283 |
| 0.0456568 | 9.95863 |
| 0.0567483 | 12.2407 |
| 0.0727614 | 15.4563 |
| 0.0838739 | 17.946 |
| 0.0949342 | 19.9167 |
| 0.108429 | 22.0946 |
| 0.129207 | 24.6867 |
| 0.145074 | 26.4491 |
| 0.16941 | 28.4178 |
| 0.187638 | 29.6608 |
| 0.200997 | 30.4892 |
| 0.22525 | 31.6275 |
| 0.250678 | 32.4542 |
| 0.274878 | 33.0734 |
| 0.301492 | 33.6923 |
| 0.329313 | 34.311 |
| 0.363147 | 34.7212 |
| 0.394568 | 35.1318 |
| 0.427185 | 35.4384 |
| 0.461019 | 35.8486 |
| 0.492419 | 36.0515 |
| 0.502095 | 36.2577 |
| 0.538312 | 36.3562 |
| 0.566091 | 36.5597 |
| 0.596284 | 36.7628 |
| 0.611994 | 36.9681 |
| 0.64098 | 37.1714 |
| 0.662714 | 37.272 |
| 0.701355 | 37.4738 |
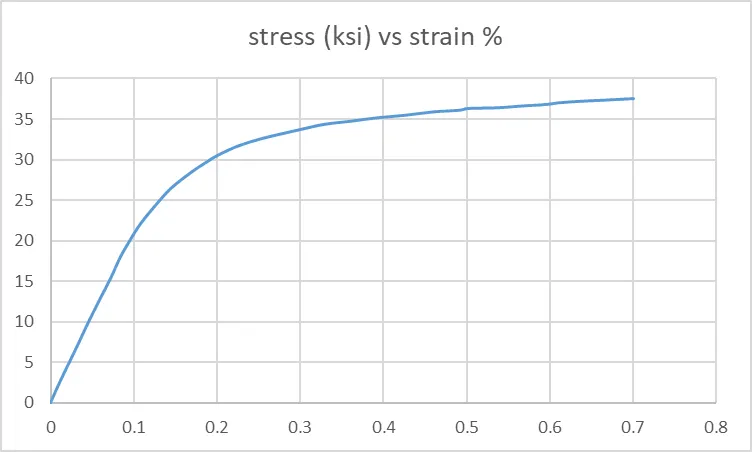
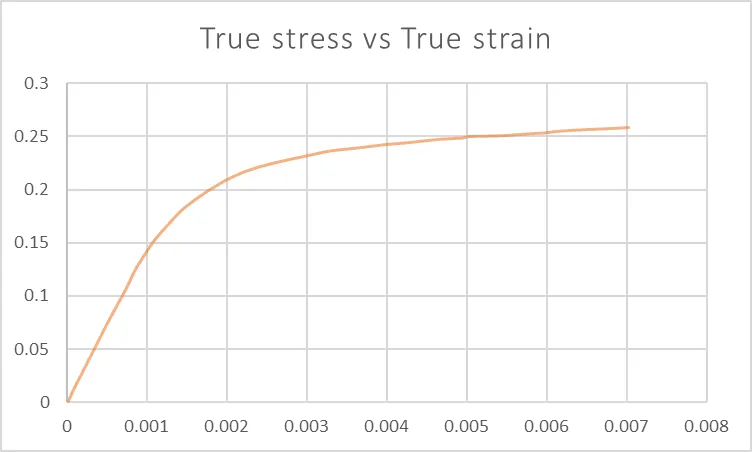
This given stress is in ksi we convert it to kg mm ms by multiplying it by 0.0668947573 and strain % is coverted to strain by dividing it by 100.
| TRUE STRAIN | TRUE STRESS (gpa) |
| 0 | 0 |
| 9.88471E-05 | 0.015735698 |
| 0.000308506 | 0.046490176 |
| 0.000456568 | 0.068662337 |
| 0.000567483 | 0.084396656 |
| 0.000727614 | 0.106567437 |
| 0.000838739 | 0.123733315 |
| 0.000949342 | 0.137320813 |
| 0.00108429 | 0.152336905 |
| 0.00129207 | 0.170208805 |
| 0.00145074 | 0.182360125 |
| 0.0016941 | 0.195933834 |
| 0.00187638 | 0.204504017 |
| 0.00200997 | 0.210215634 |
| 0.0022525 | 0.218063937 |
| 0.00250678 | 0.223763832 |
| 0.00274878 | 0.228033066 |
| 0.00301492 | 0.232300231 |
| 0.00329313 | 0.236566018 |
| 0.00363147 | 0.239394247 |
| 0.00394568 | 0.242225235 |
| 0.00427185 | 0.244339167 |
| 0.00461019 | 0.247167397 |
| 0.00492419 | 0.248566343 |
| 0.00502095 | 0.249988042 |
| 0.00538312 | 0.250667175 |
| 0.00566091 | 0.252070258 |
| 0.00596284 | 0.253470584 |
| 0.00611994 | 0.254886077 |
| 0.0064098 | 0.256287782 |
| 0.00662714 | 0.256981394 |
| 0.00701355 | 0.258372756 |
| EFFECTIVE STRAIN=Total True strain-(True stress/young's modulus) | Effective stress= True stress |
| EFFECTIVE STRAIN | EFFECTIVE STRESS |
| 0 | 0 |
| -1.03527E-05 | 0.015735698 |
| -1.41184E-05 | 0.046490176 |
| -1.99229E-05 | 0.068662337 |
| -1.81982E-05 | 0.084396656 |
| -1.19241E-05 | 0.106567437 |
| -1.99238E-05 | 0.123733315 |
| -3.61298E-06 | 0.137320813 |
| 2.7129E-05 | 0.152336905 |
| 0.000110885 | 0.170208805 |
| 0.000185229 | 0.182360125 |
| 0.000334393 | 0.195933834 |
| 0.000457199 | 0.204504017 |
| 0.000551152 | 0.210215634 |
| 0.000739218 | 0.218063937 |
| 0.000953943 | 0.223763832 |
| 0.001166316 | 0.228033066 |
| 0.001402843 | 0.232300231 |
| 0.00165145 | 0.236566018 |
| 0.001970164 | 0.239394247 |
| 0.002264728 | 0.242225235 |
| 0.002576228 | 0.244339167 |
| 0.002894941 | 0.247167397 |
| 0.003199233 | 0.248566343 |
| 0.003286127 | 0.249988042 |
| 0.003643584 | 0.250667175 |
| 0.003911637 | 0.252070258 |
| 0.004203849 | 0.253470584 |
| 0.004351126 | 0.254886077 |
| 0.004631259 | 0.256287782 |
| 0.004843785 | 0.256981394 |
| 0.00522054 | 0.258372756 |
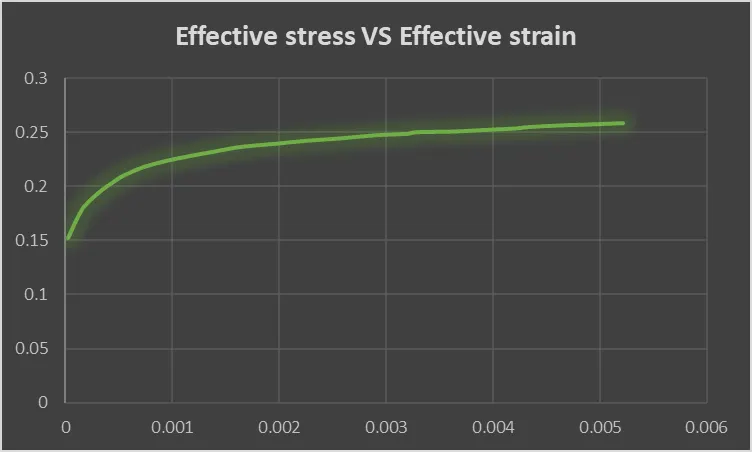
we use this curve as a material curve.
PROCEDURE:
Open the dogbone specimen in LS Dyna .
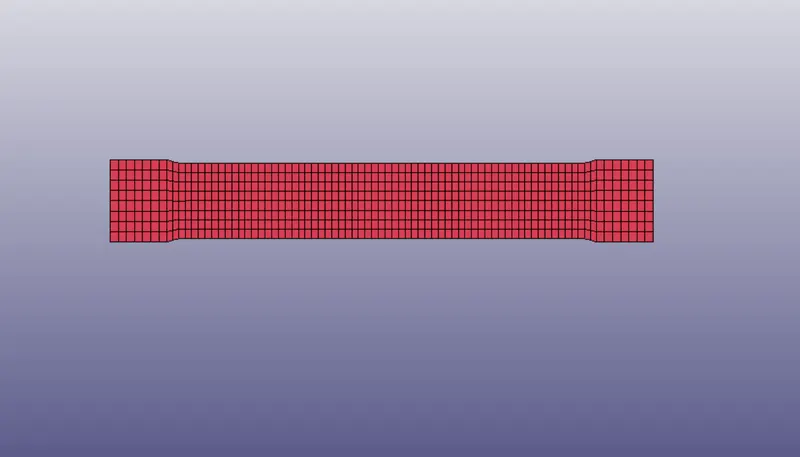
Necessary cards are generated for simulation.
SECTION:
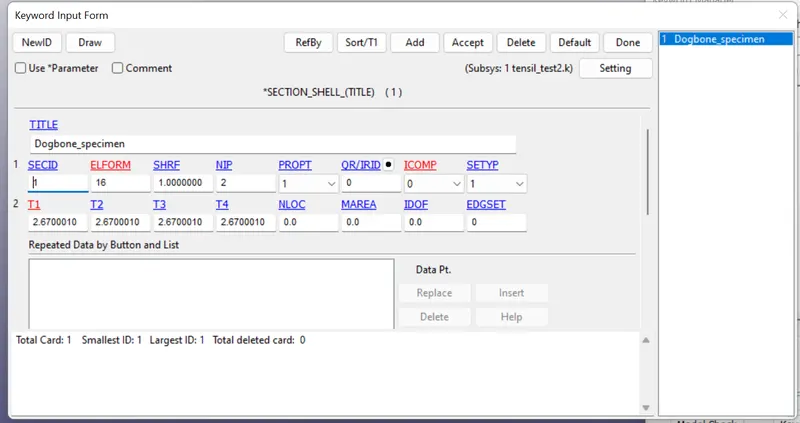
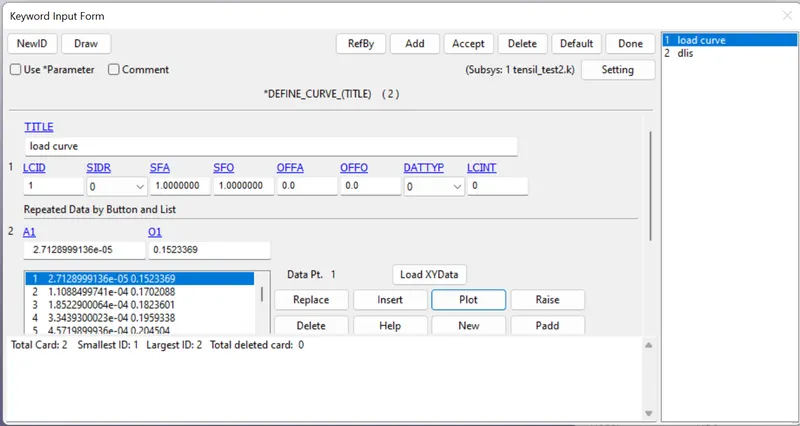
Material CURVE:
This effective stress vs effective strain saved in csv format is loaded with LoadXY data.
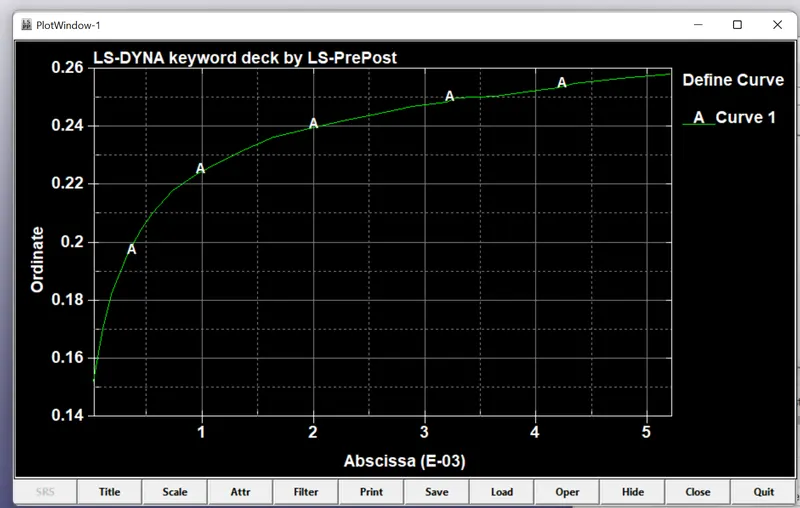
Plotting it we get,
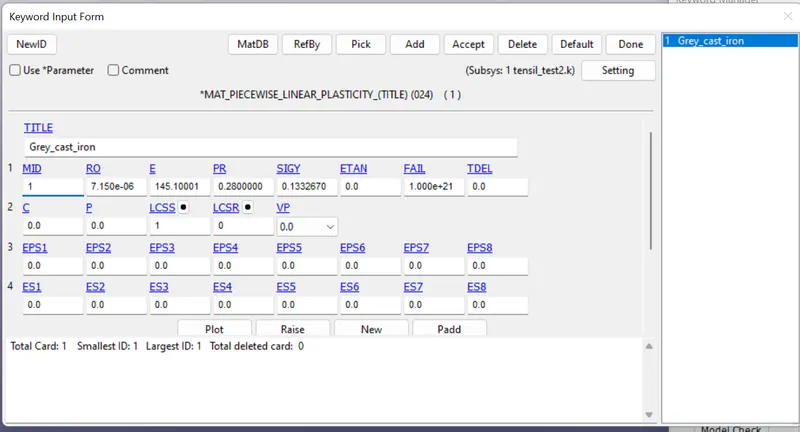
MAT_24
Boundary Conditions:
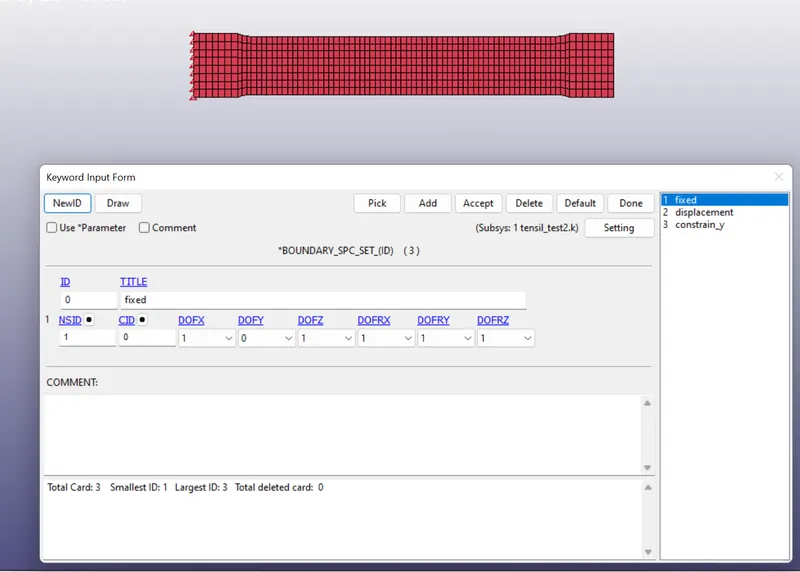
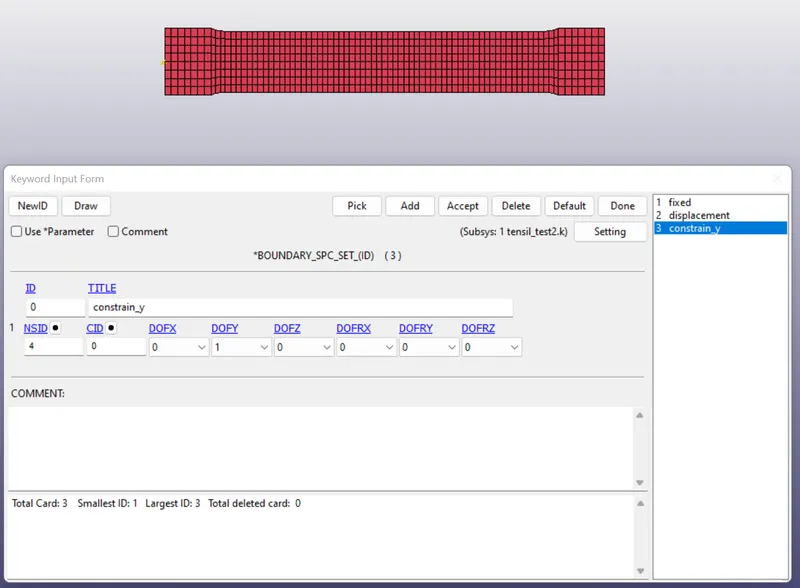
Fixing the nodes
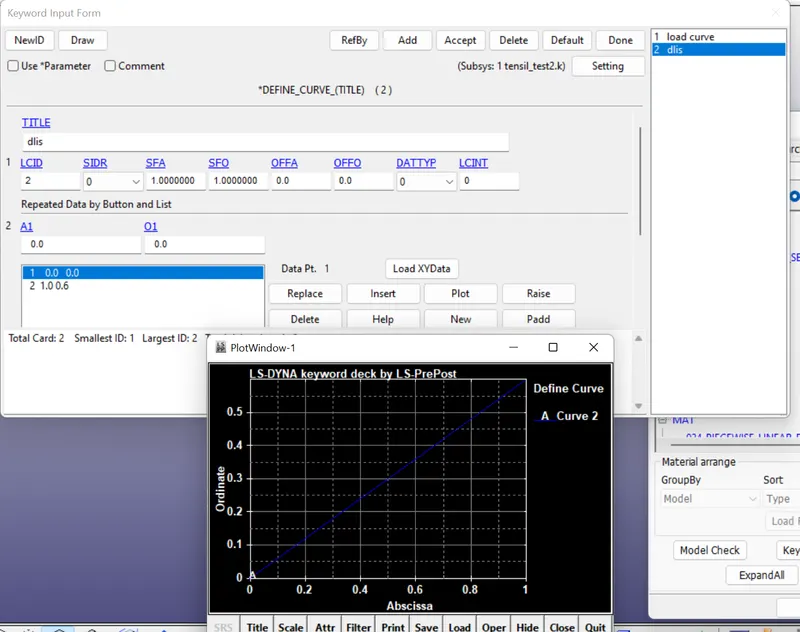
Displacement curve:
Giving displacement of max 1 mm gives close to the highest value strain in the curve.
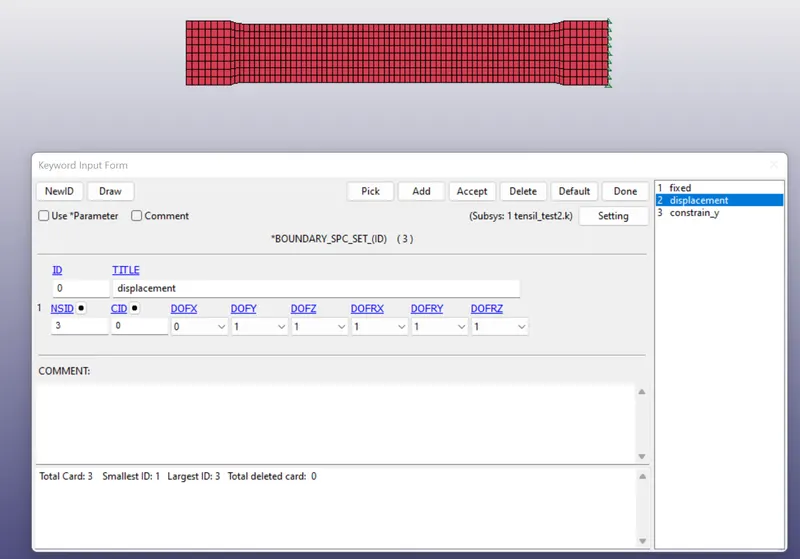
Boundary prescibed motion:
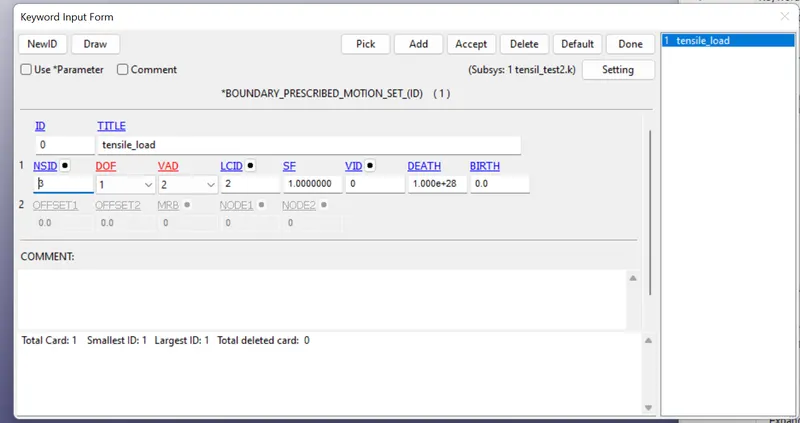
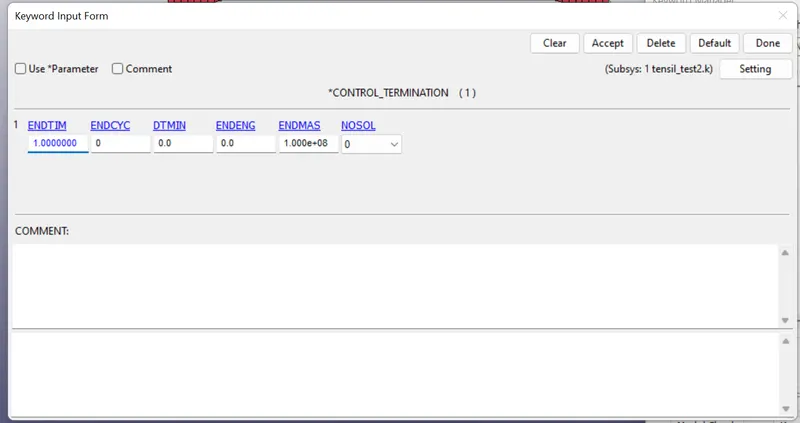
Termination time is given 1 ms
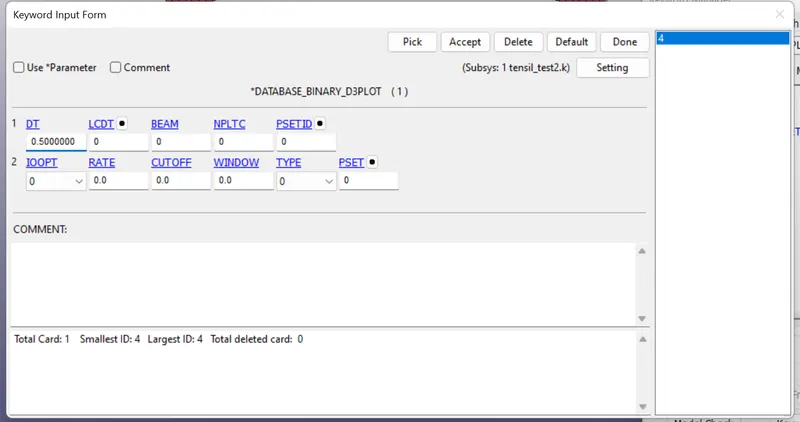
Output Data:
D3plot:
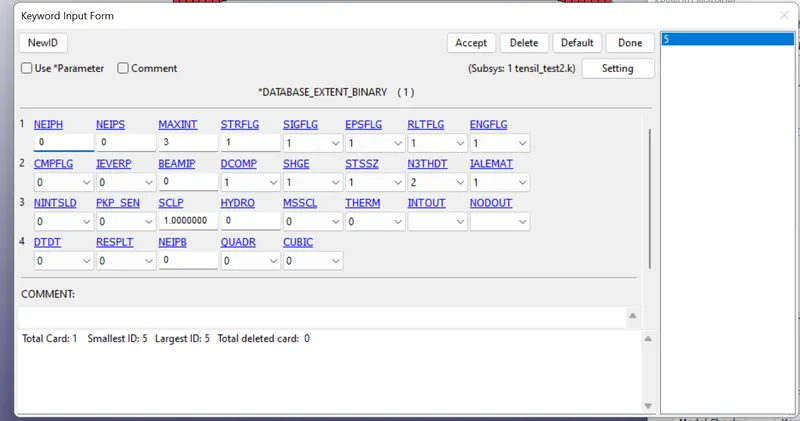
Extent Binary:
In ASCII
ELOUT and GLSTAT is activated.
Result:
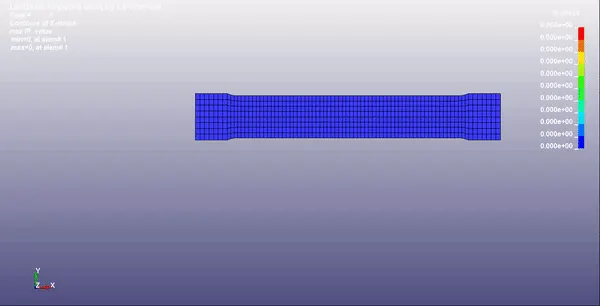
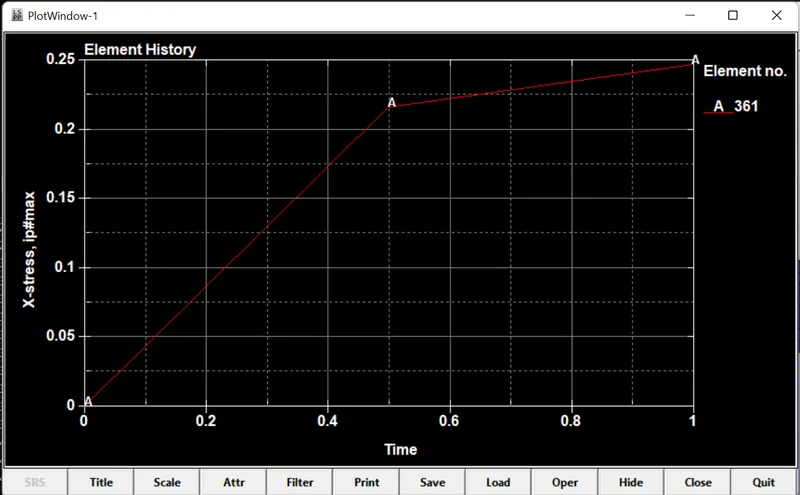
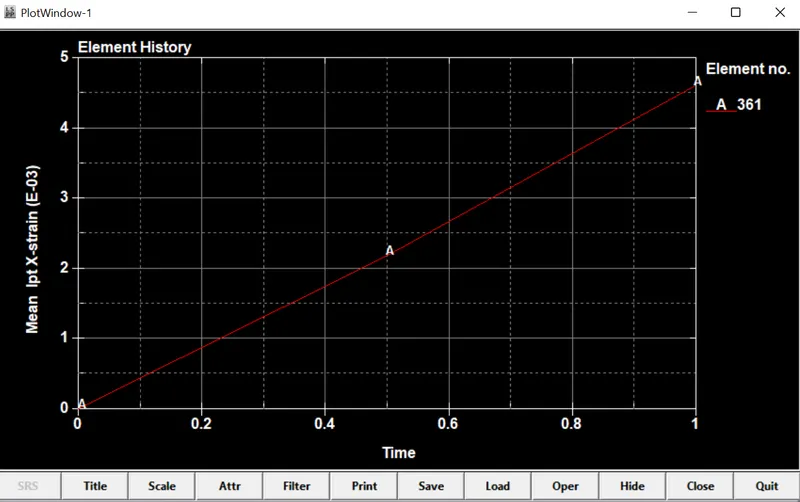
Simulation
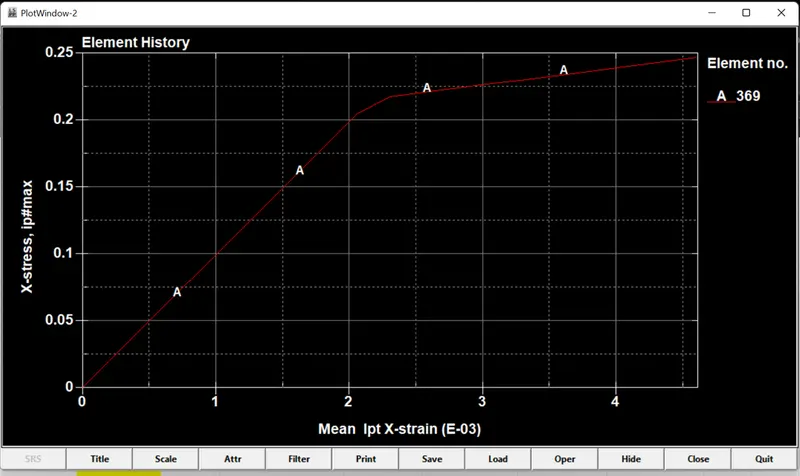
Conclusion:
The given Stress strain curve is converted to material data and is validated with given Dogbone specimen. From the results it can be concluded that the material model build is fairly accurate and acceptable, however more validation tests are recommended.