Week 9 Challenge
Aim: To model the EMS with battery, fuel cell and Ultracapacitor for the positive power.
The top level model is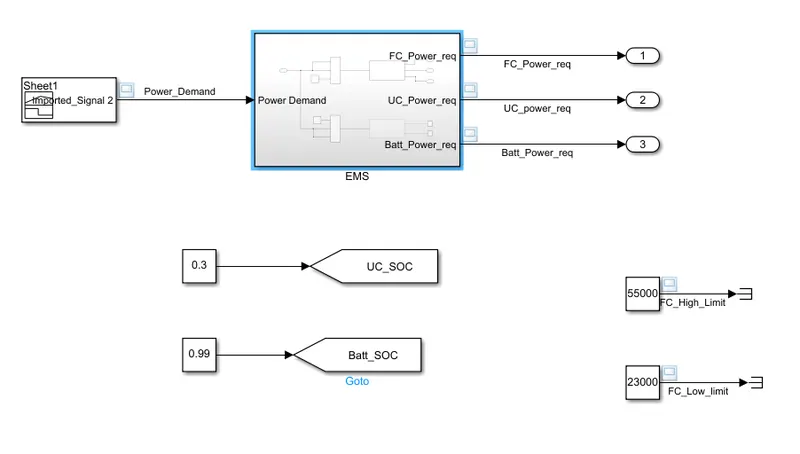
A signal builder block is used to provide the power demand for the EMS. The SOC of the Battery and ultracapacitor is provided by using constant block.
First step is to sort positive and negative power demand which is done by using the switch block. we will look in details about how the positive power demand is separated to the three power sources.
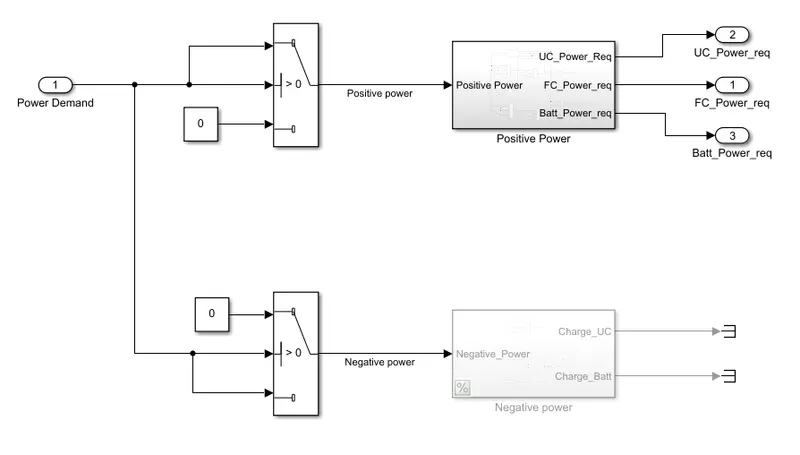
The distrubution of positive power demand is created in the picture attached below.
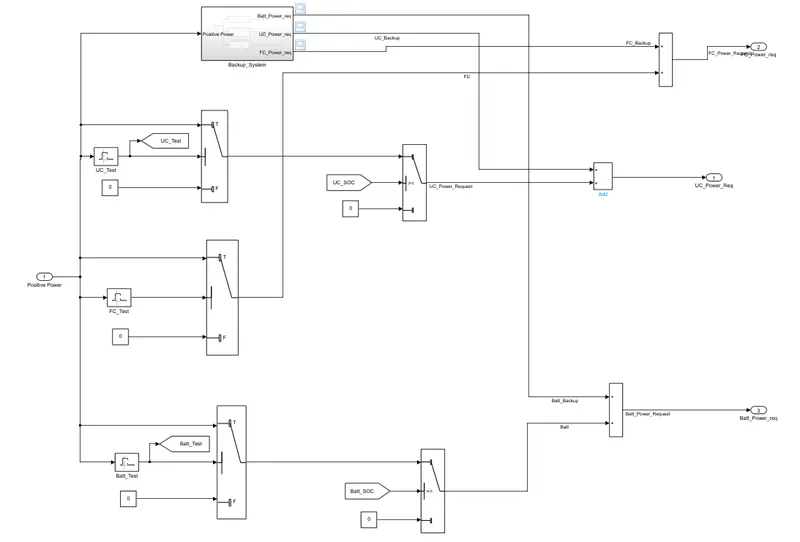
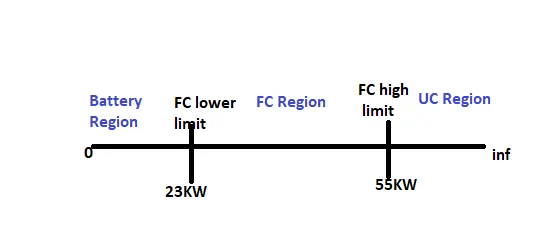
Since our EMS has three power source, we have to use every component in an efficient way. so The power demand is sorted into three regions based on the FC operating limit.
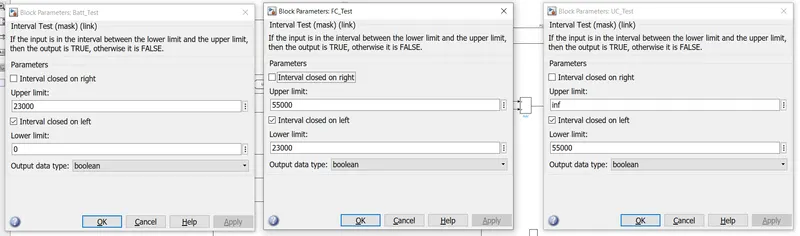
Below FC operating limit - 0 to 23KW - Battery can provide power in this region.
FC operating limit - 23 to 55KW - Fuel cell can provide power in this region.
Above FC operating limit - 55KW to infinity - UC can provide power in this region.
The above sorting is done by using interval test block parameters image attached below.
We also need to provide the backup system if either battery or UC or both may not have sufficient charge to meet the power demand.
So the Backupsystem is created in three subsystem separately for all three components.
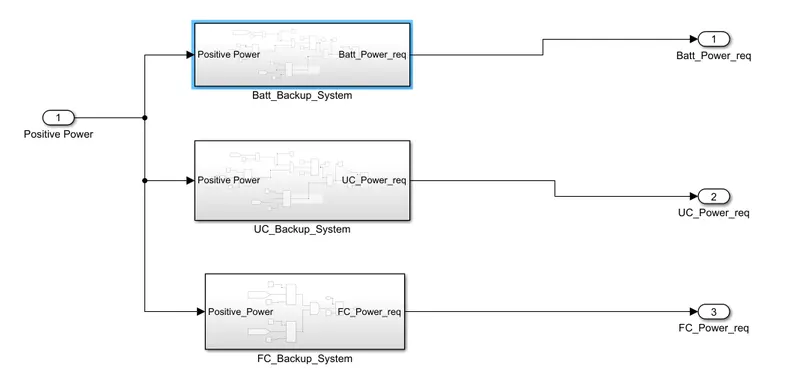
Battery Backup System:
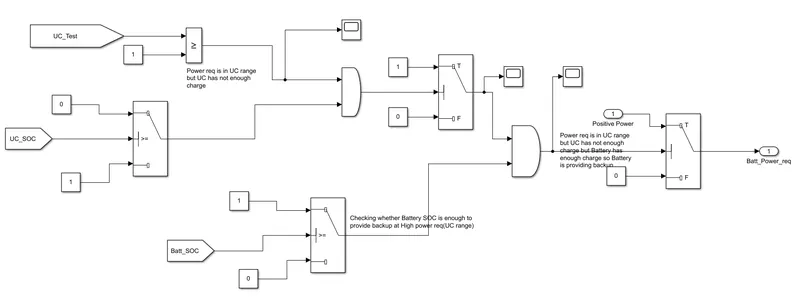
In this subsytem, battery is providing backup when the ultracapacitor is not having enough charge.
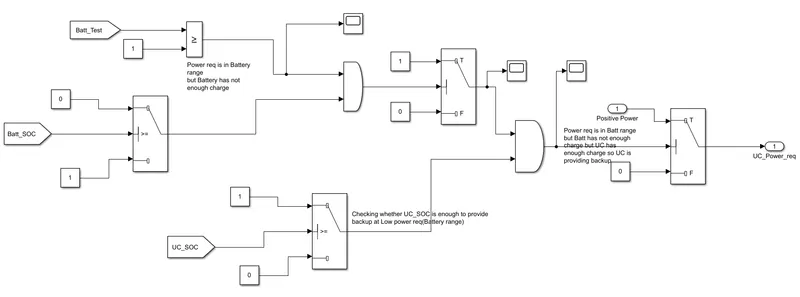
Ultracapacitor Backup System:
In this subsystem, UC is providing backup when the Battery is failed.
Fuel Cell Backup System:
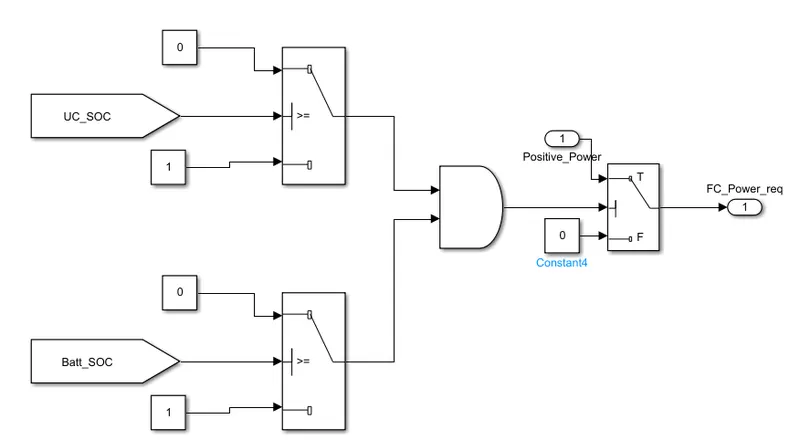
When both the battery and Ultracapacitor fails, Fuel cell has to provide the backup in all three region without comprising the performance.
Results:
Case1: Battery SOC is 70% and UC SOC is 73%:
The results obtained are attached below
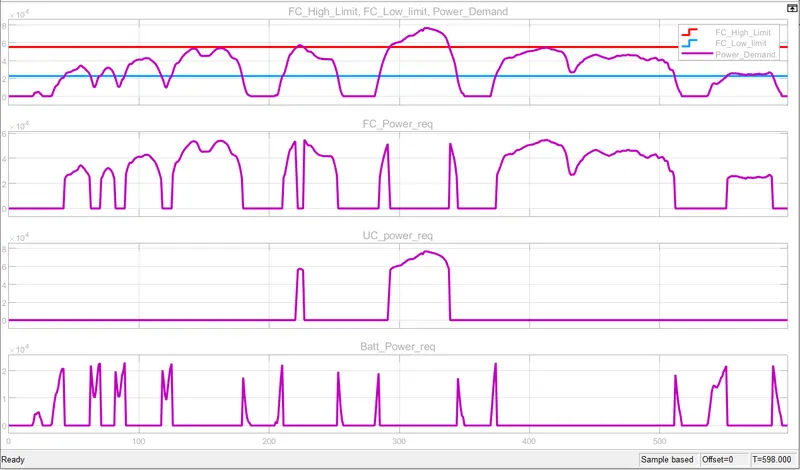
- The first plot shows the input power demand (purple), FC higher operating limit (red) and Fc lower operating limit (blue).
- When the power demand falls below FC lower limit, battery comes into action which is shown in 4th plot.
- When the power demand is in between FC limits, the FC comes into action which is observed in plot 2.
- When the power demand exceeds FC higher limits, then the ultracapacitor will provide the power (plot3).
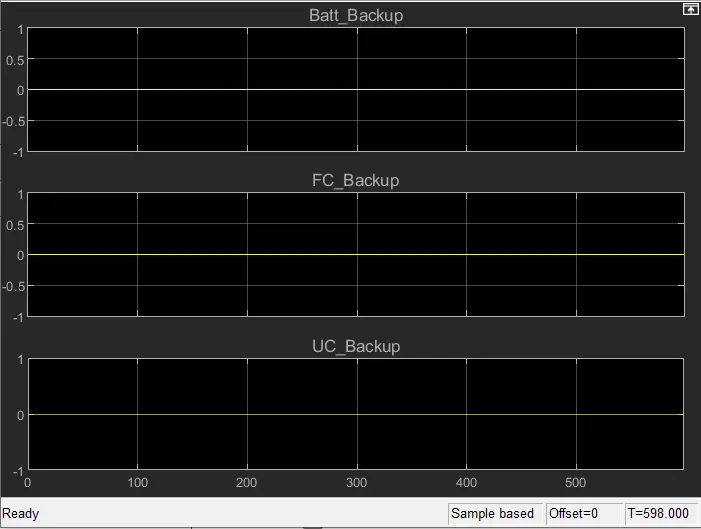
The above plot shows the backup power provided. In case:1 since the SOC of the battery and UC is far enough to meet the power requirement, so backup is provided which is indicated by a Zero in above plot.
Case2: Battery SOC is 30%, UC SOC is 70%
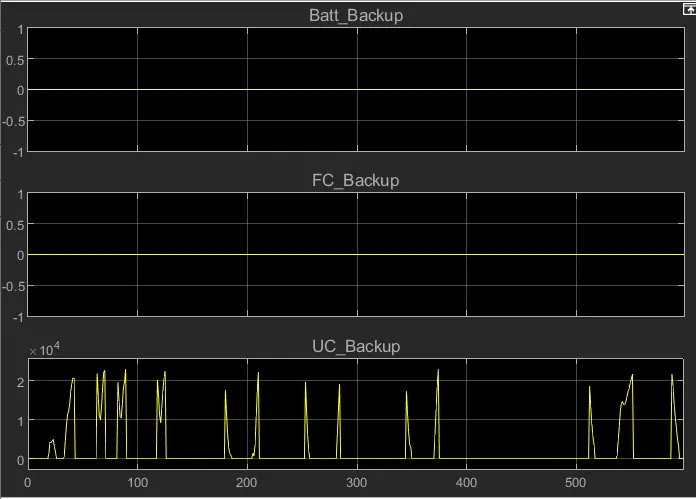
Since the Battery SOC is very low and cannot provide the power demand, the UC is providing backup at the low power demand without comprimising the performnace.
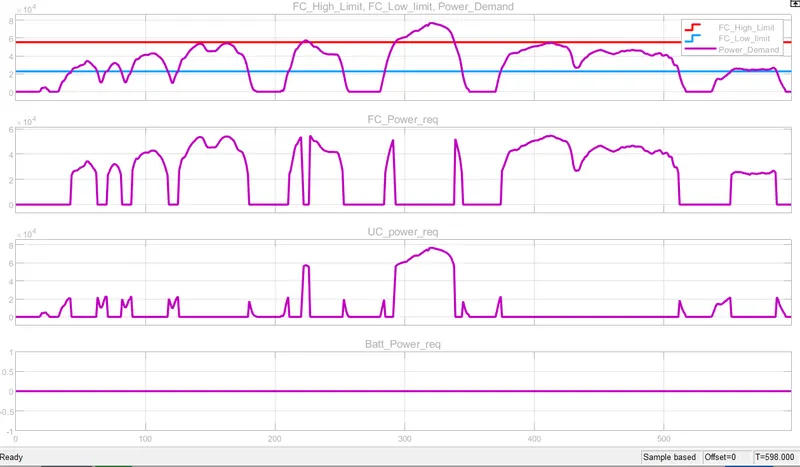
UC is providing backup to the low power demand(battery region), which is shown in the backup plot below.
Case3: Battery SOC is 70% and UC SOc is 30%
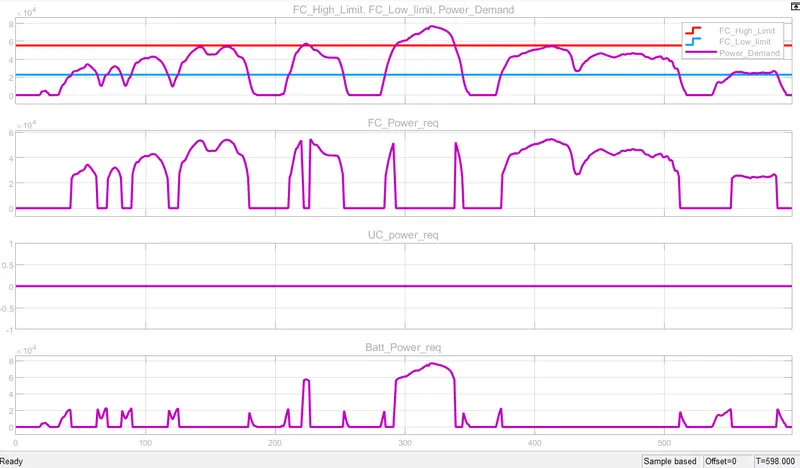
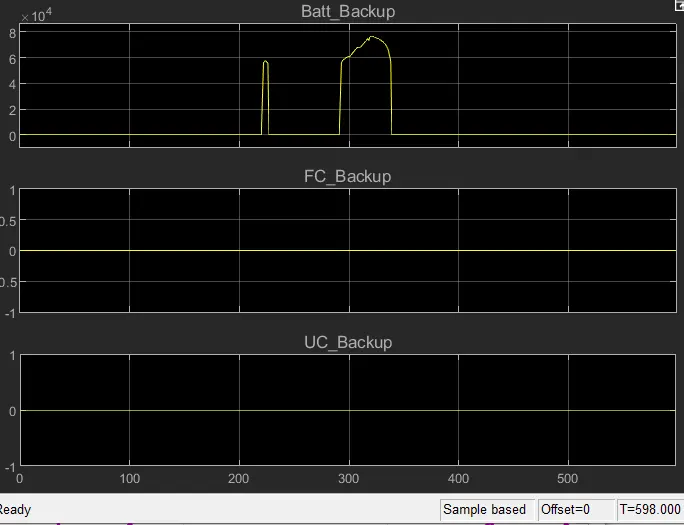
Since the UC has low SOC and failed to provide the higher power demand which is shown as a flat line in plot(3), Battery is providing Backup since the SOC of battery is 70%.
The backup plot below show at higher power region, battery is providing backup to UC.
Case4: Battery SOC 30% and UC SOC 30%
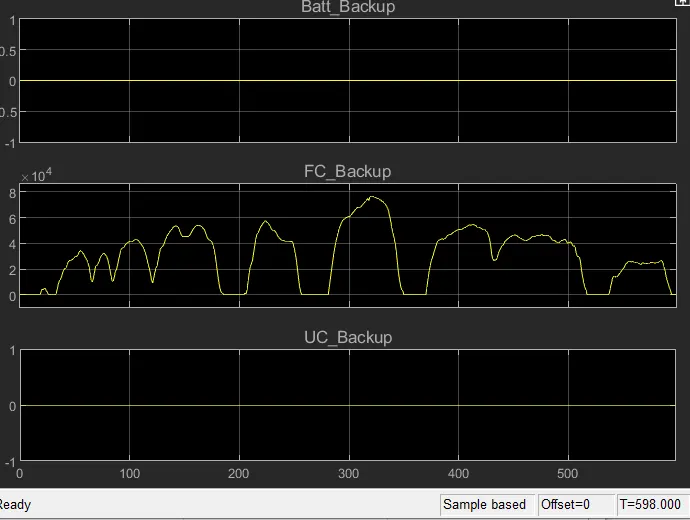
Since both the battery and UC has low charge, FC is the only power source to provide power demand in all three regions.
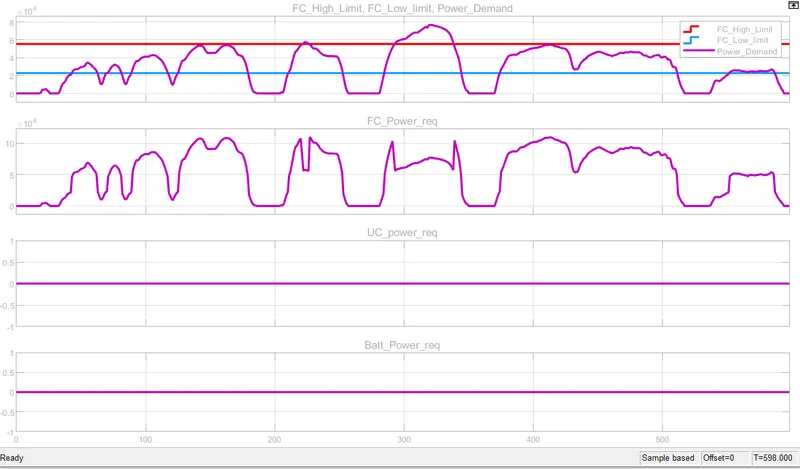
The FC backup in all three regions is shown in the plot below
Conclusion:
The EMS model with battery, Fc and UC is created and different test case with backup system is also explained with results.