#4 Configuration and Characteristics of Battery Model
1)Aim:
To configure a battery model in MATLAB from a datasheet of lithium ion battery.
Block Used in the model:
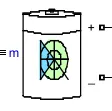
The Battery block implements a generic dynamic model that represents most popular types of rechargeable batteries.
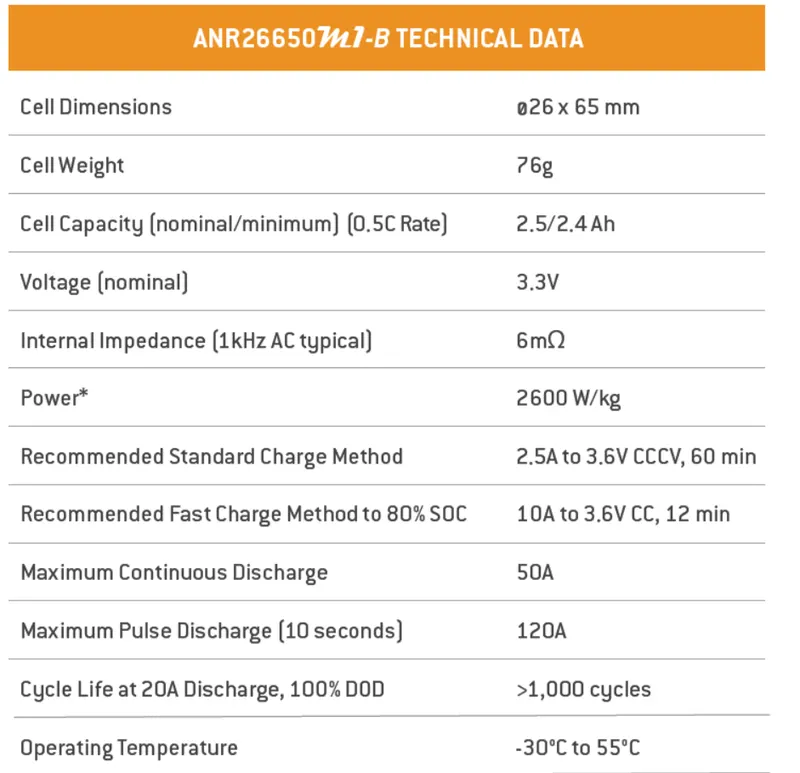
The reference data of ANR26650 battery from A123systems is used.
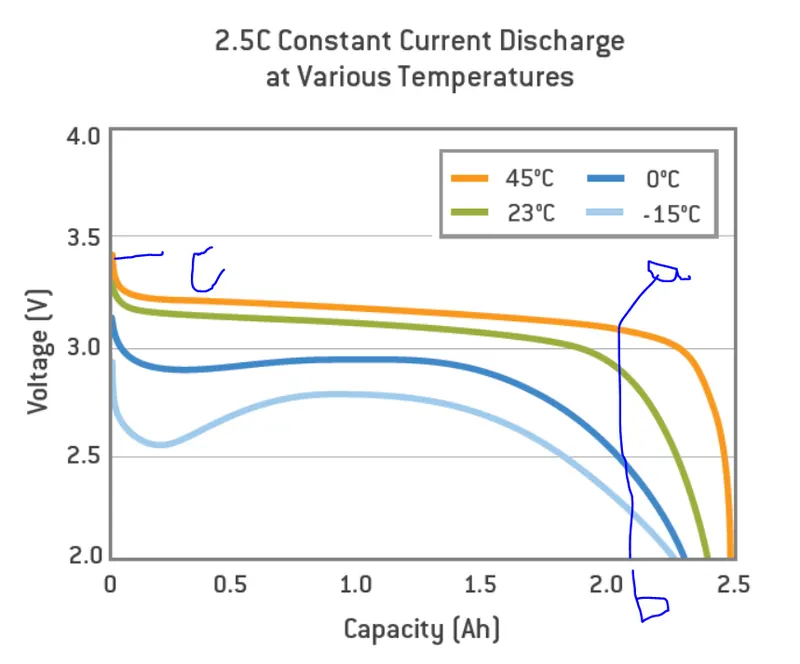
Some data are taken form the discharge characteristics graph given by the manufaturer for accuracy,
where a-Nominal Voltage
b- Capacity at nominal voltage
c- Maximum voltage
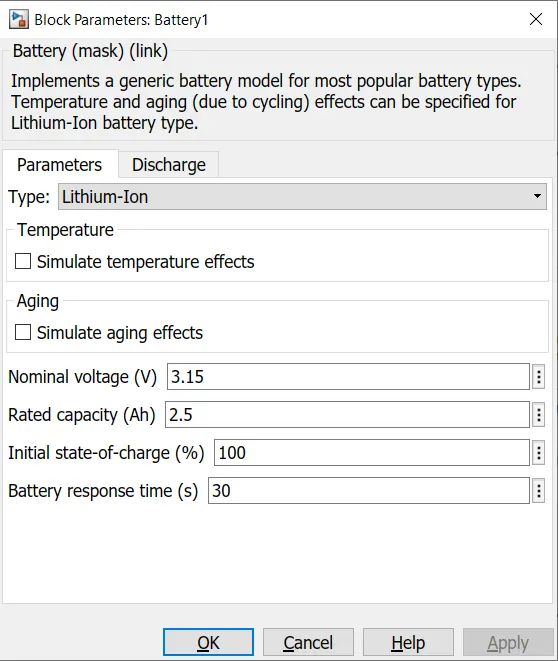
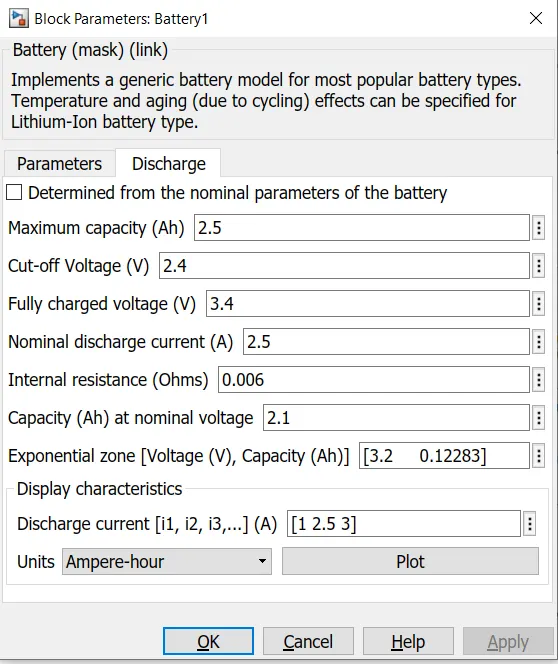
The Input Block Parameters as per the datasheet are
A typical discharge curve consists of three sections,
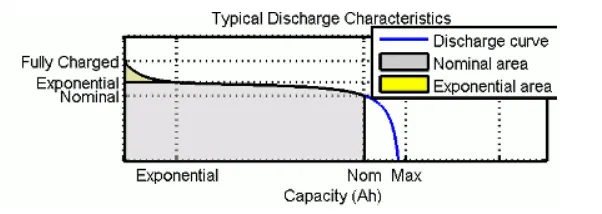
The first section represents the exponential voltage drop when the battery is charged. The width of the drop depends on the battery type.
The second section represents the charge that can be extracted from the battery until the voltage drops below the battery nominal voltage.
Finally, the third section represents the total discharge of the battery, when the voltage drops rapidly.
The results obtained are
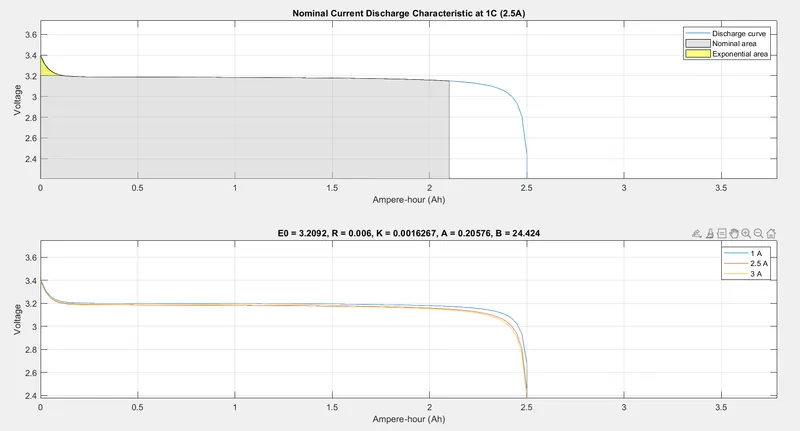
The discharge curve obtained is almost similar to the curve defined by the manufacturer.
Also the discharge curve at 1, 2.5 and 3 A is also plotted and observed at 3A discharge rate is lesser when compared to 1A curve.
2) To simulate generic vattery model charge discharge using UDDS drive cycle.
The EPA Urban Dynamometer Driving Schedule (UDDS) is commonly called the "LA4" or "the city test" and represents city driving conditions. It is used for light duty vehicle testing. The UN/ECE Regulation 53 refers to the EPA UDDS as the "Test Equivalent to the Type 1 Test (verifying emissions after a cold start)."
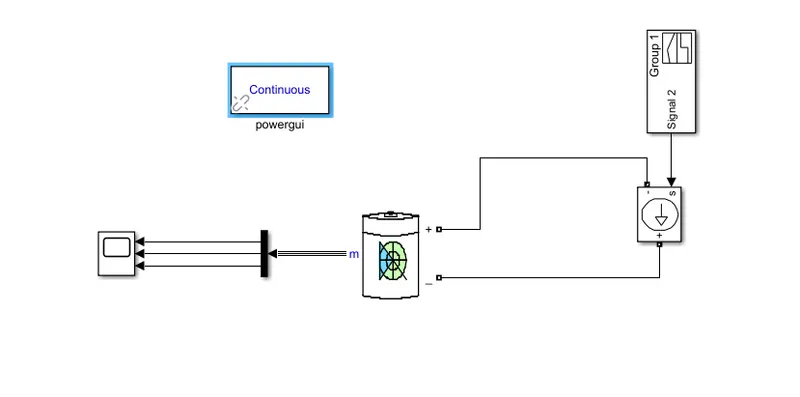
Model Explanation:
Signal builder block is used to create the input UDDS drive cycle, the created signal in given to the controlled current source which is connected to the terminals of the battery, The output signal is separated using demux and plotted in scope.
Results:
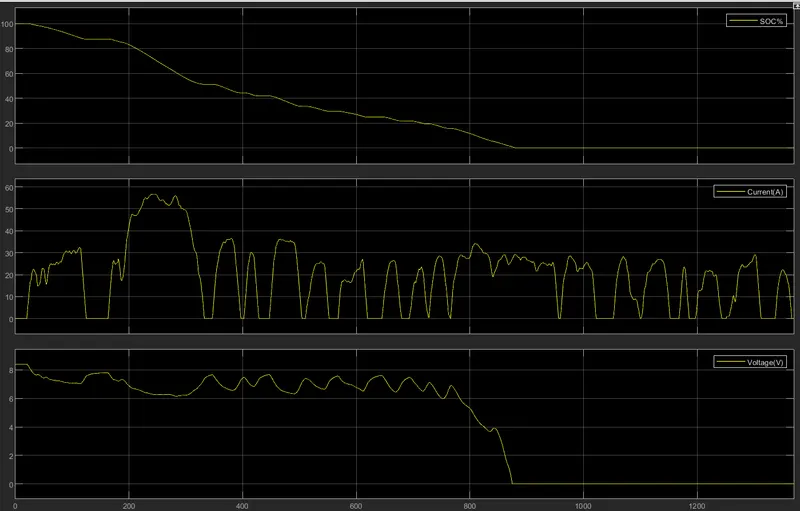
The first graph shows the state of charge of the battery which is decreasing with the increase in time. also a minor increase in soc is observed due to regenerative braking.
The current drawn form the battery is shown in the second plot, in which also regenerative braking is shown by the increase in current value for a brief instance.
From the third output results, we can observe that the voltage is suddenly drops from its maximum voltage to nominal value and then slowly decreasing as per the UDDS drive cycle. In between we can also observe a increase in voltage which is due to regenrative braking at some instances.
Your Assets
| Filname | Size | Action |
|---|---|---|
| ANR2665…tems.pdf | 2.87 MB | |
| Battery…odel.slx | 38.96 KB |