Week 9 Challenge
AIM :- To calculate the wave load on bridge superstructure and then after that apply that load in stadd pro to analyse and results.
LIVE LOAD CALCULATION:-
Given: =Maximum crest elevation = 3 m
Number of girder supporting bridge, N = 3 m
Span length = 12 m
Width of deck slab = 9 m
Thickness of deck slab = 2 m
r = 5, Cva = 3, Cr = 0.4,
Storm elevation = 8.5 m
Zh = Maximum crest elevation - Centroid of I Section
= 3 - (1.7/2)
= 2.15 m
Zv = Maximum crest elevation - Elevation of bottom deck
= 3-1
= 2 m
Vertical load, Fv = r x Zv x Av
= 5 x 2 x (9 x (1.7/2)
= 76.5 KN
Horizontal load, Fh = r x Zh x Ah
= 5 x 2.15 x (3 x 12)
= 387 KN
Maximum vertical load, (Fv)max = Cva x Fv
= 3 x 76.5
= 229.5 KN
Maximum horizontal load, (Fh)max = (1+Cr(N - 1)) Cva x Fh
= (1+0.4(3-1) x 3 x 387
= 2090 KN
- PROCEDURE:-
1. Firstly a node is created. The height of pier is taken as 7 m.
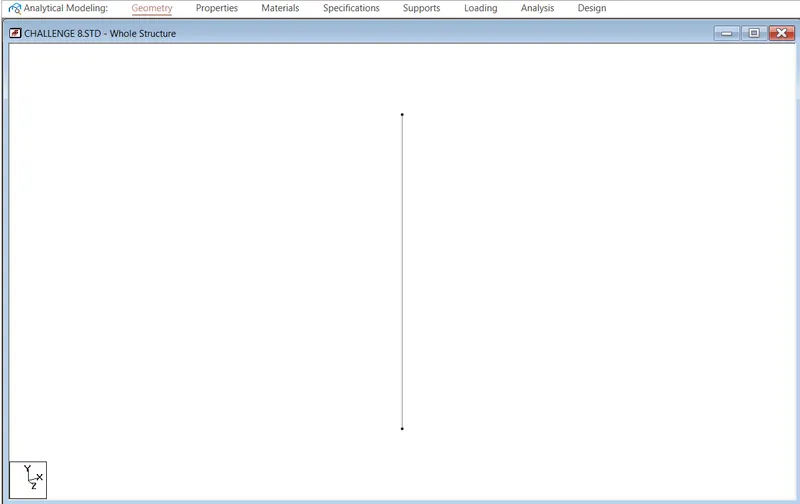
Figure Pier is created using node
2. After that with the help of translational repeat the frame of bridge is created.
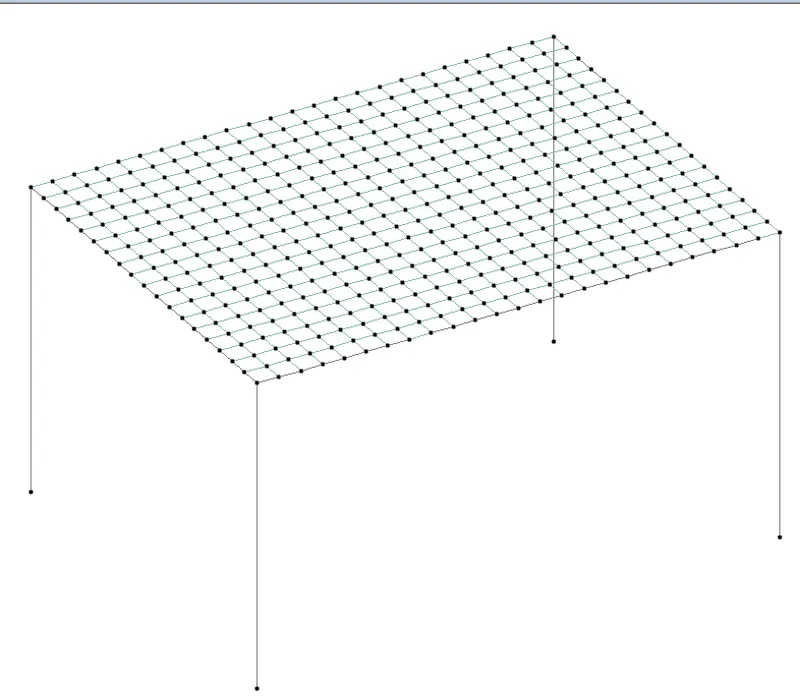
Figure Bridge frame is created with the help of node using translational repeat option
3. The bridge deck is created by using the mesh size of 0.5*0.5 m. The thickness of deck slab is 2 m
4. A circular pier of diameter 2.5 m is created. The centre to centre distance between the pier is 9 m.
5. A fixed support is created at the base of the pier.
6. Tappered I section girder is created using define option.
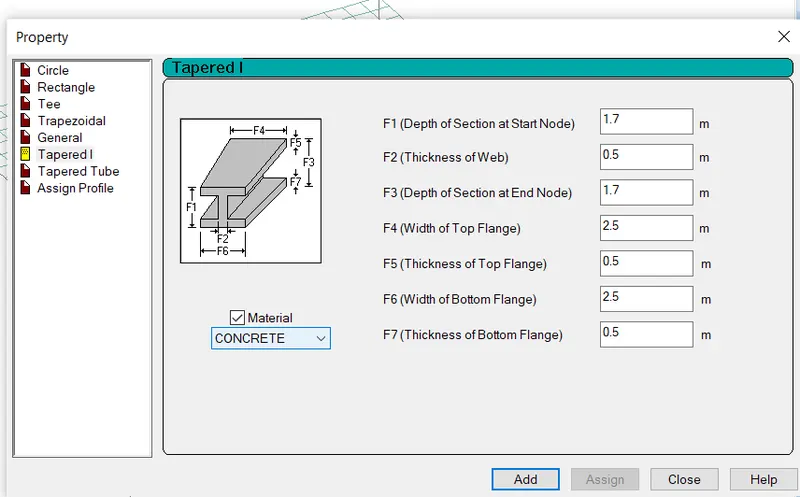
Figure Property of I Section
7. Cross beam of size 0.6 m * 1.2 m is created.
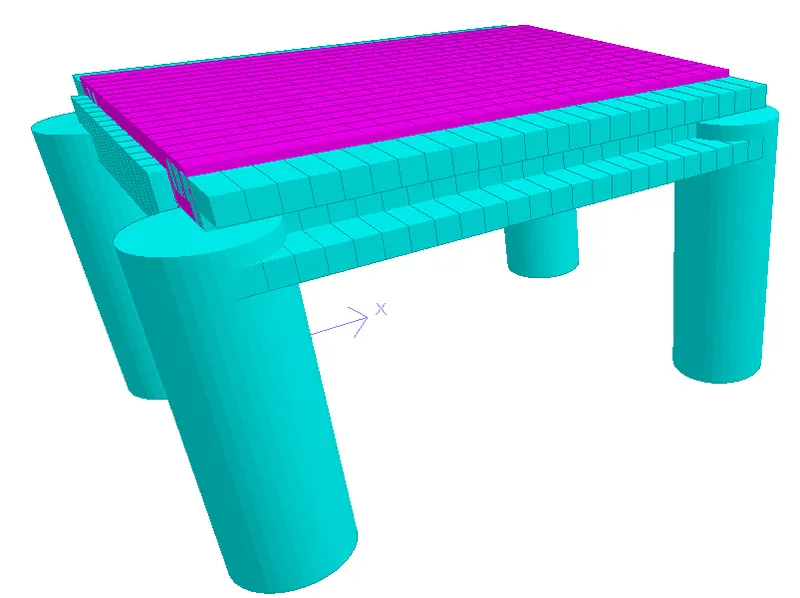
Figure 3D view of bridge
- LOADING
Loading-----load case details-----ADD-----WAVE LOAD------ADD------NODAL LOAD------NODE-----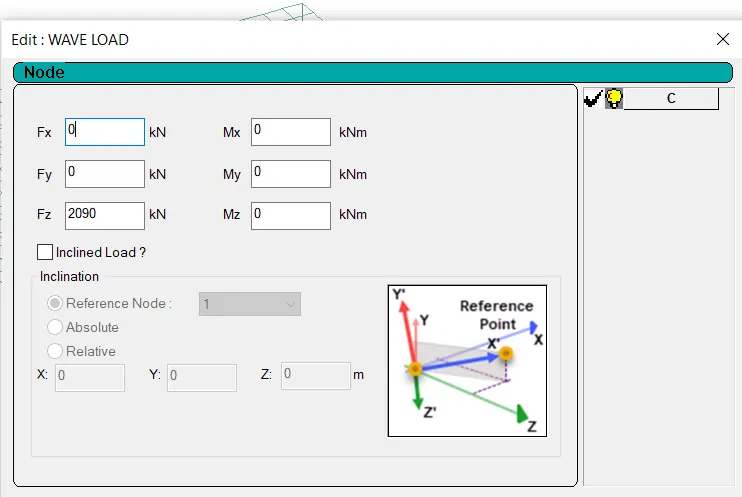
Figure Defined loading condition
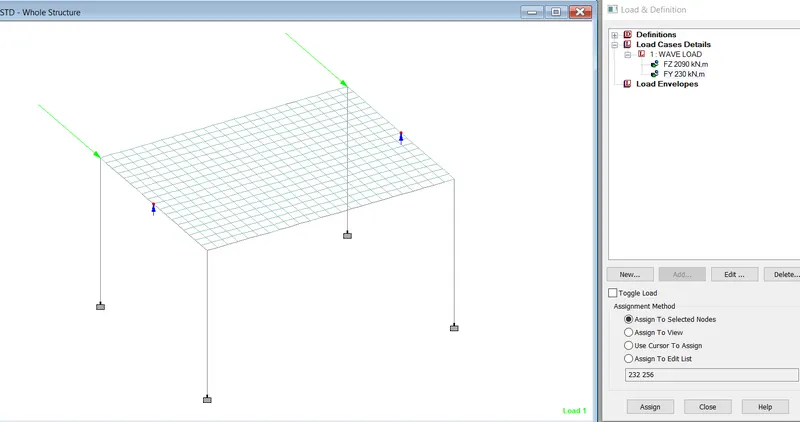
Figure Loading diagram of water Load
- RESULT ANALYSIS:-
1. STATIC CHECK:- Static check is ok as the difference between load and reaction is zero.
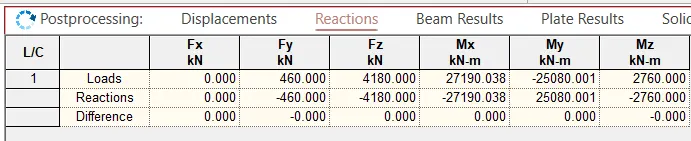
Figure Static check
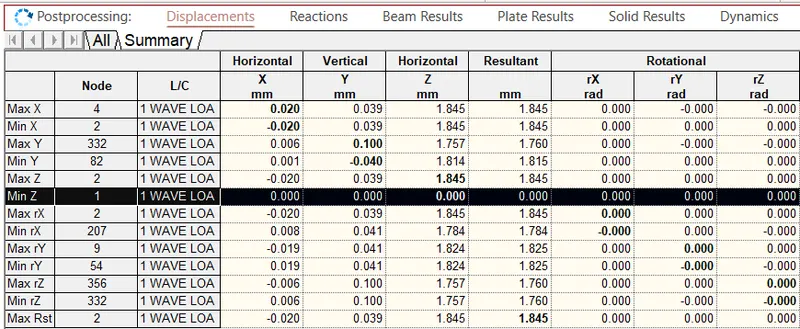
2. DEFLECTION:- Maximum deflection of the structure is 1.845 mm in Z direction at node 2.
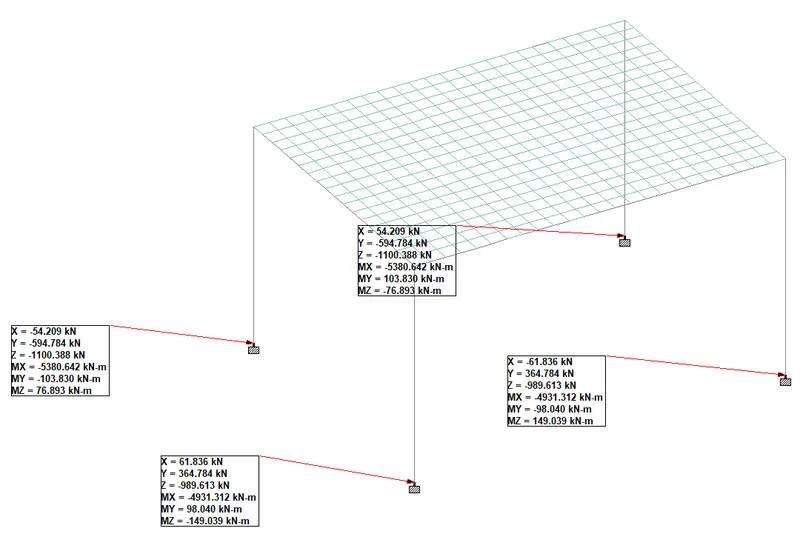
3. REACTION:-
| Horizontal | Vertical | Horizontal |
| Fx (KN) | Fy (KN) | Fz (KN) |
| 61.836 | 594.784 | 1100.388 |
| Moment | Moment | Moment |
| Mx (KN-m) | My (KN-m) | Mz (KN-m) |
| 5380.642 | 103.830 | 149.039 |
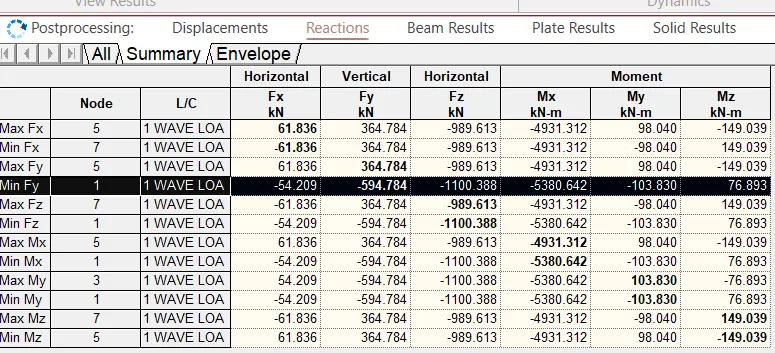
Figure Maximum reaction coming out of all the load cases
4. BEAM RESULTS:- GIRDER
|
Mz (KN-m) (At middle) |
Mz (KN-m) (At support) |
My (KN-m) | Shear y (KN) | Shear Z (KN) |
| 201.183 | 66.808 | 148.586 | 197.664 | 325.785 |
- CROSS BEAM
|
Mz (KN-m) |
My (KN-m) | Shear y (KN) | Shear Z (KN) |
| 407.086 | 6.744 | 414.409 | 9.417 |
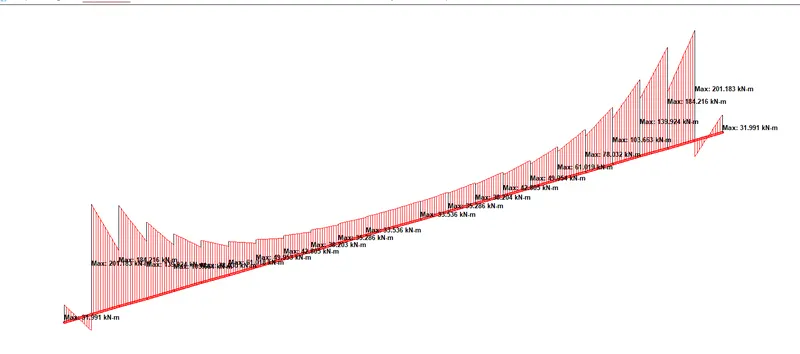
Figure Bending moment diagram of girder
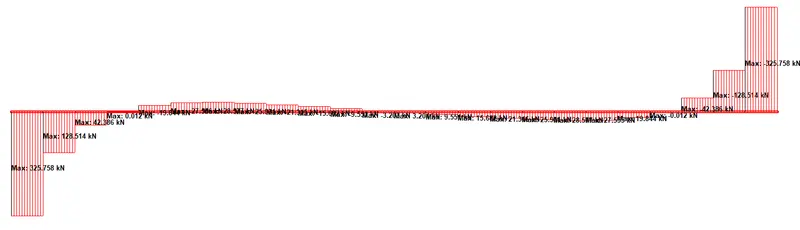
Figure Shear force diagram of girder
5. PLATE STRESSES
|
Mx (KN-m/m) |
My (KN-m/m) | Mxy (KN-m/m) | Shear y (N/mm2) | Shear Z (N/mm2) |
|
282.431 |
2327.615 | 922.339 | 0.208 | 0.053 |
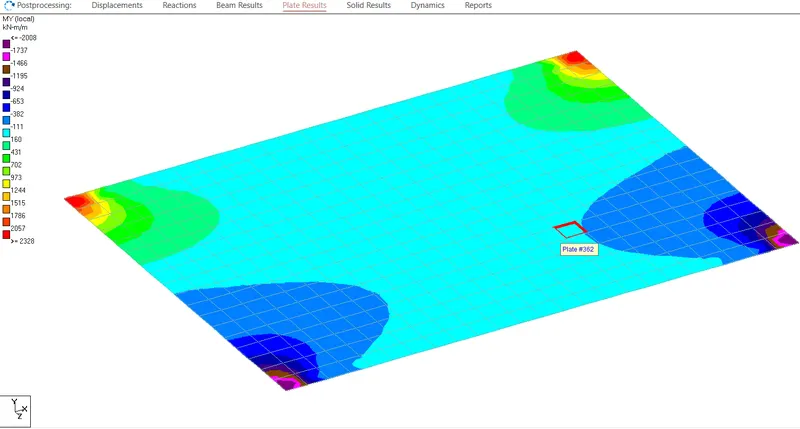
Figure plate stresses (maximum moment in x direction)
6. PIER RESULT
|
Mz (KN-m) |
My (KN-m) | Shear y (KN) | Shear Z (KN) |
| 302.571 | 5380.642 | 61.836 | 1100.38 |
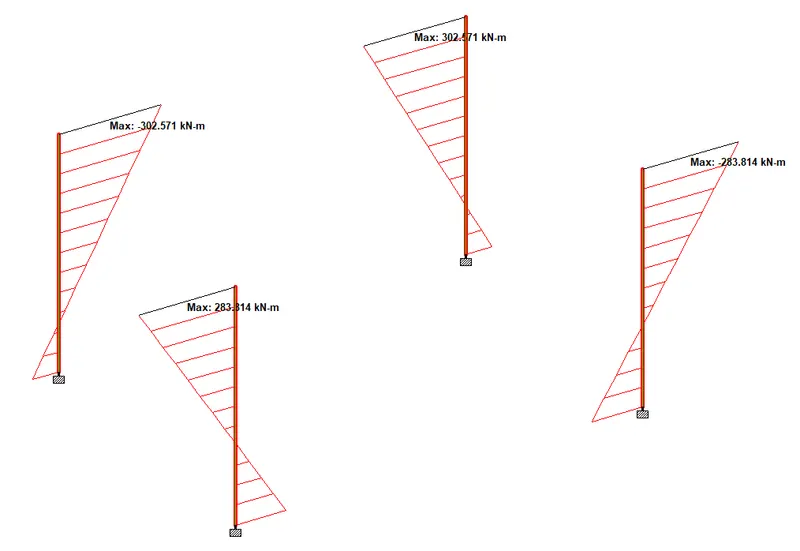
Figure Pier bending moment
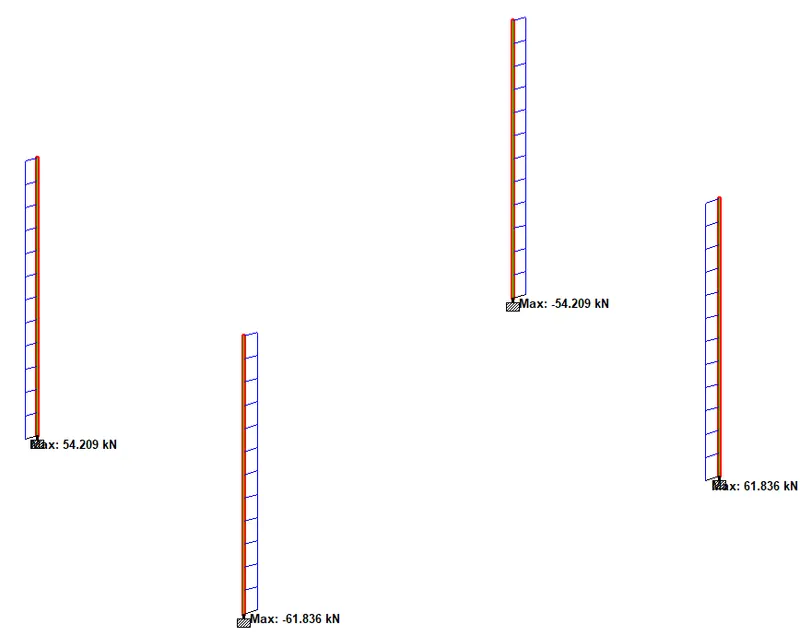
Figure Pier shear force