Week 8 - Simulating Cyclone separator with Discrete Phase Modelling
Aim:- To perform analysis on cyclone separator and calculate the separation efficiency and pressure drop.
Objective:-
- To write a few words about any four empirical models used to calculate the cyclone separator efficiency.
- To perform an analysis on a given cyclone separator model by varying the particle diameter from 1 μm to 5 μm and calculate the separation efficiency in each case. Discuss the results. [Use both the velocity's as 3m/sec.]
- To perform an analysis on a given cyclone separator model by varying the particle velocity from 1 m/sec to 5 m/sec and calculate the separation efficiency and pressure drop in each case. Discuss the results. [Use particle diameter size as 5 μm for all cases & keep flow velocity same as particle velocity]
Boundary Conditions:-
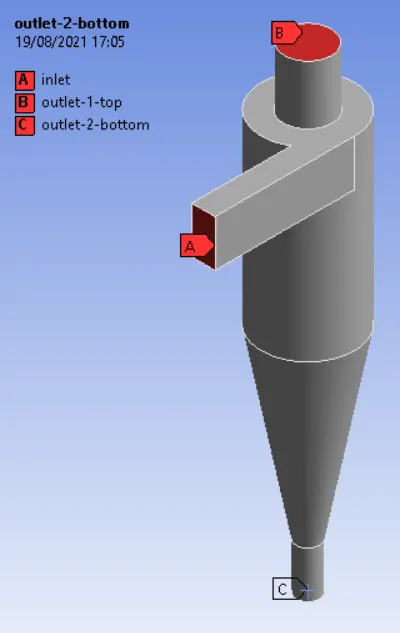
Inlet and wall:- Reflect
Outlet(Top):- Escape
Outlet(Bottom/dustbin) - Trap
Answer:
Cyclones are devices that employ a centrifugal force generated by a spinning gas stream to separate particles from the carrier gas. Their simple design, low maintenance costs, and adaptability to a wide range of operating conditions such as sizes and flow rates make cyclones one of the most widely used particle removal devices. By using suitable materials and methods of construction, cyclones may be adapted for use in extreme operating conditions: high temperature, high pressure, and corrosive gases. Cyclones are important particle removal
devices in both engineering and process operations.
Objective 1: To write a few words about any four empirical models used to calculate the cyclone separator efficiency.
An inaccuracy in cyclone efficiency prediction may result in an inefficient design of cyclone separators. Models to
predict the behaviour of cyclones are usually empirical. It remains largely a process of trial and error, since empirical cyclones models are only applicable to specific cyclone geometries.
Following four models has been described with brief introduction about them.
1) Iozia and Leith Model: Iozia and Leith logistic model is a modified version of Barth model which is developed based on force balance. The model assumes that a particle carried by the vortex endures the influence of two forces: a centrifugal force and a flow resistance.
The addition made by Iozia and Leith on the original Barth (1956) model are the core length and slope parameter expression which is derived based on the statistical analysis of experimental data of cyclone with D = 0.25 m.
2) Li & Wang Model: The Li and Wang (1989) model includes particle bounce or re-entrainment and turbulent diffusion at the cyclone wall. A two-dimensional analytical expression of particle distribution in the cyclone is obtained.
3) Koch & Licht Model: Koch and Licht collection theory recognized the inherently turbulent nature of cyclones and the distribution of gas residence times within the cyclone. Koch and Licht describe particle motion in the entry and collection regions.
4) Lapple Model: Lapple model was developed based on force balance without considering the flow resistance. Lapple assumed that a particle entering the cyclone is evenly distributed across the inlet opening. The particle that travels from inlet half width to the wall in the cyclone is collected with 50% efficiency.
Modeling of Cyclone Separator in Spaceclaim:
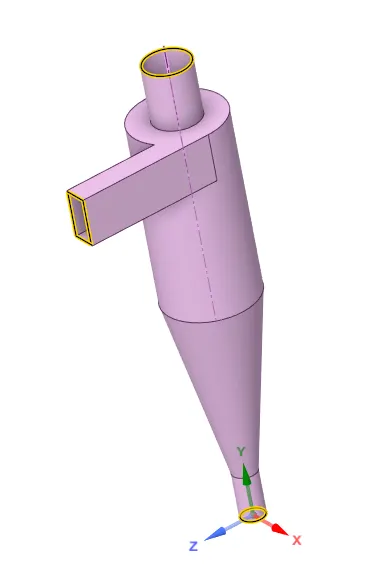
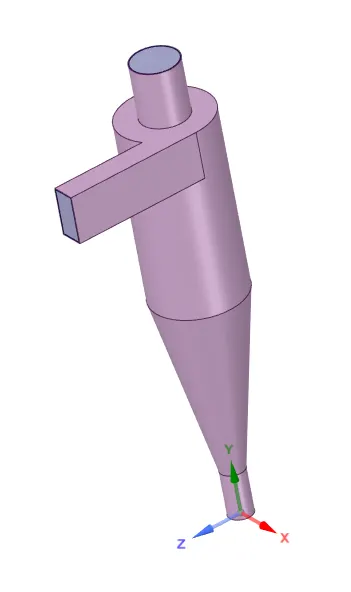
The model of cyclone separator has been given as an input for the project. The internal volume has been exctracted using the "volume extraction" command from the spaceclaim workbench. In first image, edges has been displayed to indicate close volume boundaries.
The extracted internal volume:
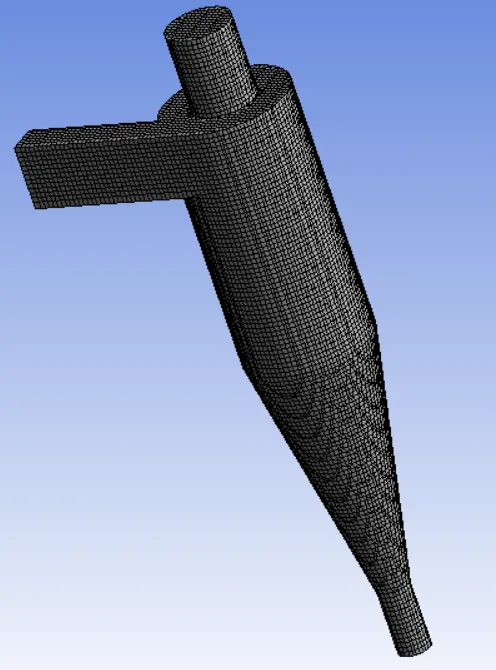
The mesh has been generated using the Ansys meshing using Cartesian Meshing method to create structured mesh. The element size has been taken as 10mm.
The named has been given to selected surfaces for easy identification during simulation setup.
In the simulation setup following steps has been taken.
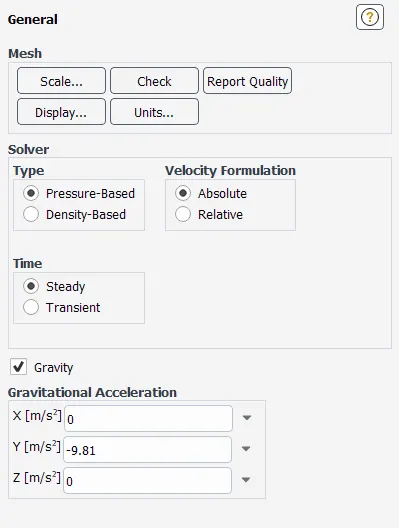
Simulation - Steady State Condition
Solver - Pressure Based
Gravity - Y direction - (-9.81 m/s^2)
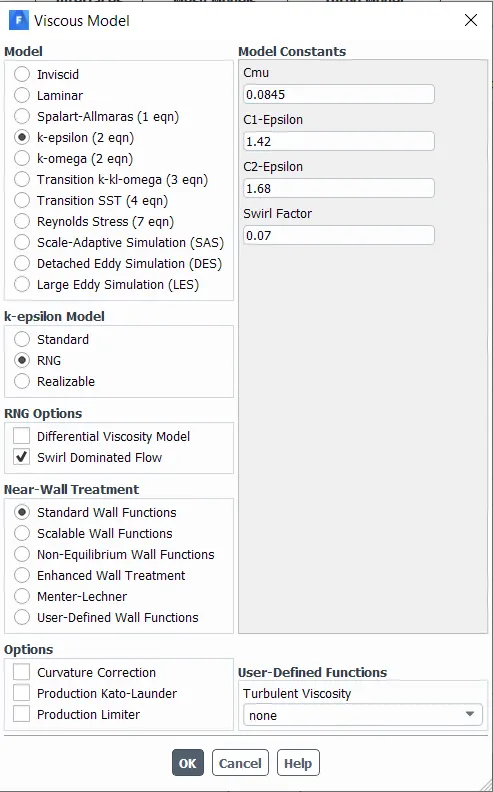
Viscous Model - K-epsilon RNG model with Swirl Dominated Flow & Standard Near-Wall Treatment
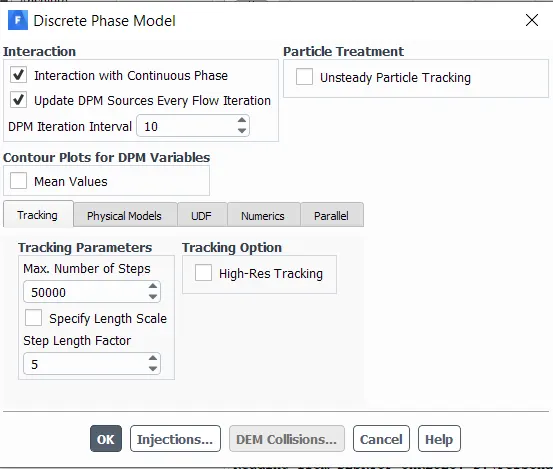
DPM (Discrete Phase Modeling) Setup
- Considered Coupled Flow
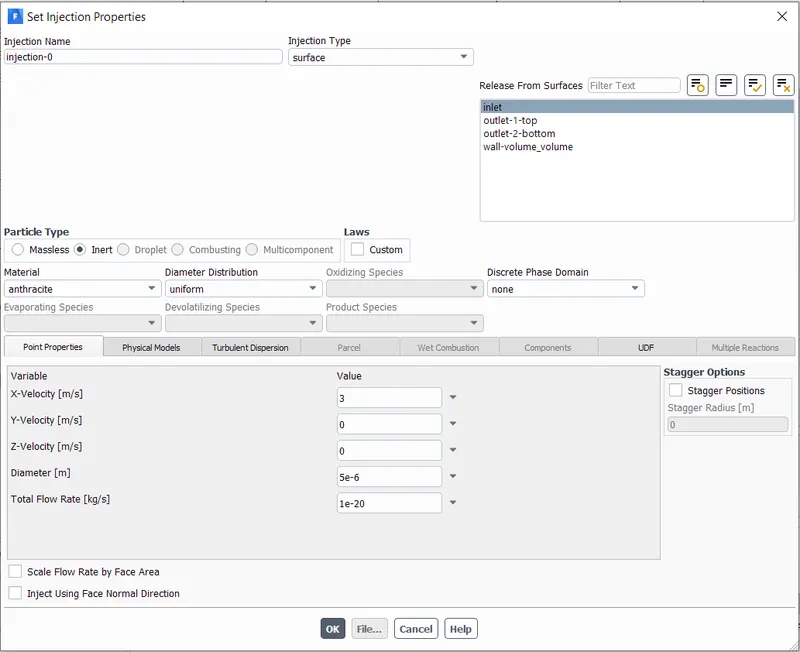
- Injections - Anthracite Material
The size of the Anthracite material particles & velocity of particles has been inserted into Injections dialogue box. The injection type has been selected as surface. For the first challenge, velocity of the particle will remain same, as 3 m/s, while the diameter of the particle will change from 1e-06 m to 5e-06m. For second challenge, the particle diameter will remain same, as 5e-06m, while the velocity of the particle will change from 1 m/s to 5 m/s.
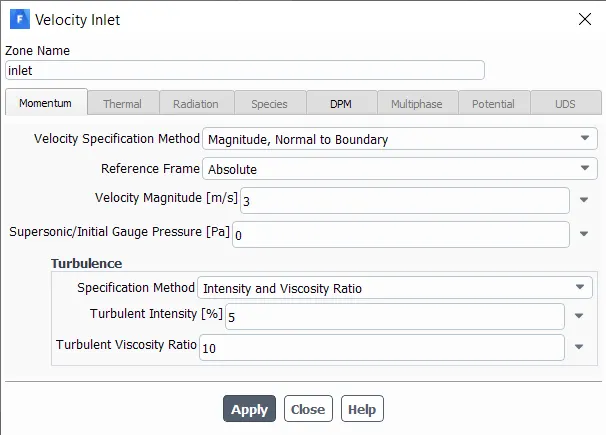
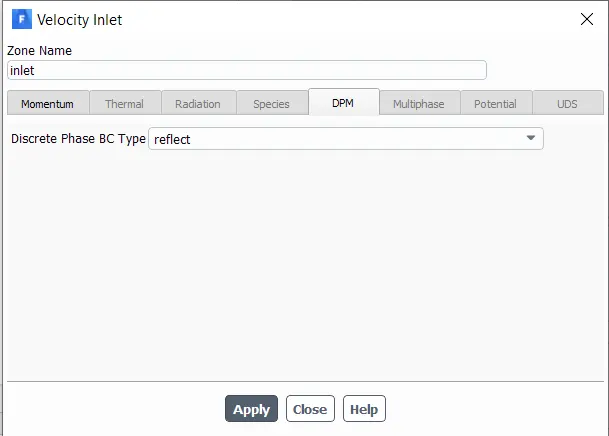
The velocity of the particle will also require to change from boundaries section. And the boundary condition for discrete phase has also been set from the inlet dialogue box which is set as reflect.
The reflect type of boundary condition means that particle will be rebound from the boundary with a change in its momentum as defined by the coefficient of restitution.
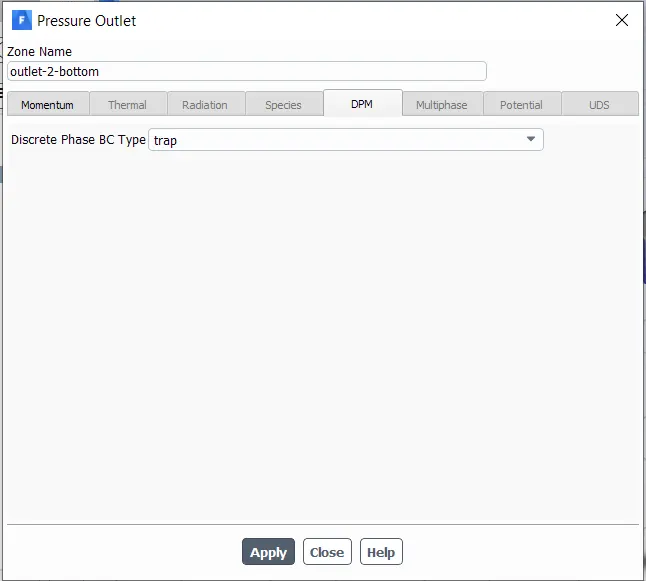
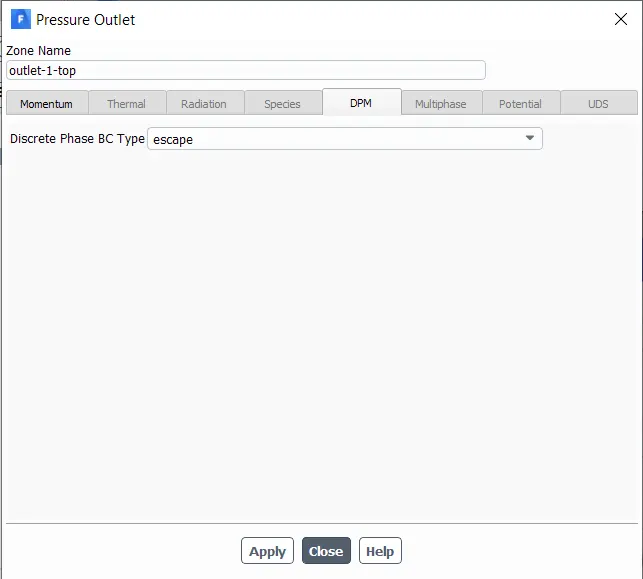
For the outlet boundary, the DPM has been set for escape for the top outlet & trapped condition has been set for the bottom outlet.
The escape boundary condition means that when the particle encounters the escape boundary, the trajectory of the particle will be terminated.
The trap boundary condition means that trajectory calculations will be terminated and records the fate of the particles "trapped".
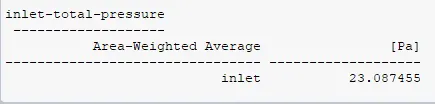
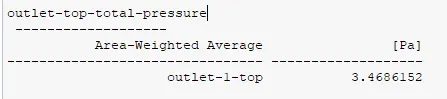
To calculate the pressure drop, the pressure has been calculted at the inlet & top outlet condition. The total pressure will be measured at both point. The pressure drop will be calculated by deductin the outlet pressure from the inlet pressure.
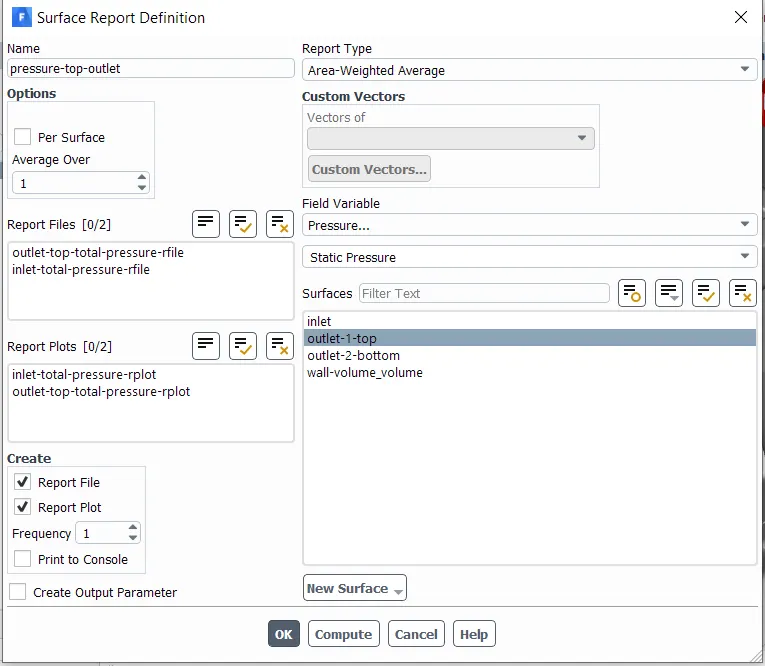
Similar way, the report file has been created for inlet pressure.
Standard initialization has been initiated to simulate the proces. After this simulation has been started.
Objective 2: To perform an analysis on a given cyclone separator model by varying the particle diameter from 1 μm to 5 μm and calculate the separation efficiency in each case. Discuss the results. [Use both the velocity's as 3m/sec.]
Following results has been provided for the 1e-06 m particle size for the 3 m/s velocity case. The remaining cases has been simulated in the similar way.
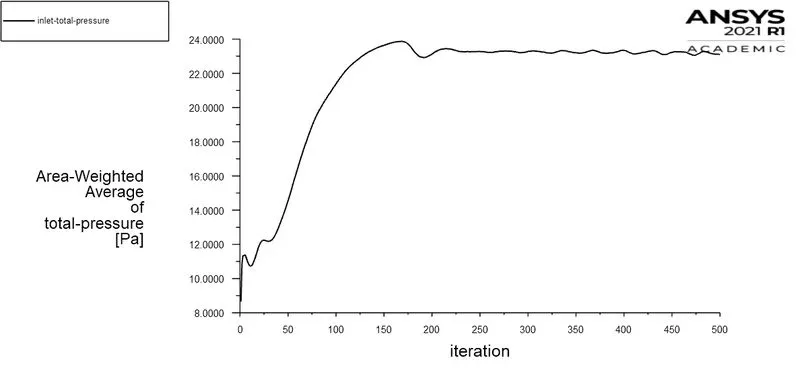
Residual graph:
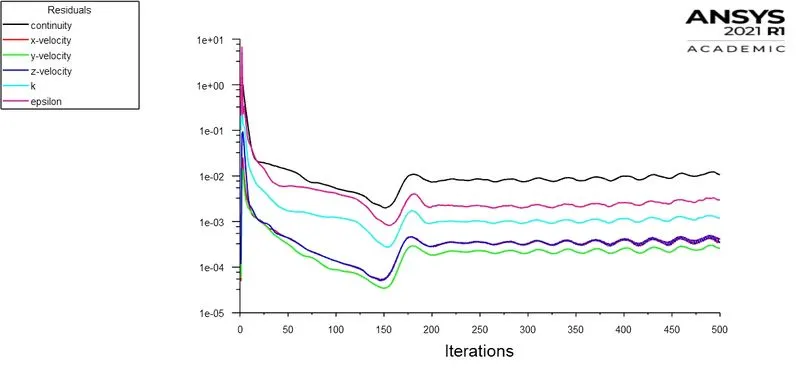
Total Pressure - Inlet:
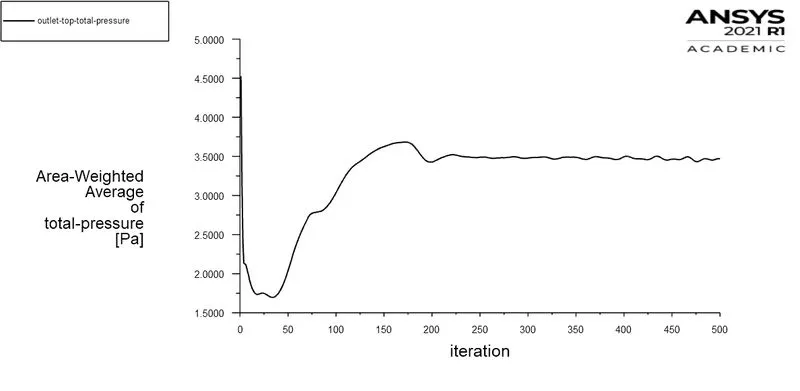
Total Pressure - Outlet Top
The particle history data has been exported for the CFD-post to process it & visualize the particles' trajectory inside the cyclone seperator.

In the CFD-post, the anthracite particle time has been selected in the color tab & 91 particles' trajectory has been visualize.
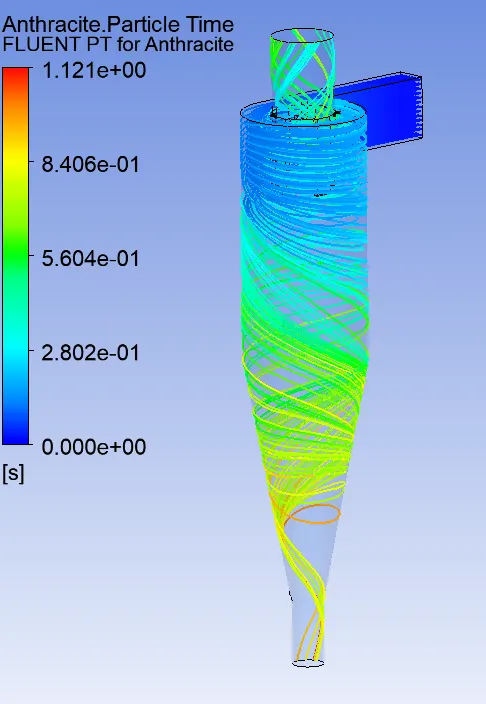
Following animation has been created to visualize each particle's trajectory inside cyclone seperator.
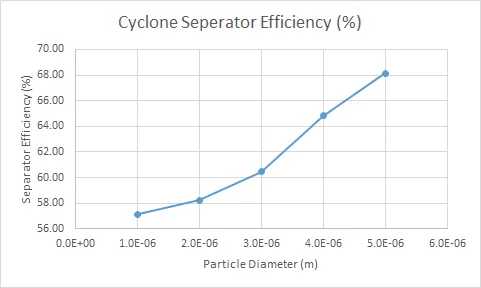
Following is the result for all particle diameter. The cyclone seperator efficinency has been measured for all particle diameter.
| Particle Dia (m) | Particle Tracked | Particle Trapped | Particle Escaped | Particle Incomplete | Seperator Efficiency (%) |
| 1.0E-06 | 91 | 52 | 36 | 3 | 57.14 |
| 2.0E-06 | 91 | 53 | 37 | 1 | 58.24 |
| 3.0E-06 | 91 | 55 | 36 | 0 | 60.44 |
| 4.0E-06 | 91 | 59 | 32 | 0 | 64.84 |
| 5.0E-06 | 91 | 62 | 29 | 0 | 68.13 |
Pressure drop has been calculated for all above simulations.
| Particle Dia (m) | Pressure inlet (Pa) | Pressure outlet (top) (Pa) | Pressure drop (Pa) |
| 1.0E-06 | 23.08 | 3.46 | 19.62 |
| 2.0E-06 | 23.06 | 3.46 | 19.6 |
| 3.0E-06 | 23.06 | 3.46 | 19.6 |
| 4.0E-06 | 23.06 | 3.46 | 19.6 |
| 5.0E-06 | 23.06 | 3.46 | 19.6 |
From above results of separator efficiency of different particle size in cyclone separator, it can be seen that the separator efficiency is increasing with particle size and less number of particles are able to escape & all particles are either trapped or escaped from the separator for the last two particle size. The graph shows the separator effciency with respect to particle size.
The pressure at inlet & outlet remain same for all particle size which can be seen from the above table.
Objective 3: To perform an analysis on a given cyclone separator model by varying the particle velocity from 1 m/sec to 5 m/sec and calculate the separation efficiency and pressure drop in each case. Discuss the results. [Use particle diameter size as 5 μm for all cases & keep flow velocity same as particle velocity]
Following table shows the results of all simulations:
| Particle Velocity (m/s) | Particle Tracked | Particle Trapped | Particle Escaped | Particle Incomplete | Seperator Efficiency (%) |
| 1 | 91 | 12 | 36 | 43 | 13.19 |
| 2 | 91 | 56 | 32 | 3 | 61.54 |
| 3 | 91 | 62 | 29 | 0 | 68.13 |
| 4 | 91 | 65 | 25 | 1 | 71.43 |
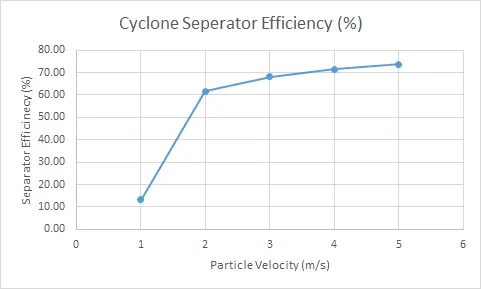
| 5 | 91 | 67 | 24 | 0 | 73.63 |
Pressure Drop measurement:
| Particle Velocity (m/s) | Pressure inlet (Pa) | Pressure outlet (top) (Pa) | Pressure drop (Pa) |
| 1 | 2.41 | 0.34 | 2.07 |
| 2 | 10 | 1.46 | 8.54 |
| 3 | 23.06 | 3.46 | 19.6 |
| 4 | 40.18 | 5.85 | 34.33 |
| 5 | 63.73 | 9.37 | 54.36 |
From above results in which particle velocity has been increased with each simulation, the particle size has been kept same at 5e-06 m, it can be seen that the efficiency was increased substantially from 1 m/s to 2 m/s and then the separator efficiency increased steadily. For 1 m/s particle velocity cse, 43 particles out of 91 were unable to complete which decreased drastically from 2 m/s case.
The pressure at the inlet & outlet increases with increasing particle velocity in almost all cases which can be seen the above table.
From these two challenges, it can be said that particle velocity has greater effect on the pressure than the particle size. In the latter case, the pressure remains same for all cases.