Week 8 - Simulating Cyclone separator with Discrete Phase Modelling
Aim of the Project
The objective of the project is to:-
1) Understand the Empirical model used to calculate the cyclone separator efficiency
2)To perform an analysis on a given cyclone separator model by varying the particle diameter from 1 μm to 5 μm and determining the separation efficiency in each case
3)To perform an analysis on a given cyclone separator model by varying the particle velocity from 1 m/sec to 5 m/sec and determining the separation efficiency and pressure drop in each case
Introduction to Cyclone Separators
Cyclone separators provide a method of removing particulate matter from air or other gas streams at low cost and low maintenance. Cyclones are basically centrifugal separators, consists of an upper cylindrical part referred to as the barrel and a lower conical part referred to as cone. They simply transform the inertia force of gas particle flows to a centrifugal force by means of a vortex generated in the cyclone body. The particle laden air stream enters tangentially at the top of the barrel and travels downward into the cone forming an outer vortex. The increasing air velocity in the outer vortex results in a centrifugal force on the particles separating them from the air stream. When the air reaches the bottom of the cone, it begins to flow radially inwards and out the top as clean air/gas while the particulates fall into the dust collection chamber attached to the bottom of the cyclone.
Empirical Models Used to calculate Cylone Separator Efficiency
- IOZIA AND LEITH MODEL
Iozia and Leith (1990) logistic model is a modified version of Barth (1956) model which is developed based on force balance. The model assumes that a particle carried by the vortex endures the influence of two forces: a centrifugal force, Z, and a flow resistance, W. Core length, zc, and core diameter, dc, are given as
`z_c=(H-S)-[(H-S)/((D/B)-1)][(d_c/B)-1]`
`z_c=H-S` for `d_c
`d_c=0.47((ab)/D^2)^-0.25(D_e/D)^1.4`
The collection efficiency hi of particle diameter dpi can be calculated from
`eta_i= 1/(1+(d_(pc)/(d_(pi)^(beta)))` where 'd_(pc)' is the 50% cut size given by Barth.
- LI AND WANG MODEL
The Li and Wang (1989) model includes particle bounce or re-entrainment and turbulent diffusion at the cyclone wall. A two-dimensional analytical expression of particle distribution in the cyclone is obtained. Li and Wang model was developed based on the following assumptions:
- The radial particle velocity and the radial concentration profile are not constant, for uncollected particles within the
- Boundary conditions with the consideration of turbulent diffusion coefficient and particle bounce re-entrainment on the cyclone wall are:
`c=c_(theta)` at 'theta'=0
`(delc)/(delr)=(1-alpha)wc' at r=D/2
concentration distribution in a cyclone is given as
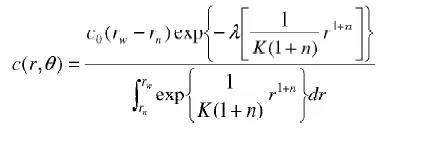
where
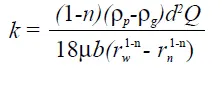
and
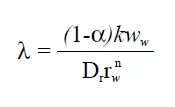
- KOCH AND LICHT MODEL
Koch and Licht (1977) collection theory recognized the inherently turbulent nature of cyclones and the distribution of gas residence times within the cyclone. Koch and Licht describe particle motion in the entry and collection regions with the additional following assumptions:
- The tangential velocity is related to the radius of cyclone by:The tangential velocity of a particle is equal to the tangential velocity of the gas flow
- there is no slip in the tangential direction between the particle and the given by uRn = constant.
A force balance and an equation on the particles collection yields the grade efficiency 'eta_p'
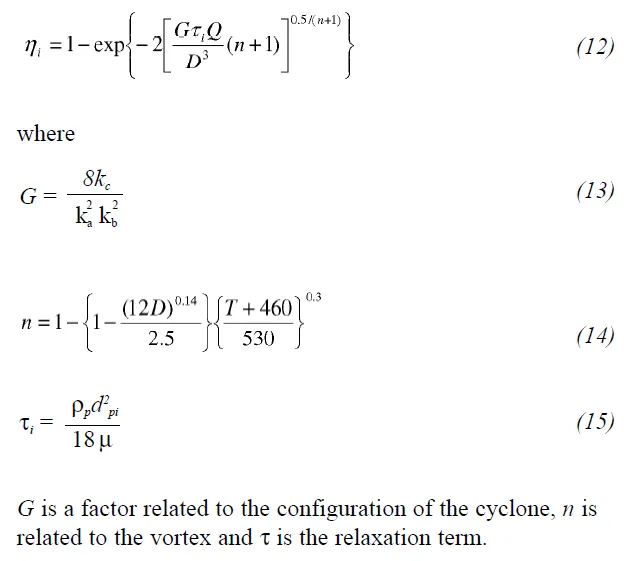
- LAPPLE MODEL
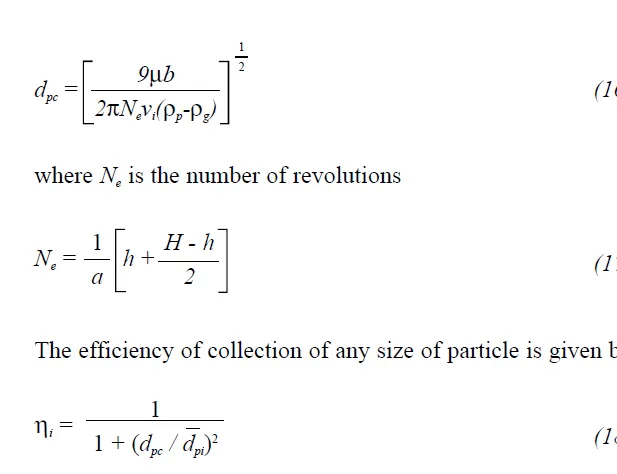
Lapple (1951) model was developed based on force balance without considering the flow resistance. Lapple assumed that a particle entering the cyclone is evenly distributed across the inlet opening. The particle that travels from inlet half width to the wall in the cyclone is collected with 50% efficiency. The semi empirical relationship developed by Lapple (1951) to calculate a 50% cut diameter, dpc, is
Calculating Pressure Drop and Efficiency
1) Pressure drop :-
DR= Ra Inlet - Ra Outlet-1
Where:-
DR= Cyclone Pressure Drop
Ra= Absolute Pressure
2) Separation Efficiency:-
`eta_s=`(Nos of Particle Trapped)/(Nos of Particles Tracked)
Steps followed for Simulation
1) Creation of Geometry:- THe first step followed was to extract the fluid volume
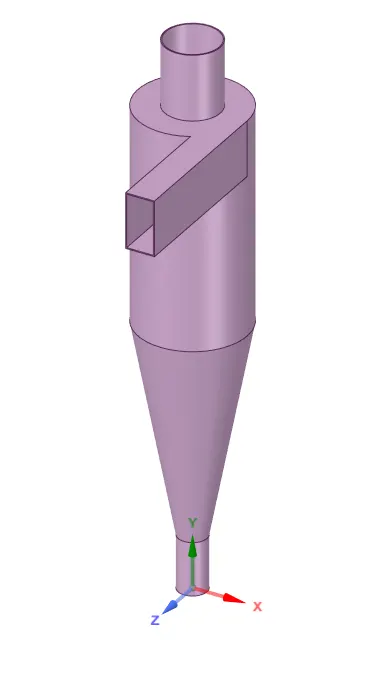
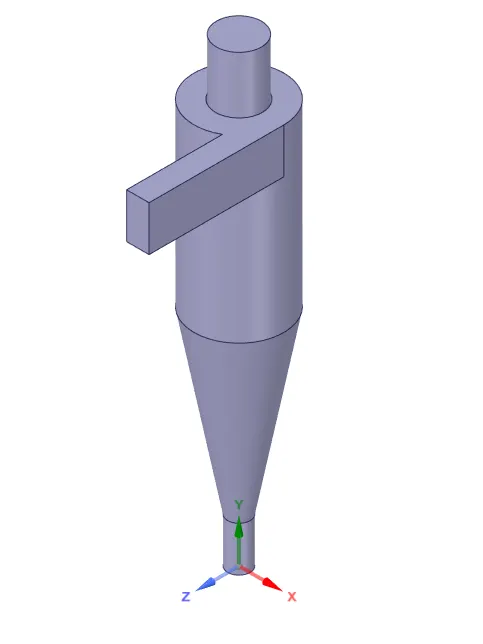
Original Volume Extracted Fluid Volume
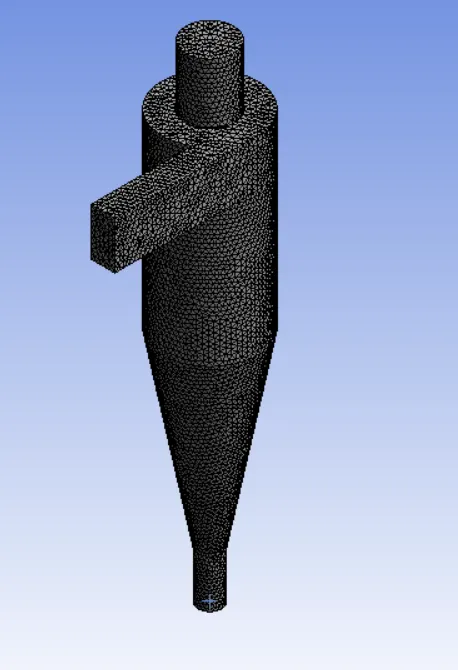
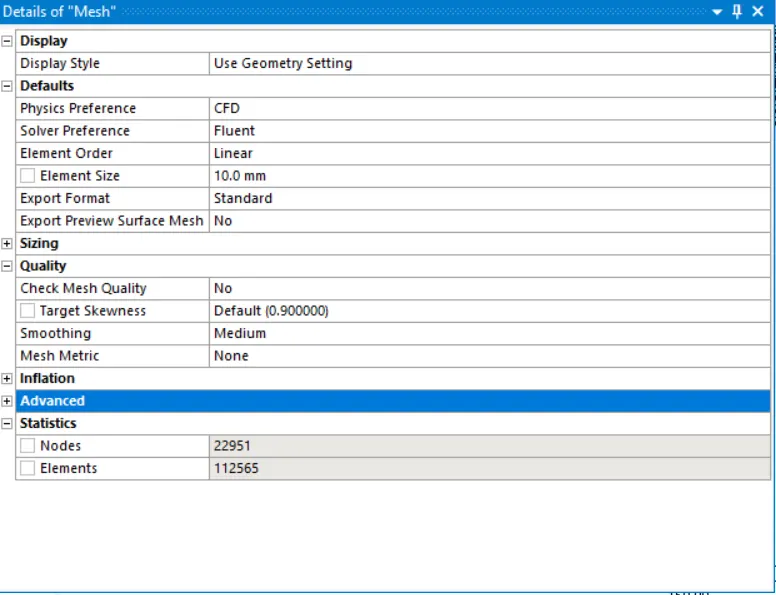
Meshing:- A tetrahedron mesh with element size of 10mm was chosen. It resulted in creation of Mesh with 22951 Nodes and 112565 elements.
Setup:-
1) Solver- Pressure Based
Time- Steady
Gravity- Enabled in the negative y direction (-9.81 m/s^2)
2) Turbulence Model- k-epsilon, RNG, Swirl Dominated Flow.
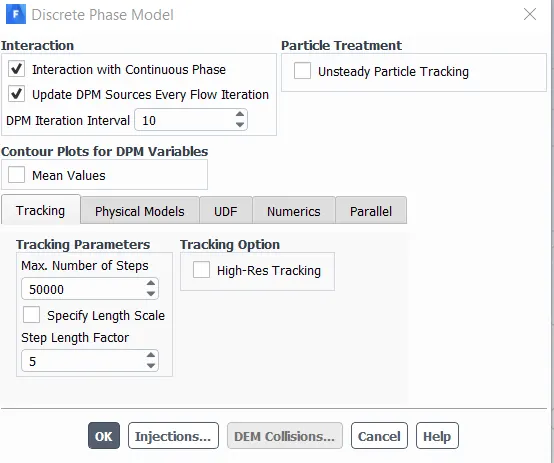
3) Discrete Phase Modelling- Interaction with Continuous Phase and Update DPM sources after every flow iteration selected
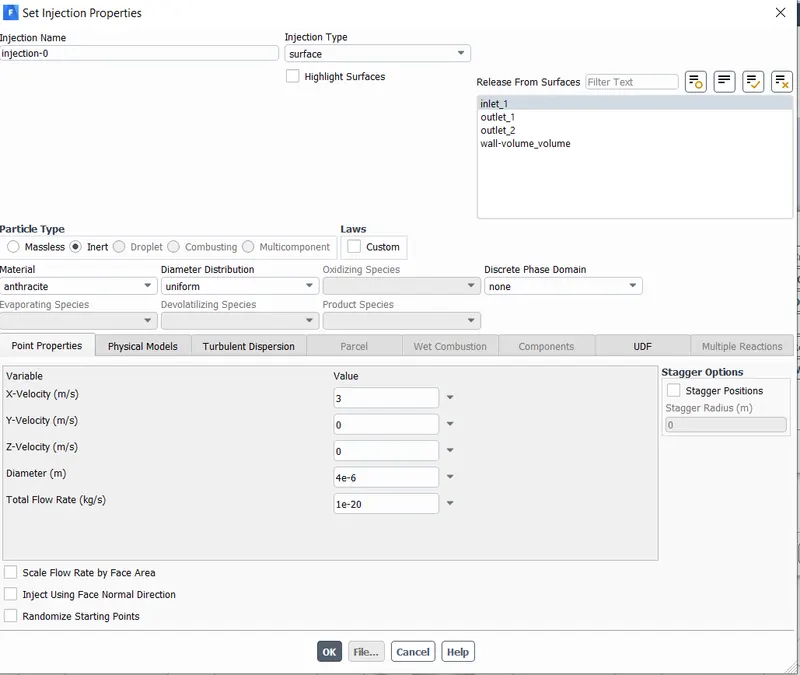
Set Injection Properties:- Properties set as below. Velocity and Particle size varied for each case.
Particle size varied for 1 to 5 micrometer. Velocity varied from 1 to 5m/s
Boundary condition:- Inlet :- Reflect
Outlet Top :- escape
Outlet Bottom:- Trap
Method :- Simple
Initialization:- Standard.
Analysis on a given cyclone separator model by varying the particle diameter from 1 μm to 5 μm and calculate the separation efficiency in each case.
The Simulation was performed with conditions mentioned in the Setup and it was run for 600 iterations. The flow and injection velocity was maintained at 3m/s. Once the solution converged, the particle history data was exported to CFD post. An animation was created to study the Anthracite Particle residence time in the cyclone separator.
- 5 micrometer
https://drive.google.com/drive/folders/1e7OVAwZKZFTrB_iD40HP3cOjw_tN1Pox?usp=sharing
- 4 micrometer
https://drive.google.com/drive/folders/177BuZ02qeK_TzsMG3UV8rcMEjeT0WhNr?usp=sharing
-3 micrometer
https://drive.google.com/drive/folders/1vz0FR6oYZd7KY6AQu9YdH6HinZQy5DwK?usp=sharing
-2 micrometer
https://drive.google.com/drive/folders/1EbsZkjgNtnZvgRqGaJzSctjX7Pp8B-tS?usp=sharing
-1 micrometer
https://drive.google.com/drive/folders/12sx7YFYMP3w7Csw0NvxTk0qeqWaMfYQb?usp=sharing
From the console output the results the were noted
| Particle Size | no tracked | escaped | trapped | incomplete | Separation Efficiency |
| 5 | 124 | 0 | 124 | 0 | 100.00% |
| 4 | 124 | 8 | 116 | 0 | 93.55% |
| 3 | 124 | 19 | 105 | 0 | 84.68% |
| 2 | 124 | 22 | 96 | 6 | 77.42% |
| 1 | 124 | 24 | 41 | 59 | 33.06% |
Summary of results
From the above table we note that as the particle diameter increases, the separation efficiency also increases.As the diameterof particle increases, the centrifugal force increases, and as the inertia force and gravity force can be enhanced at
the same density. he turbulence dispersion caused by the turbulent fluctuations of the fluid phase has significant effect on the trajectory of smaller particle. the possibility for bigger particle to move to the wall of the cyclone separator and then move down the dust outlet becomes larger. The separation efficiency increases as the diameter of the particle increases
To perform an analysis on a given cyclone separator model by varying the particle velocity from 1 m/sec to 5 m/sec and calculate the separation efficiency and pressure drop in each case. Discuss the results. [Use particle diameter size as 5 μm for all cases & keep flow velocity same as particle velocity
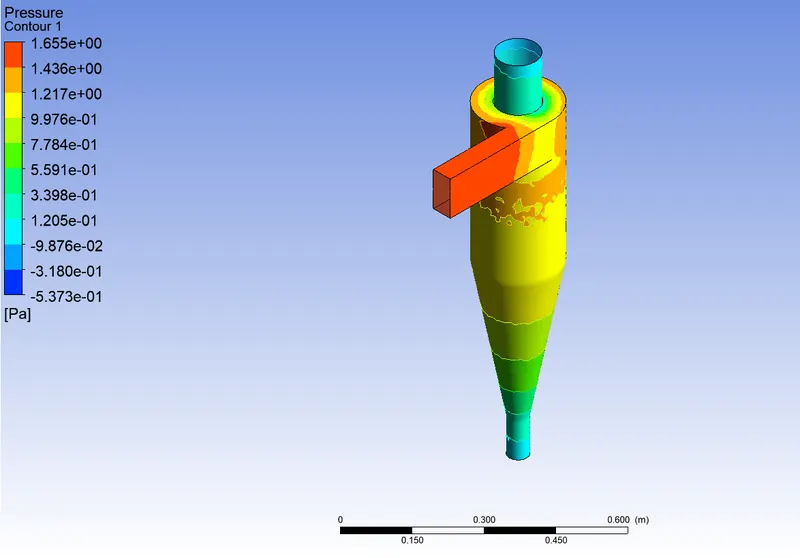
The Simulation was performed with conditions mentioned in the Setup and it was run for 600 iterations. The Particle size set to 5 micrometer. Once the solution converged, the particle history data was exported to CFD post. An animation was created to study the Anthracite Particle residence time in the cyclone separator. Also contour plots of Pressure were created.
- Inlet Velocity 1m/s
Plots for Pressure Drop
- Anthracite Particle Time
https://drive.google.com/drive/folders/17HM7MQUzdDGFZm0R3MZ6AgCi6Gb3B7bO?usp=sharing
- Inlet Velocity 2m/s
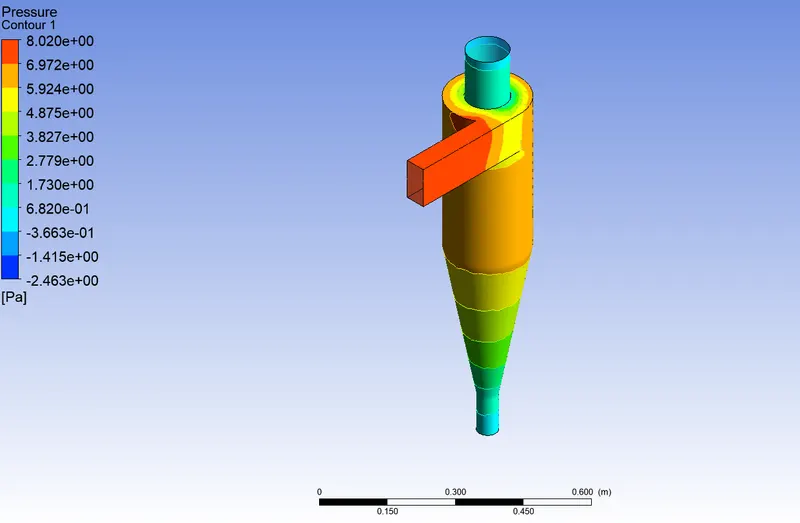
https://drive.google.com/drive/folders/12SK9j6C2qQoS5I-WXhL1FgMoOjFtwfTJ?usp=sharing
- Inlet Velocity 3m/s
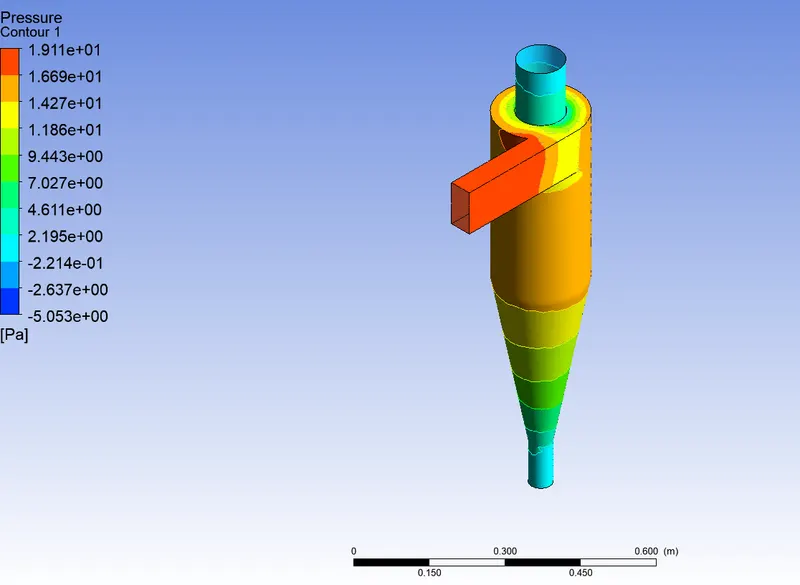
https://drive.google.com/drive/folders/1Roa0fU4JqpcMcQFrnOzQkULPObA5hdvH?usp=sharing
- Inlet Velocity 4m/s
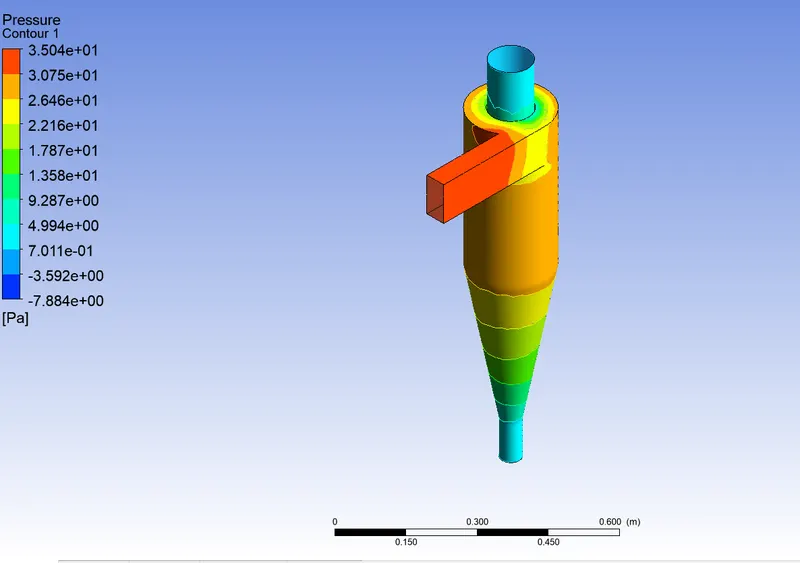
https://drive.google.com/drive/folders/1NXbFMmhintJNLfcga8-SB4zn-SOp22dH?usp=sharing
- Inlet Velocity 5m/s
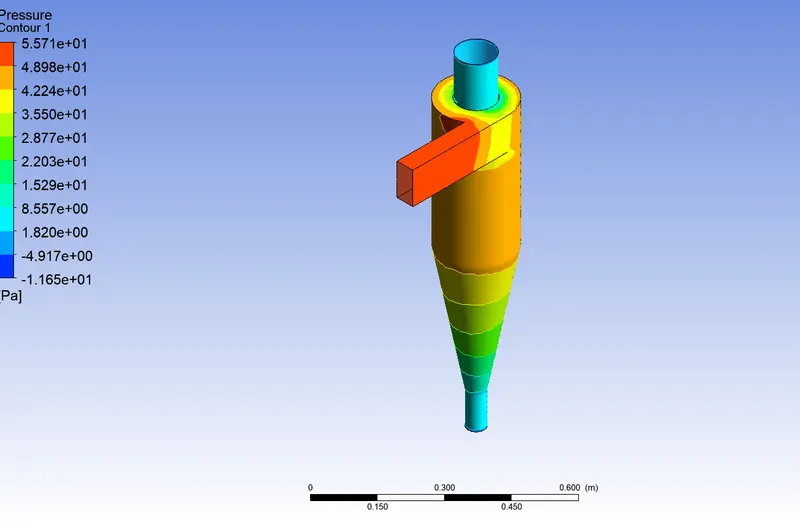
https://drive.google.com/drive/folders/1khKz3wWwzjLT9qNPOJiyHOz_I_yNhHuY?usp=sharing
Summary of results
| Particle Velocity (m/s) | no tracked | escaped | trapped | incomplete | Separation Efficiency | Pressure Drop (Max- Min pressure from Contour Plot) (Pa) |
| 1 | 124 | 5 | 10 | 109 | 8.06% | 7.028 |
| 2 | 124 | 6 | 13 | 105 | 10.48% | 10.483 |
| 3 | 124 | 0 | 124 | 0 | 100.00% | 24.163 |
| 4 | 124 | 0 | 124 | 0 | 100.00% | 42.92 |
| 5 | 124 | 0 | 124 | 0 | 100.00% | 67.36 |
Separation efficiency increases with increasing inlet velocity. Higher the inlet velocity, higher is the tangential velocity.The tangential velocity directly determines the strengthof the centrifugal force field.
From the plots of pressure we observe that the pressure is axisymmetrically distributed with its highest value at the wall surface, and gradually decreases from the wall toward the axial center with decreasing radius