State of charge Estimation
Tasks
1.Simulate the 3 test cases from the harness dashboard of the BMS project model and write a detailed report on the results
2.What is coulomb counting? Refer to the above model and explain how BMS implements coulomb counting for SOC estimation?
Task 1
Simulate the 3 test cases from the harness dashboard of the BMS project model and write a detailed report on the results
Lithium-ion battery packs are widely used energy storage systems in electric vehicles. The battery management system (BMS) is responsible for safe operation, performance, and battery life under diverse charge-discharge and environmental conditions. When designing a BMS the cell voltage and temperature, state of charge, state of health and the charging profile has to be controlled and maintained.
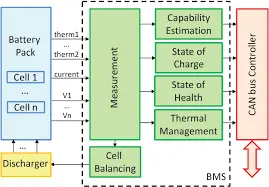
Also, it indicates whether there has been a fault, for example, that any cell has reached an over-temperature condition or under-voltage condition (Under-voltage occurs when the average voltage of a system drops below intended levels. It is usually caused by undersized or overloaded utility).
This article will help you to get an insight into the BMS model and it also discusses the various subsystems used here. We will also see how the faults parameters can be indicated with the help of the BMS closed loop using SIMULINK.
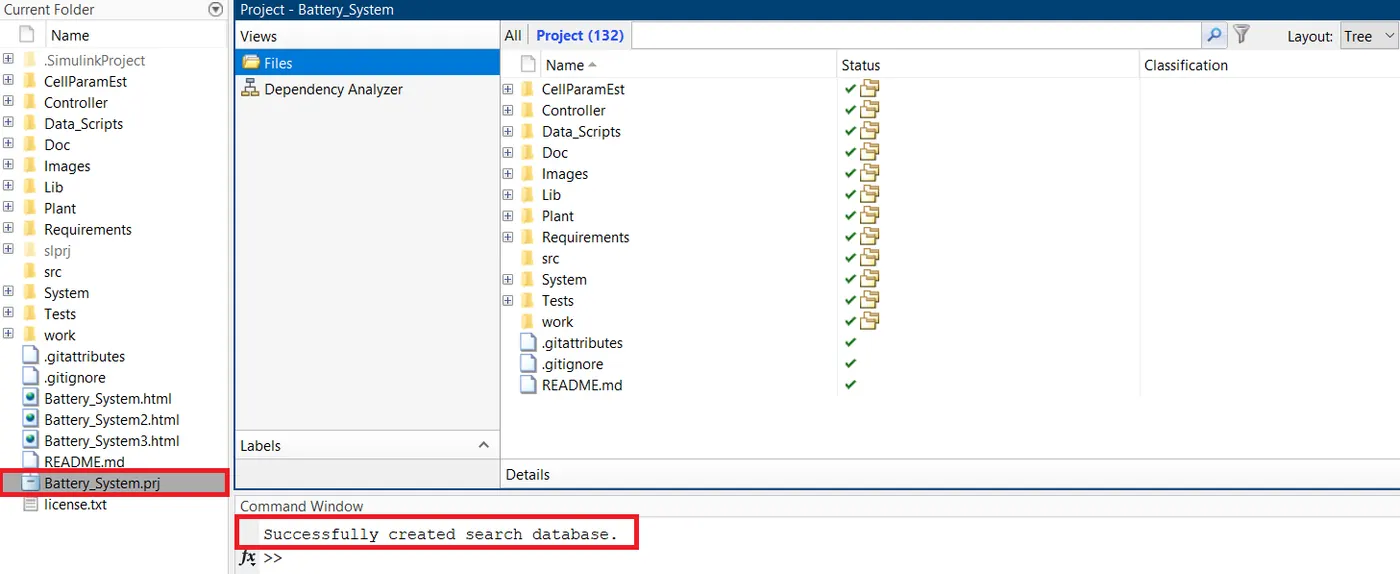
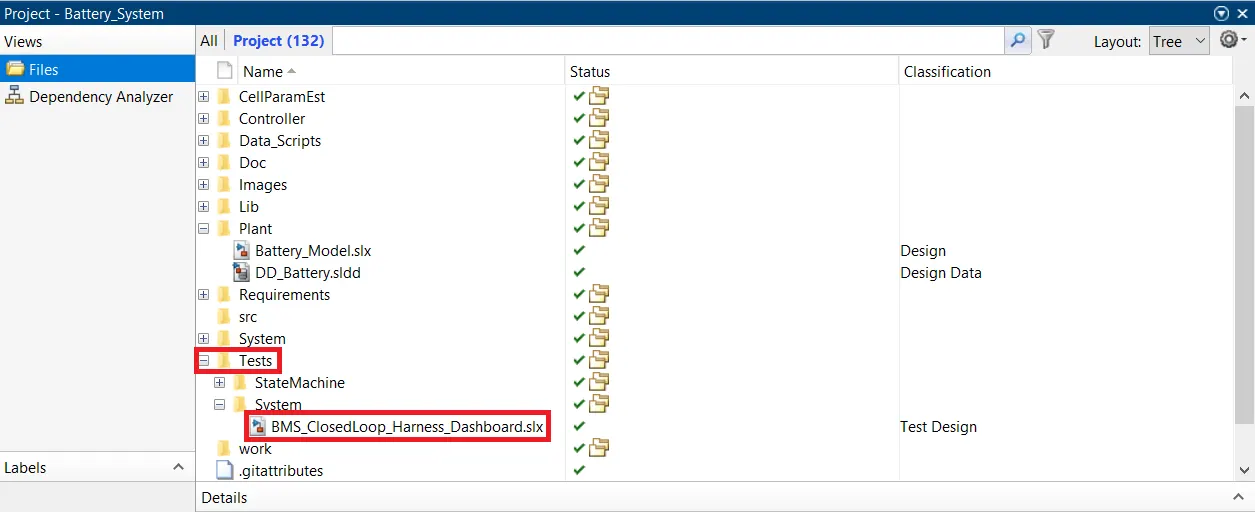
- The above image shows there are certain errors. To remove these errors, we have to open the model from the correct source. For this, click on Battery_System.prj and make sure that all the files have a green tick indicating that the BMS model is ready to start without any interruptions. The command line shows the message “Successfully created search database” which means that the system has no errors.
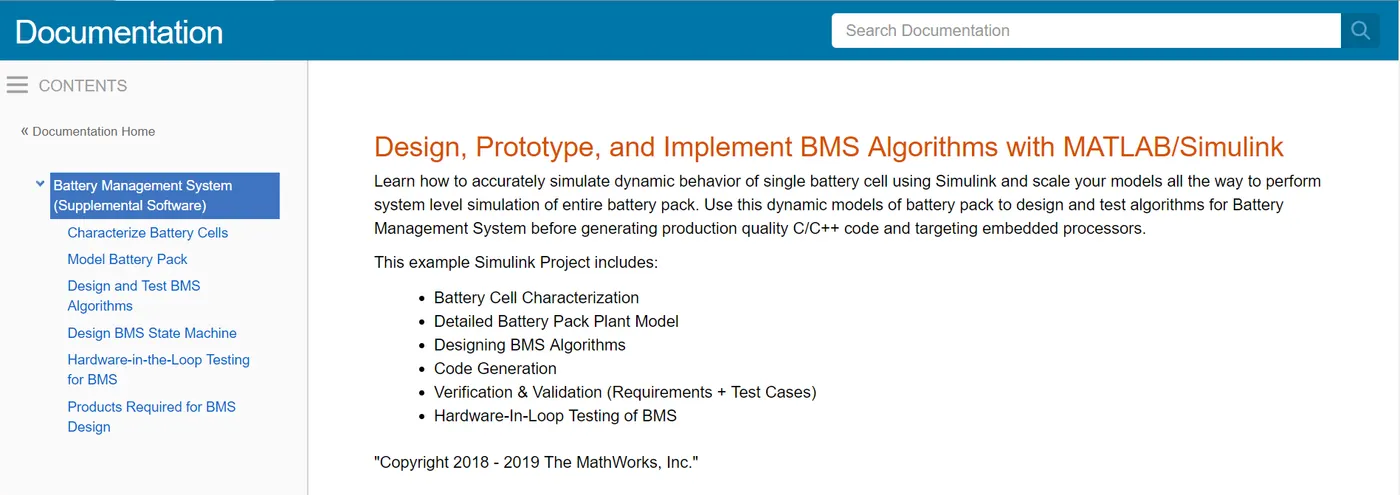
The following documentation opens up.
Click on the Design and Test BMS Algorithms option.
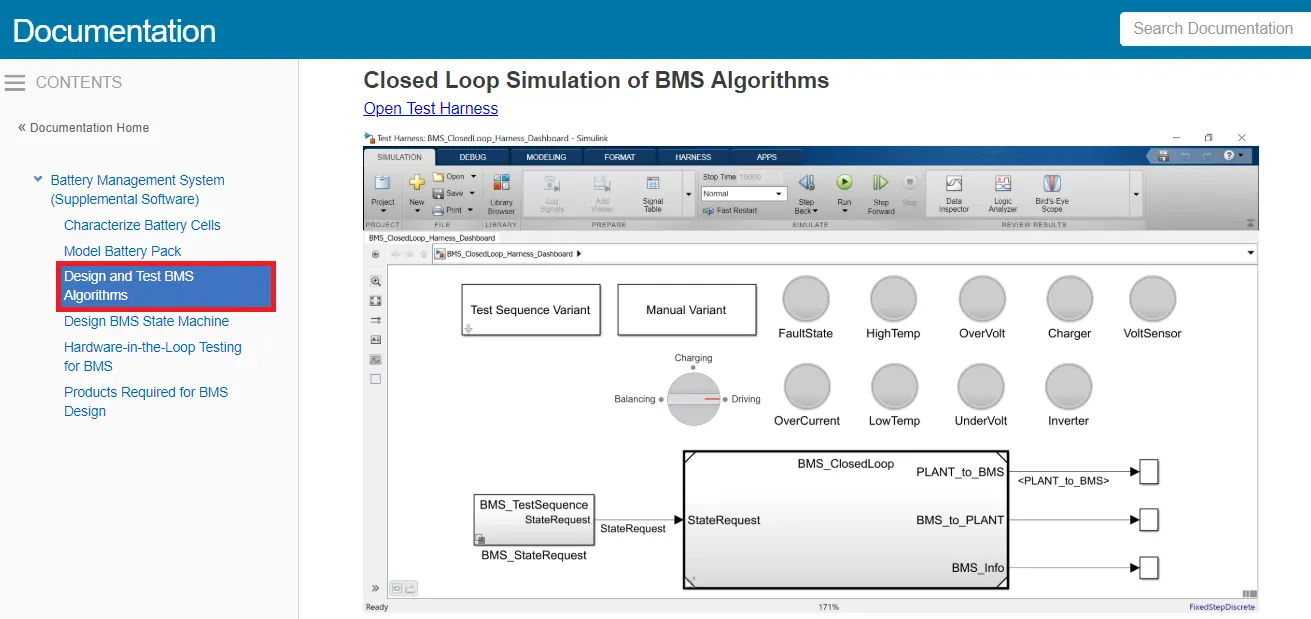
Now we have to open the BMS system and the closed-loop harness dashboard. So, we go back to the MATLAB window and select the BMS System and open the subsystem.
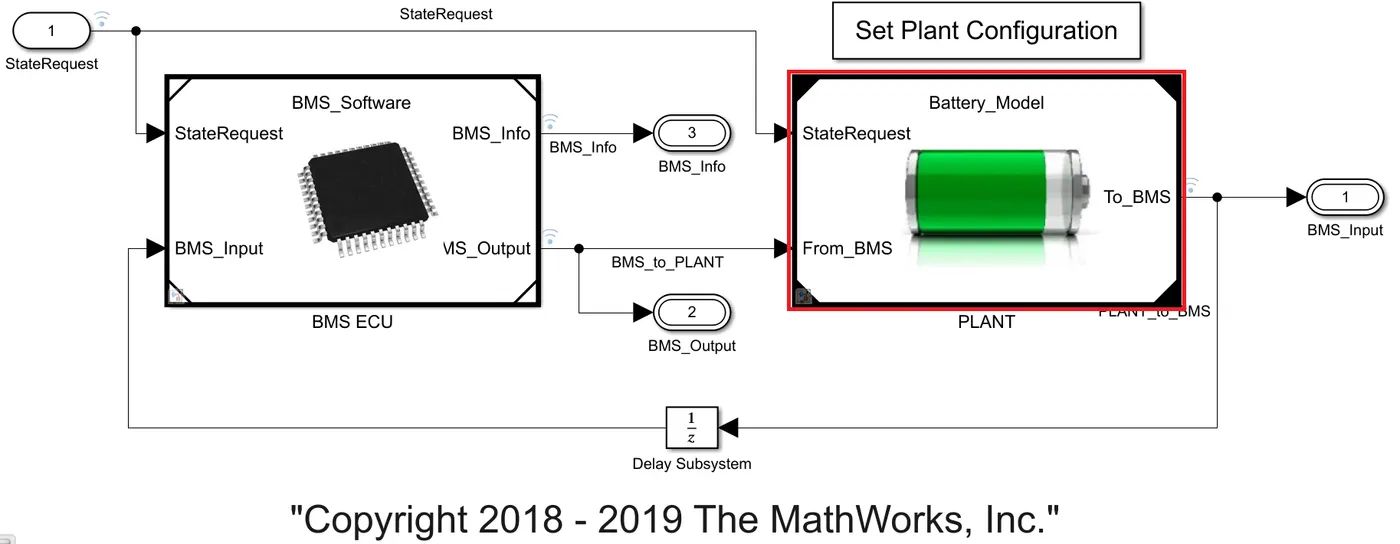
The BMS model consists of a BMS ECU (electrical control unit) and a plant. The control unit with its various monitoring and control algorithms is connected to a block with the representation of the battery pack and associated circuitry and peripherals. This model contains two versions of the battery pack: a small one with just 6 cell series, and a larger 16-module pack, each module containing a 6-cell series string. The architecture is 6s-1p and 96s-1p packs, respectively.
When you click on the BMS ECU, its subsystem opens. Now, click on the state machine.
State Machine defines the main operating state of the BMS. The state machine has four parallel states (parallel meaning that they can be active at the same time):
a.) The first one defines the variable BMS_State which indicates standby, driving, charging, and fault. Charging comprises constant current and constant voltage stages.
b.) The second state switches the fault state ON in case a current, voltage, or temperature value reaches an unsafe level.
c.) The third and fourth states define the contactor ON and OFF switching sequence for the charger and inverter. This is needed to avoid an excessively large current inrush at the beginning of the charging stage.
After opening the BMS system we have to go for the harness dashboard. This dashboard can be selected from the MATLAB window following the procedure shown below.
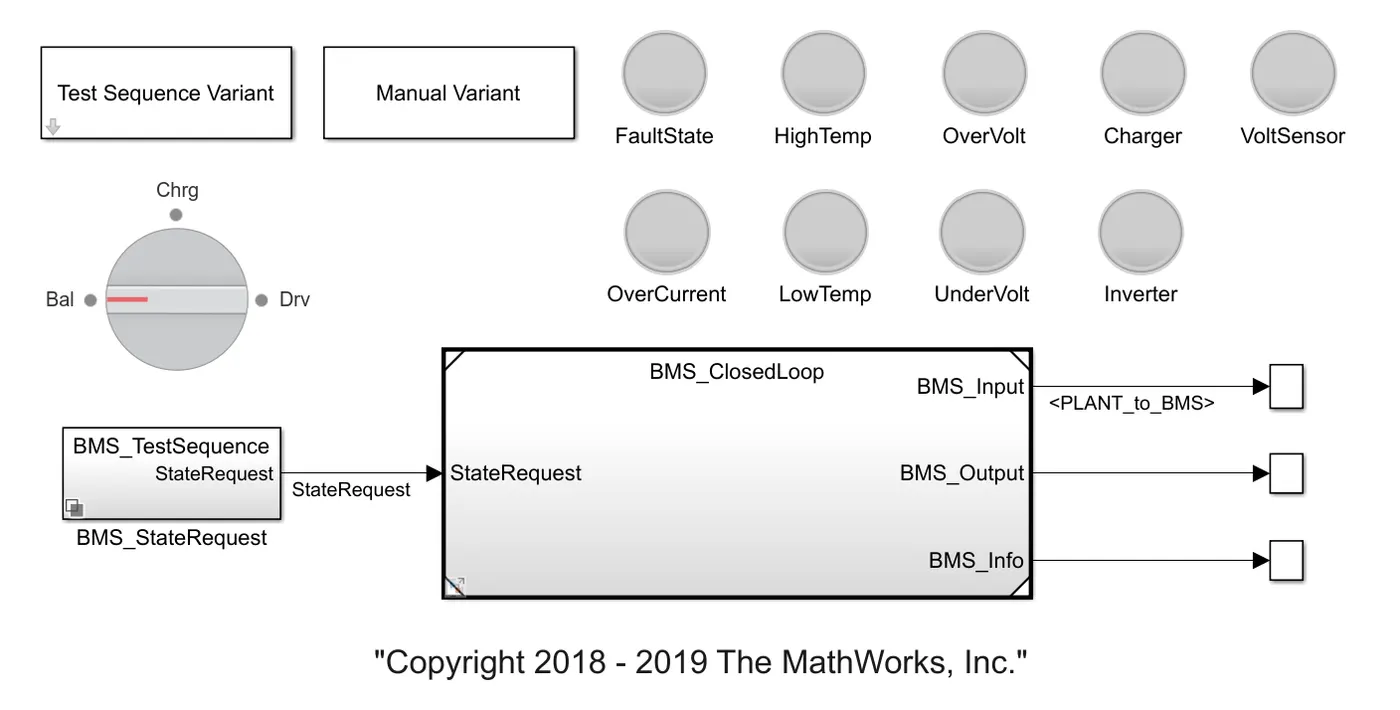
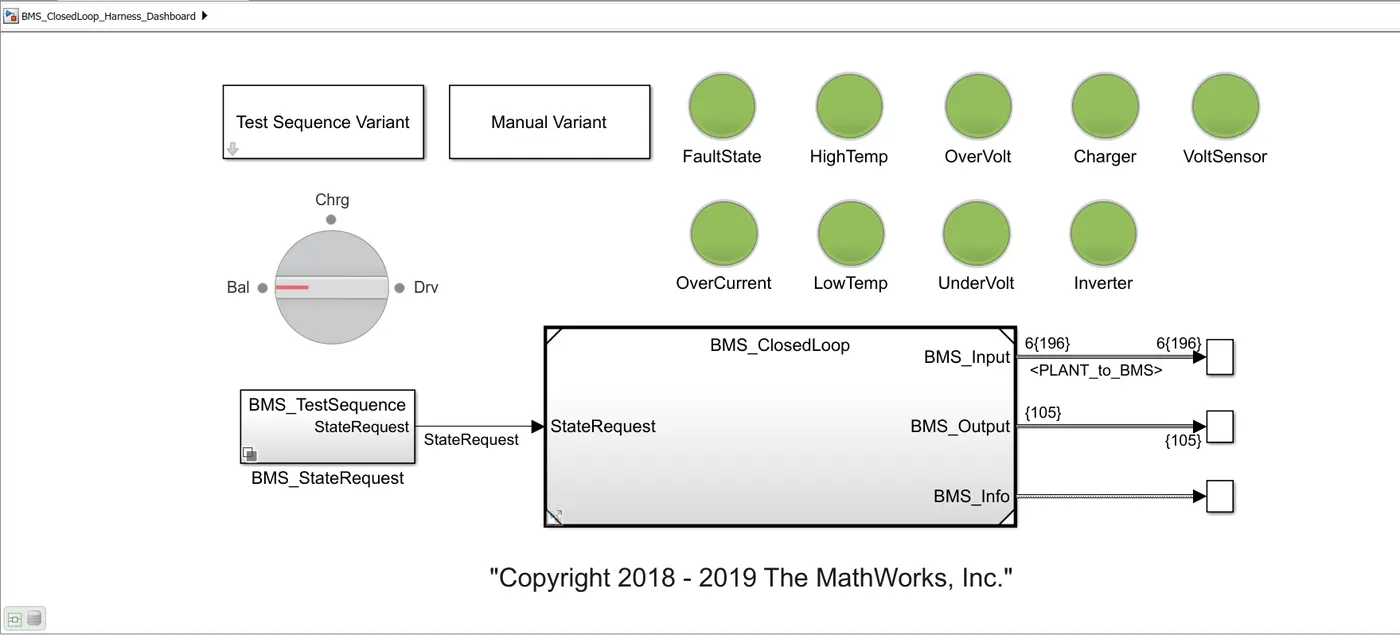
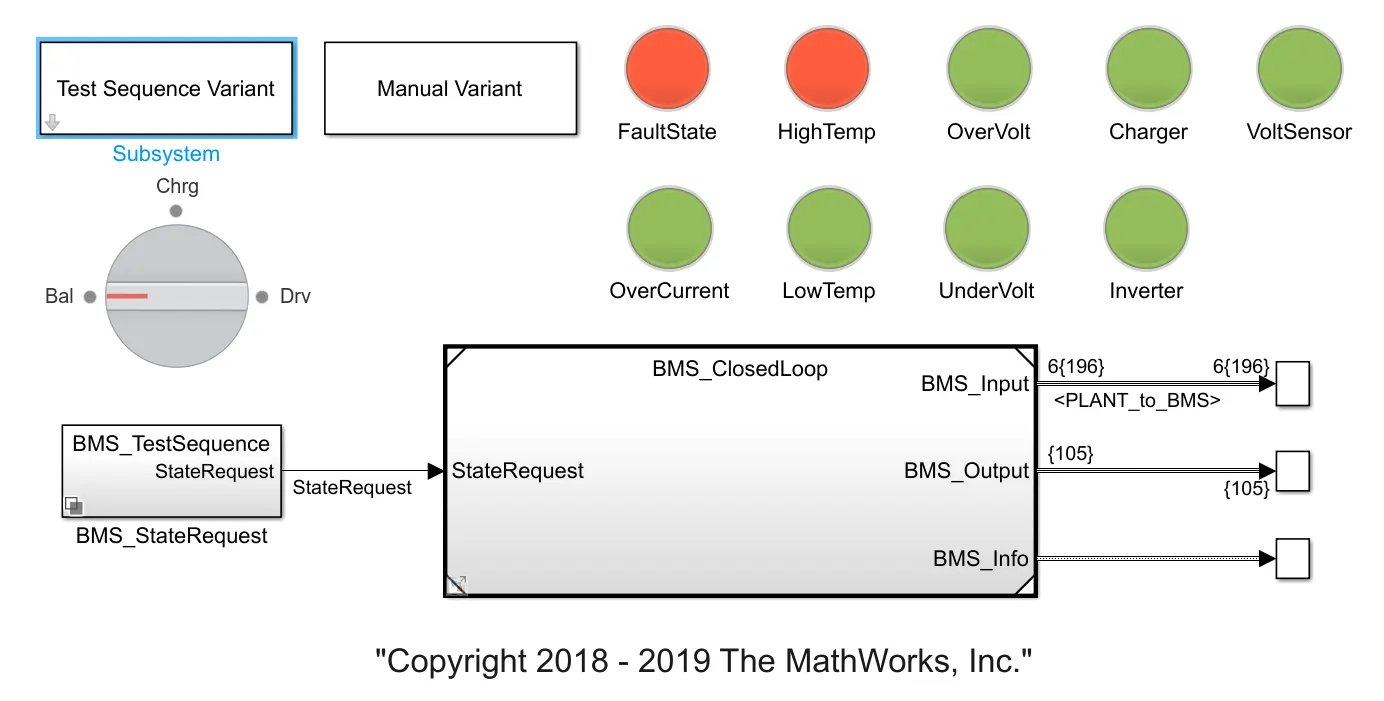
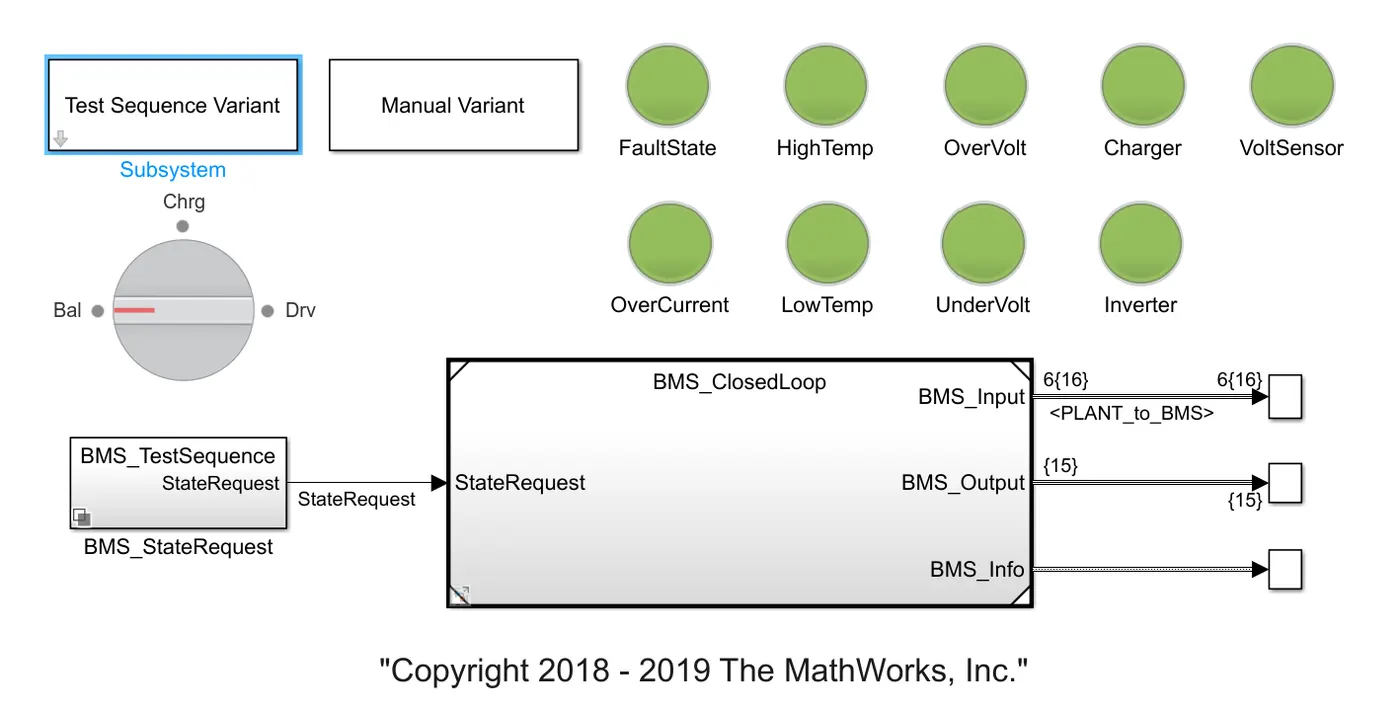
The harness dashboard is shown below. It consists of the test sequence variant subsystem which holda three different test cases. This dashboard also helps in determining the fault states and other parameters as shown in the diagram below. The green colour indicates that the system is working without any errors while the red signal will indicate that there is a fault in the system.
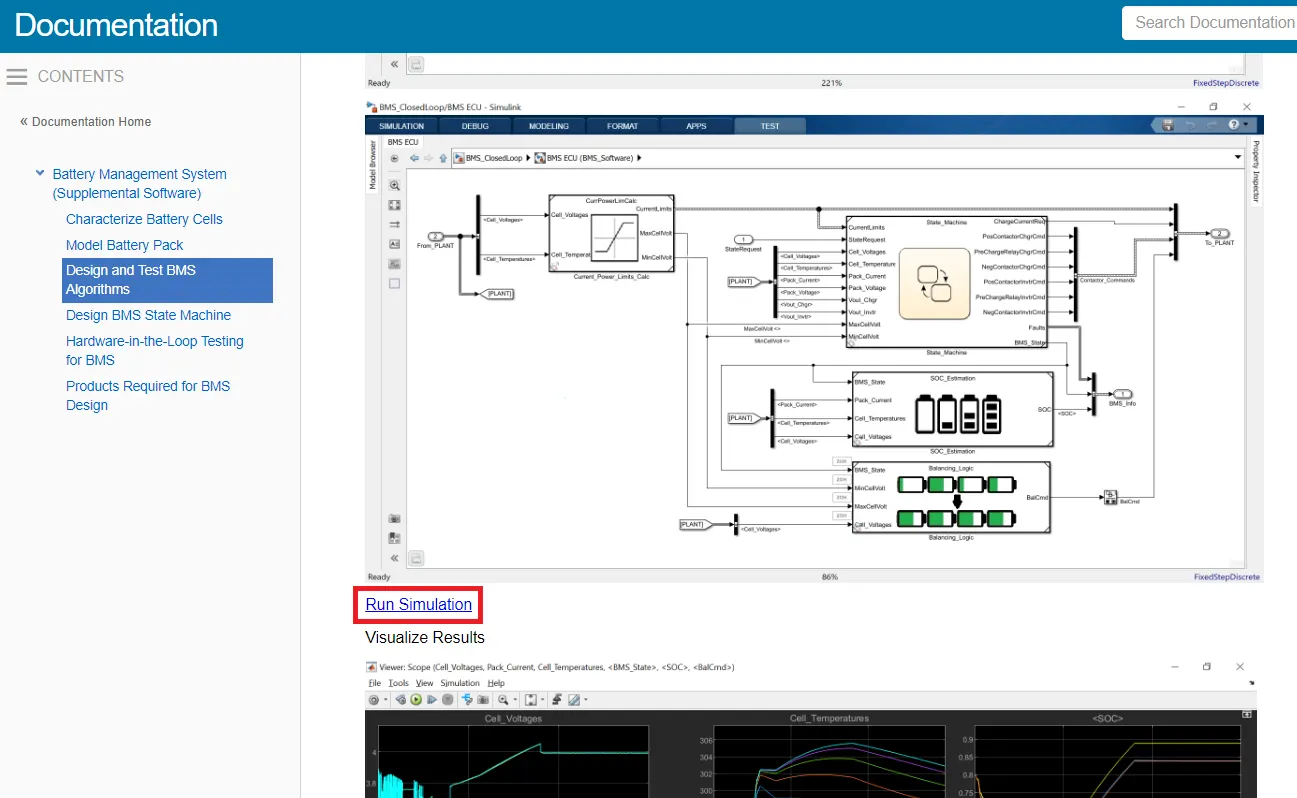
The next step is to go back to the documentation and click on "Run Simulation". This is done to avoid errors while running the model.
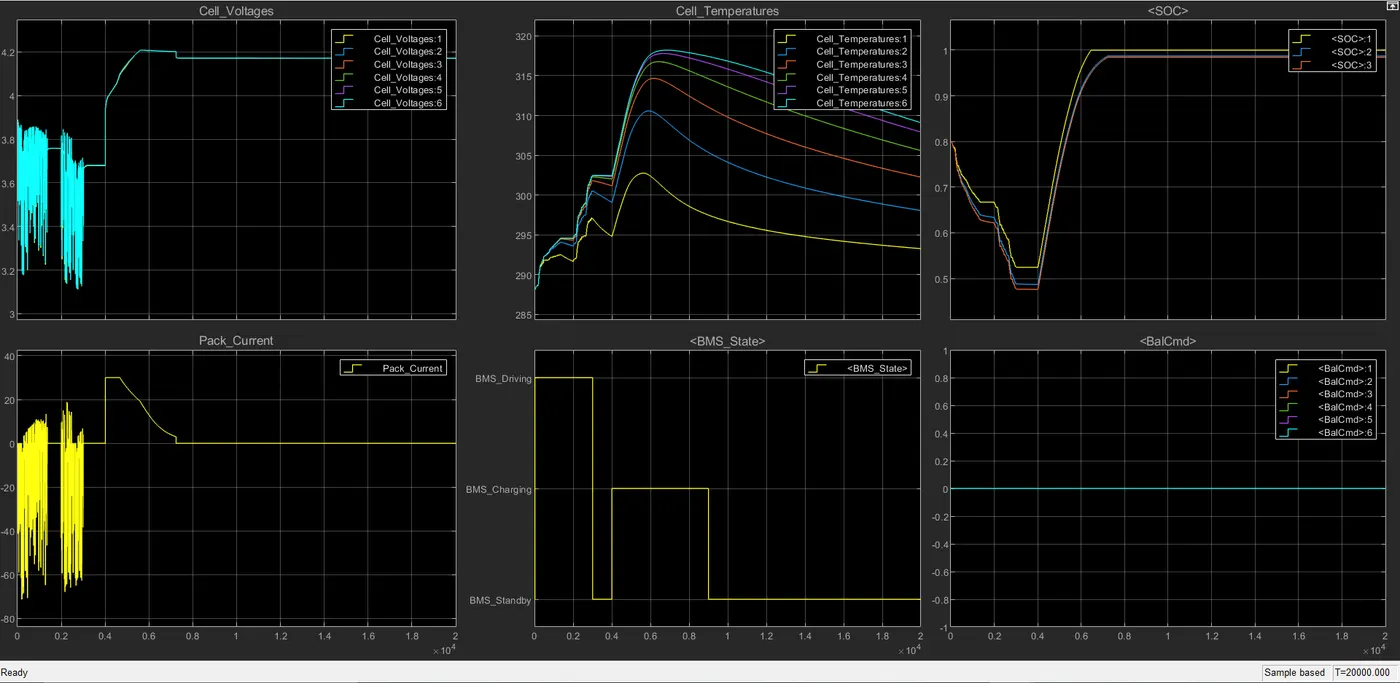
After the compilation is successful the scope opens up. The scope consists of the measurements of cell voltages, cell temperatures, SOC, pack current, BMS State.
To check the faults in the system we have to go back to the harness dashboard. Here, in the first compilation the test case 1 is selected.
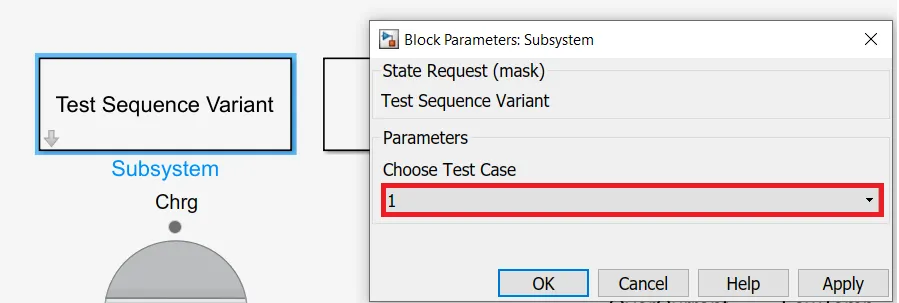
After applying the selected test case, we have to run the simulation. The dashboard shows there are no errors and faults.
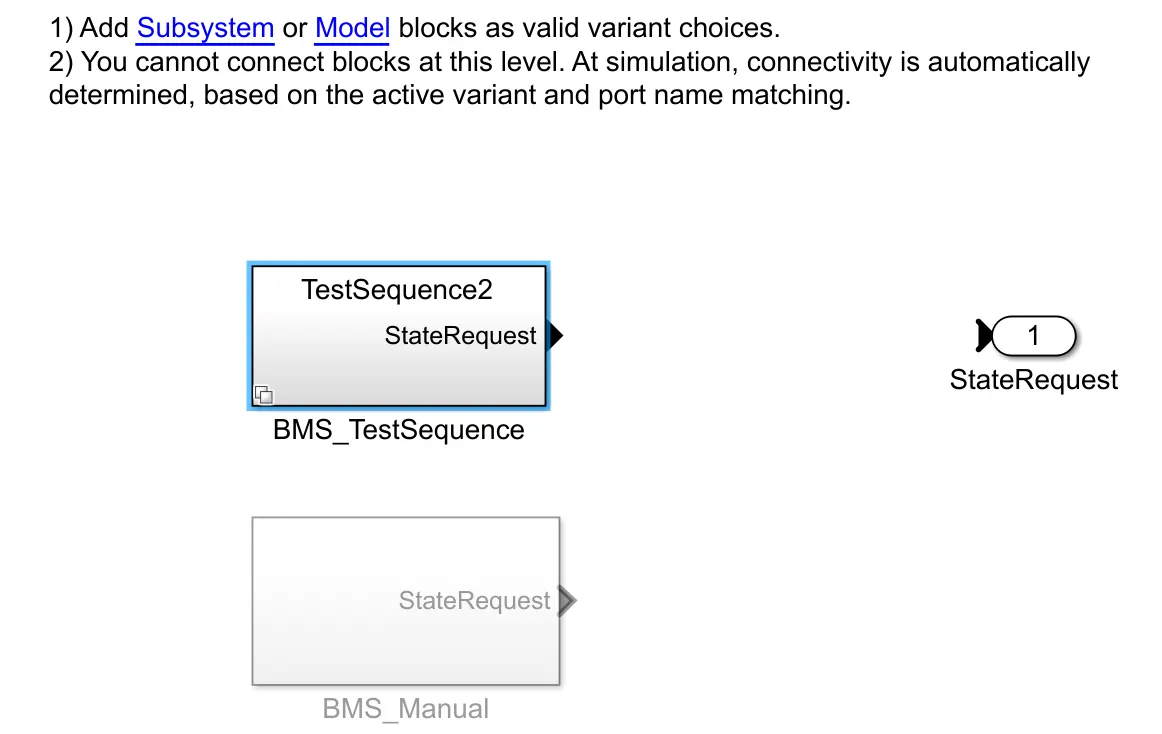
If we click on the "BMS_StateRequest" the following system opens up. Now we have to select "BMS_TestSequence".
Selecting the first test sequence we can check the conditions for this particular condition.
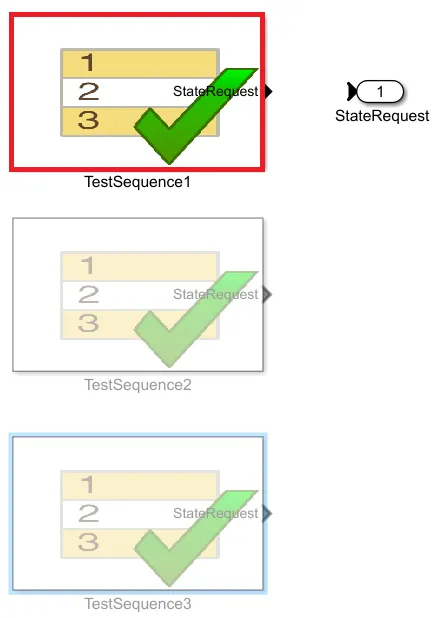
There are three stages of driving condition, namely-
- Driving
- Charging
- Standby
When the simulation begins, initially the vehicle is in a driving state and the SOC will decrease for this time period. After a time period of 3000 seconds, the next step is balancing mode and the vehicle is in standby condition. After another 1000 seconds, the vehicle is in the charging phase and the battery's SOC increases almost to 100%. The next phase is the post charging phase in which the vehicle again goes for the standby mode.

The scope shows the following results for test case 1.
From the scope results, we can define note the following points.
- The input cycle can be seen in the BMS_State plot in which the vehicle initially undergoes driving, then charging till SOC= 90% and then later in the standby state.
- During Charging the Battery pack voltage is increased up to 4.2V.
- The cell temperature increases during the driving and charging cycle and starts falling off in standby mode.
- The SOC drops to less than 50% after the driving cycle and then later put into charging until SOC Reaches 100%.
- The current supplied to the EV during the driving phase can be seen in the current plot.
Now, we will go for the second test case. For this, we have to go to the test case variant subsystem and select test case 2 from there and click on "Ok". Then we have to run the system for the given simulation time. The result shows that there is a fault condition in the vehicle. The dashboard on the model depicts the same with a red colour indication.
If we click on the "BMS_StateRequest" the following system opens up. Now we have to select "BMS_TestSequence".
Selecting the second test sequence we can check the conditions for this particular condition.
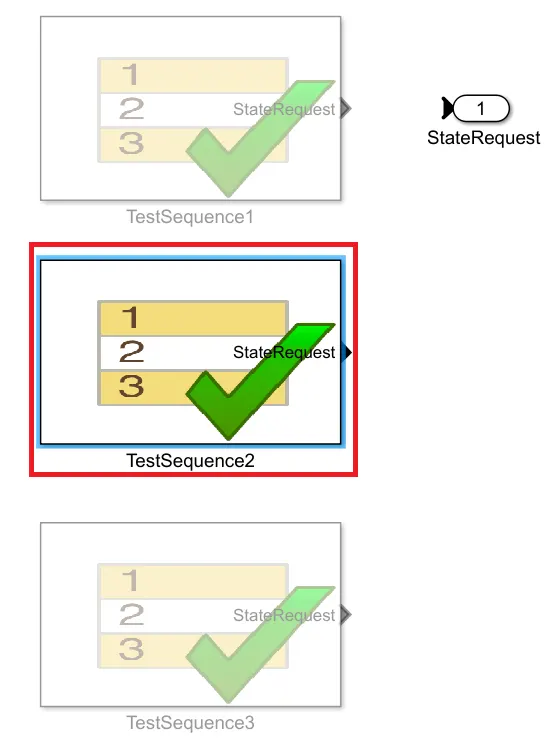
This test case has two Phases for the battery pack, i.e., the Driving and Charging phases.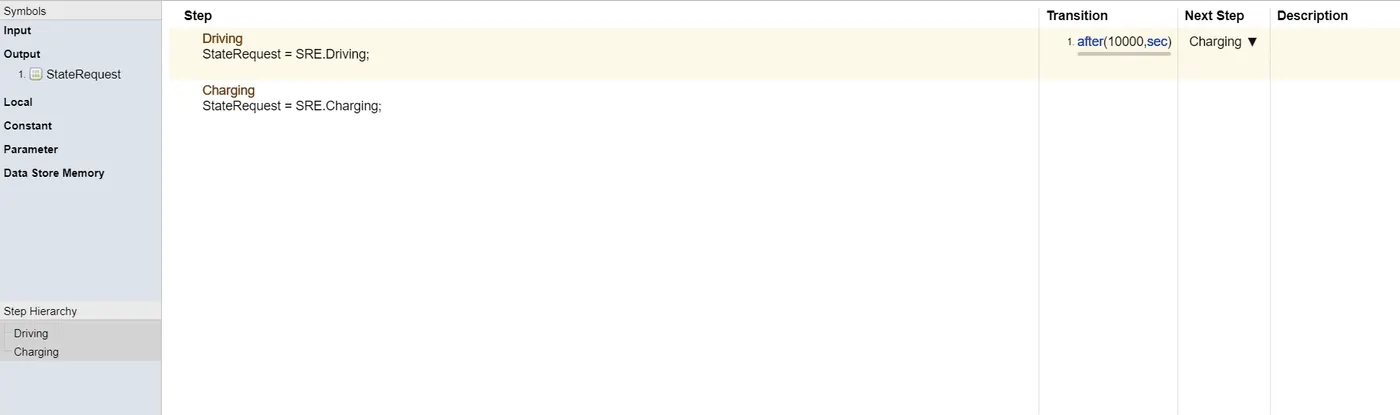
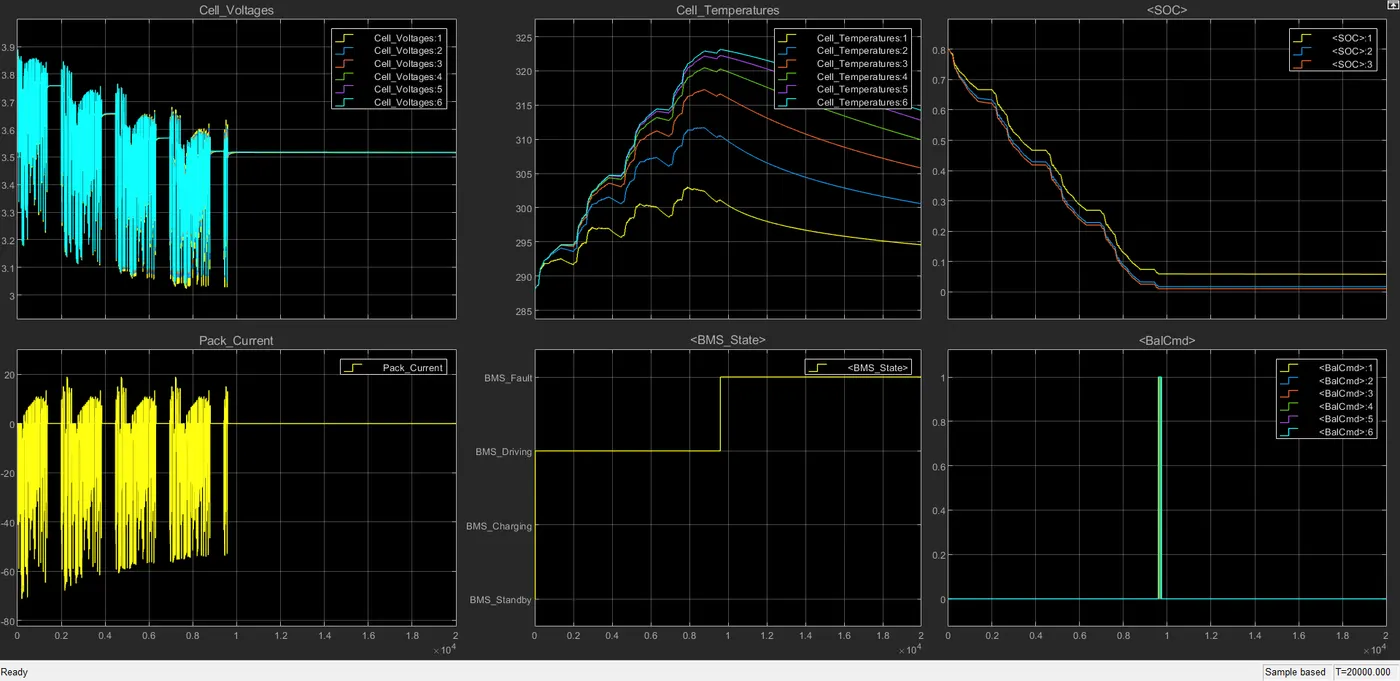
The scope shows the various parameters for the BMS model under the second test case. After 10,000 sec when the driving cycle is over, the fault condition occurs and so the SOC does not increase even for the charging phase.
The last test is for the third test sequence. For this, we have to go to the test case variant subsystem and select test case 3 from there and click on "Ok".
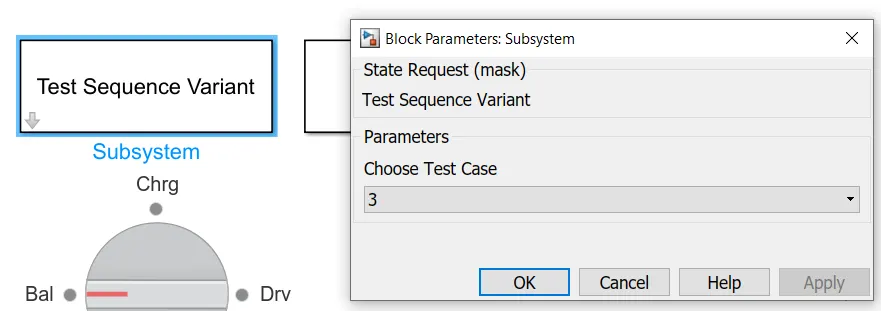
After applying the selected test case, we have to run the simulation. The dashboard shows there are no errors and faults.
If we click on the "BMS_StateRequest" the following system opens up. Now we have to select "BMS_TestSequence".
Selecting the third test sequence we can check the conditions for this particular condition.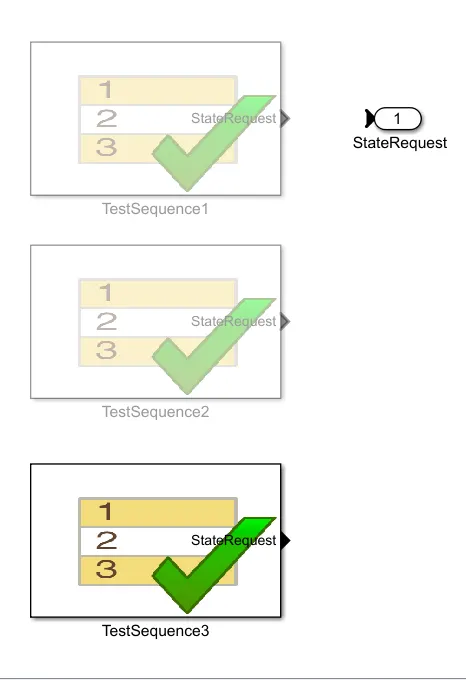
There is only a single phase here for the third test case, i.e. the charging phase.

The scope shows the results for the third test case. Here the SOC increases from 80 to 100% and then remains in standby mode.
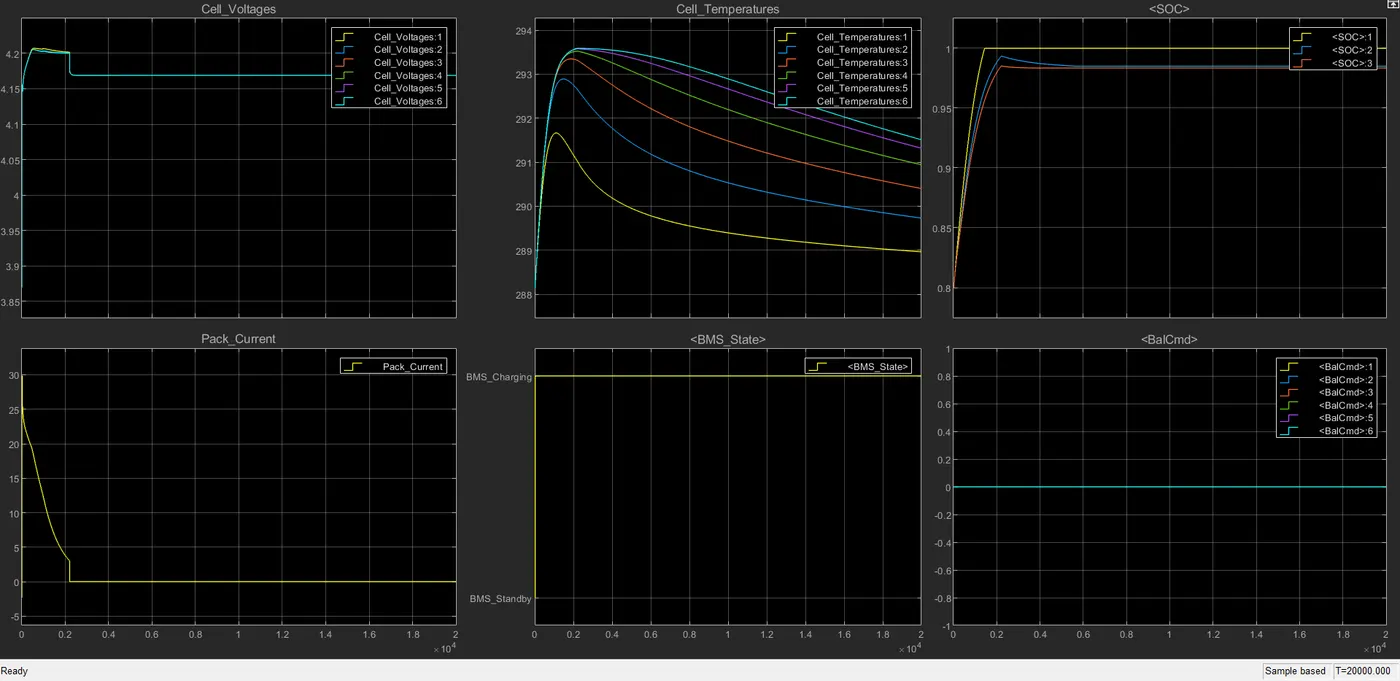
Following these steps, the BMS model can be implemented to check the faults and errors using the three different test cases from the harness dashboard.
Note- The model has a combination of two sets of the battery pack, one is for 16 cells and the other is for 6 cells. With a lesser number of cells, the simulation takes less time. This can be selected following the steps discussed below-
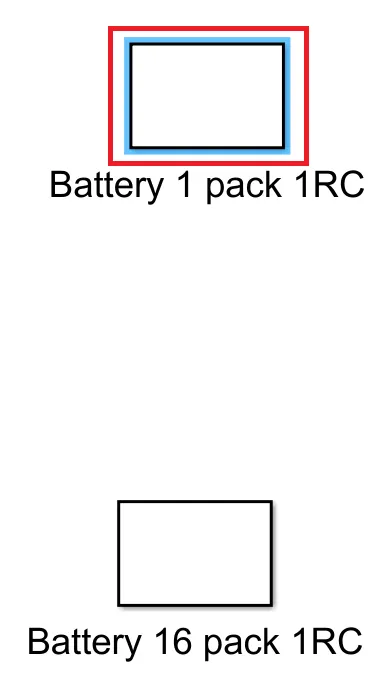
- From the Plant section select "Set Plant Configuration".
- The following system opens up. Double click on "Battery 1 pack 1RC" to activate the 6 cells battery pack. The other option "Battery 16 pack 1RC" will activate the 16 cells connection.
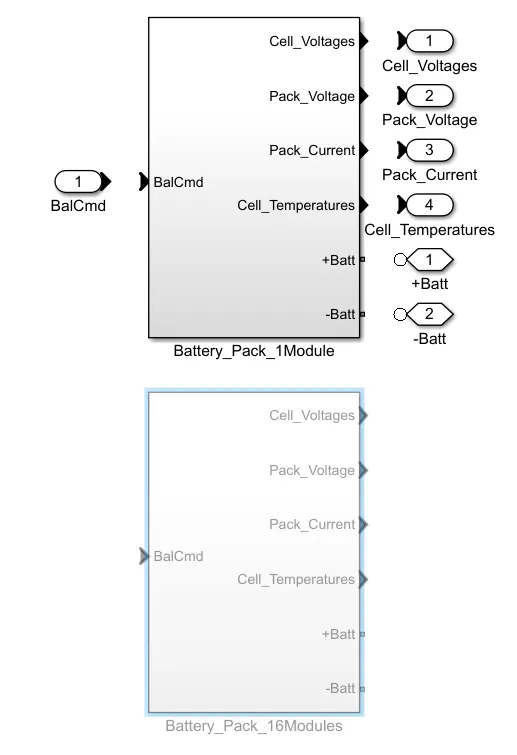
- This can be cross verified from the Plant----Battery_Pack option. This shows that the 6 cells module has been selected.
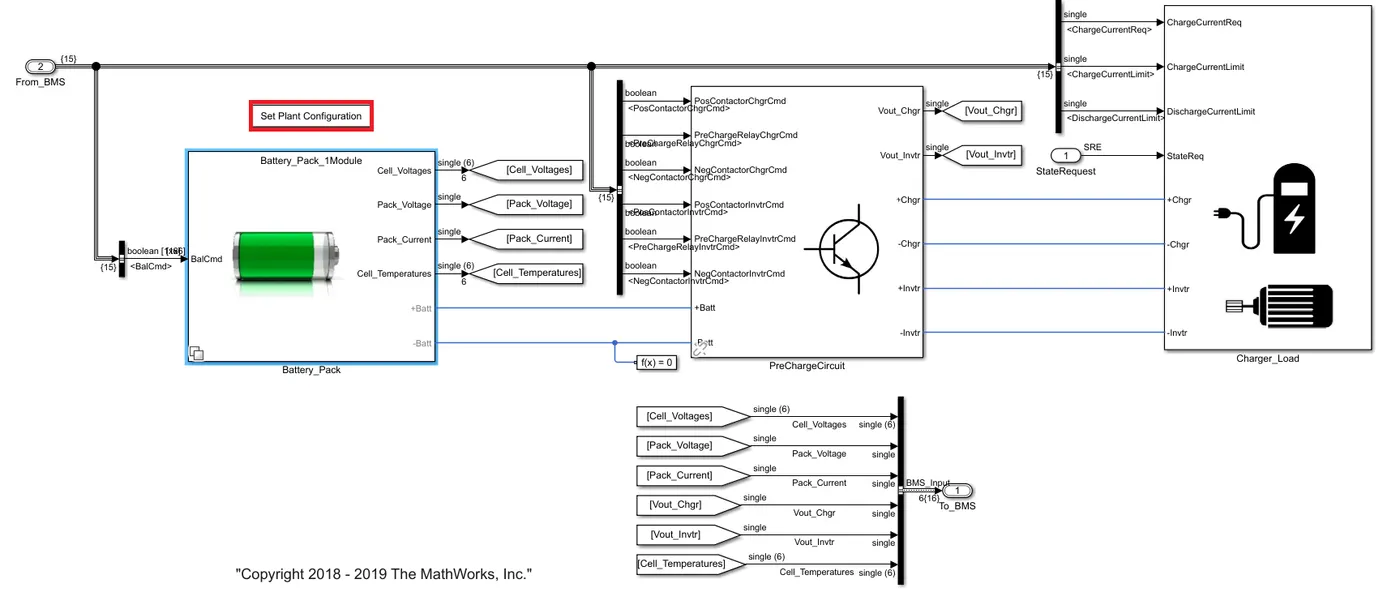
Steps to be followed on how to open linked library files for charger load block-
- Double click on the plant subsystem.
- Open the charger load system.
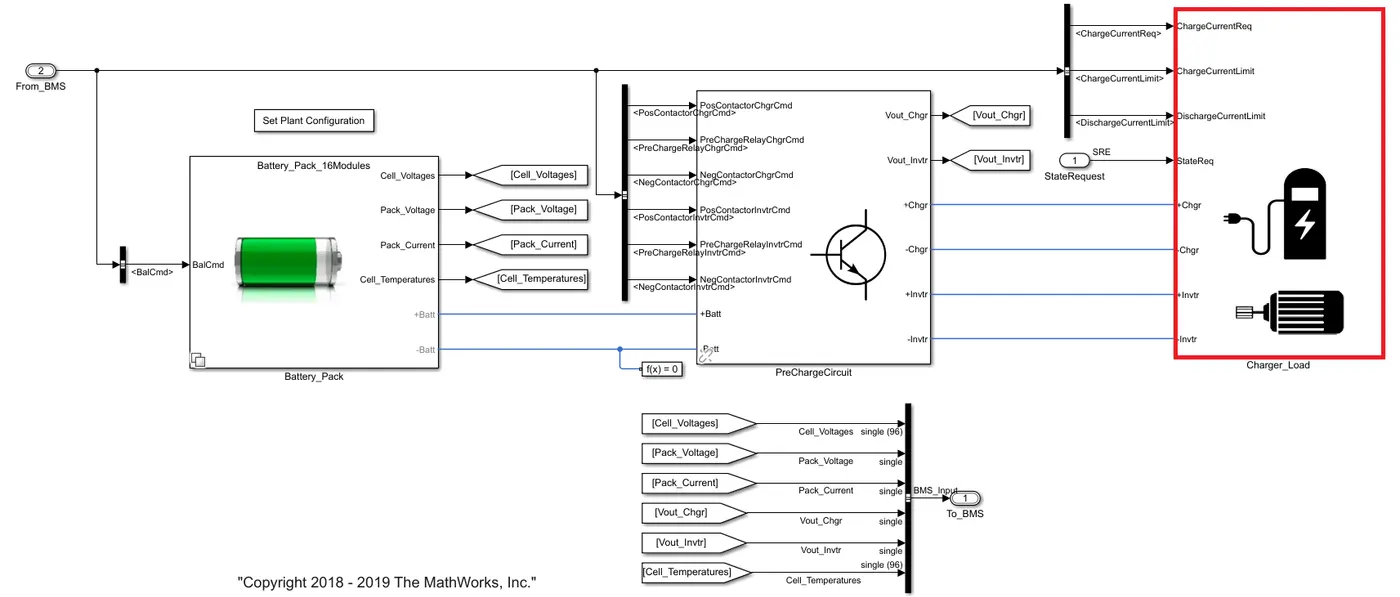
- The charger load system is shown below-
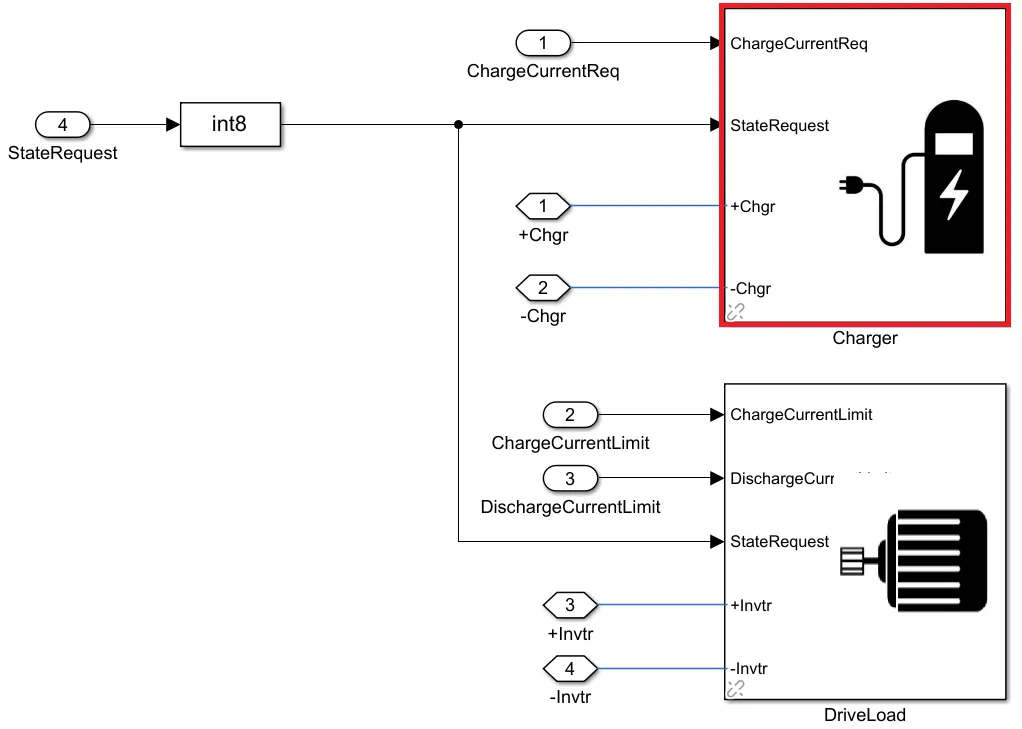
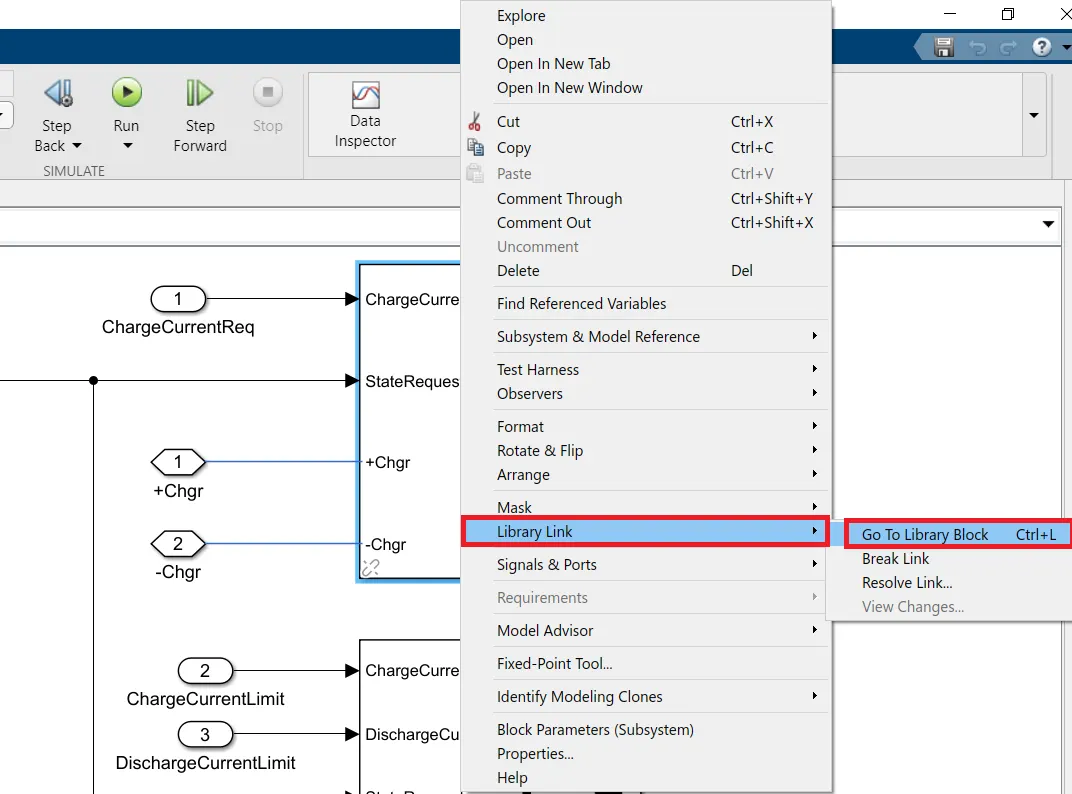
- Right-click on Charger block, select library link and then select go to library block from there.
- The following shows the libraries linked with the charger subsystem.
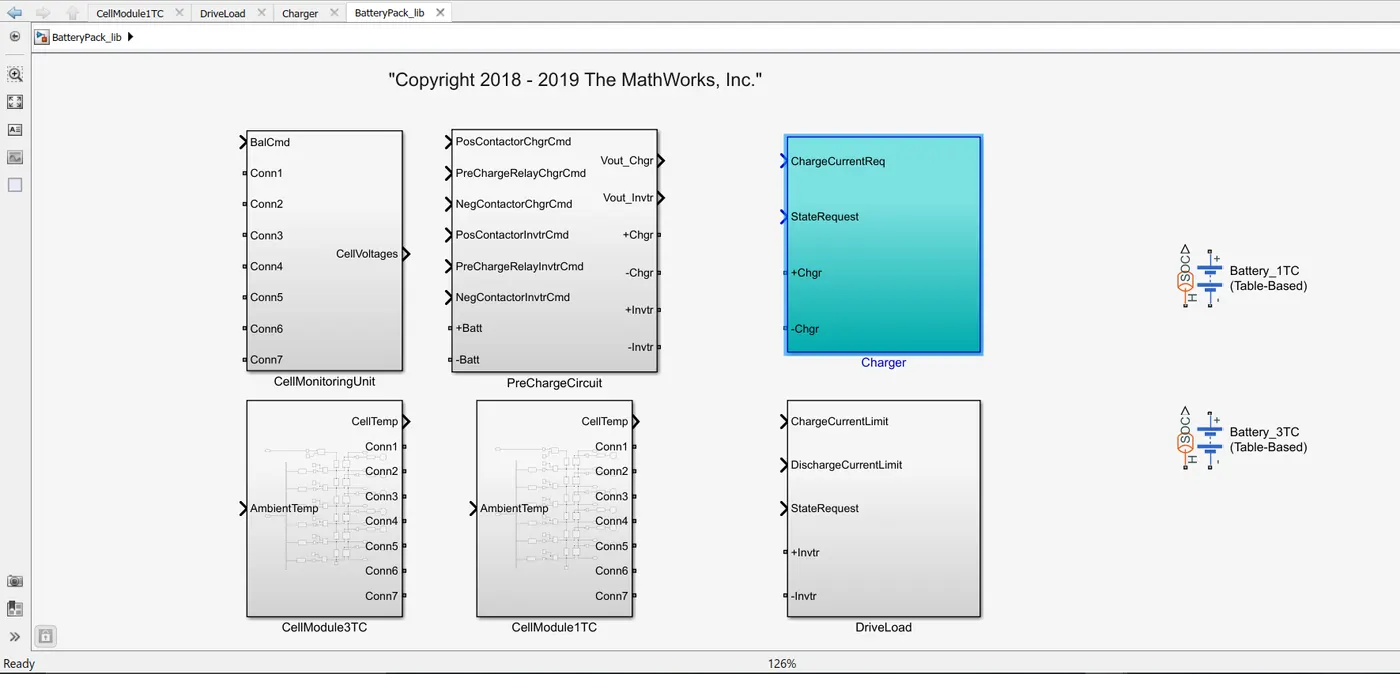
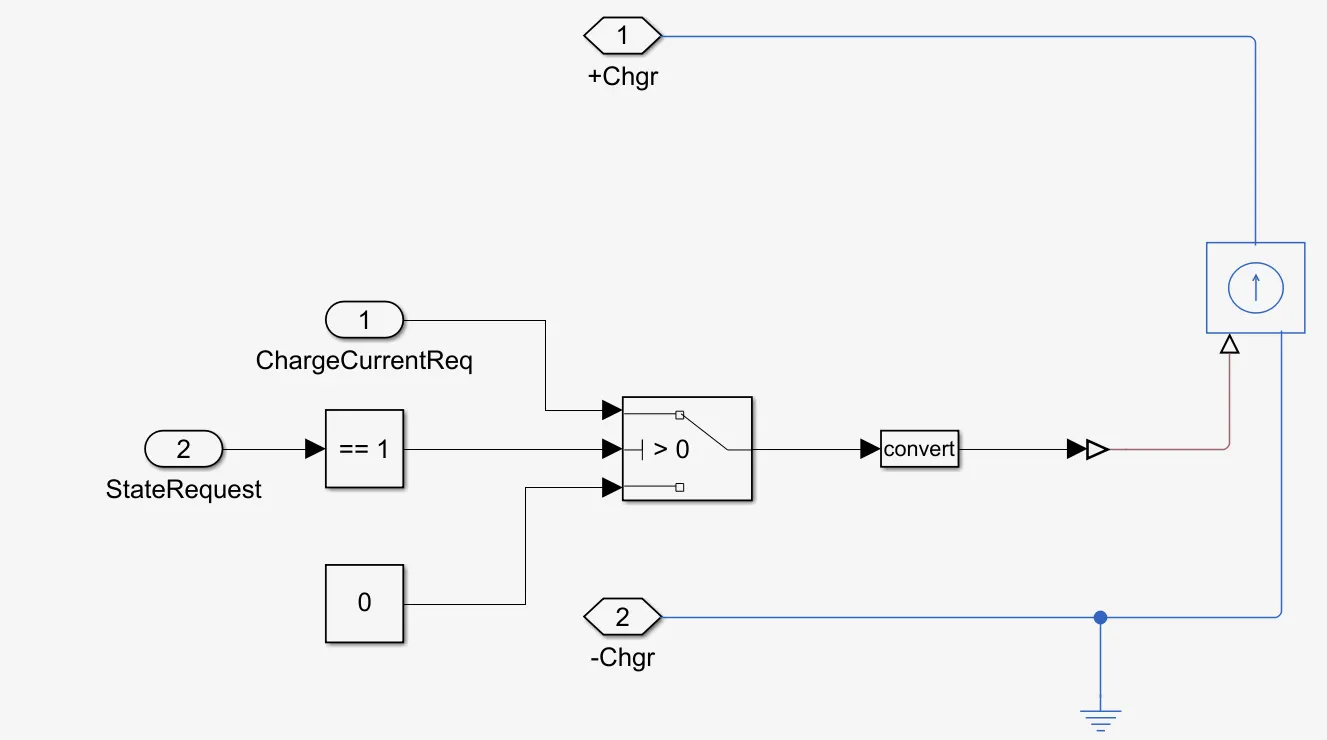
- Clicking on the charger system the following circuit opens up. This way all the systems can be analysed.
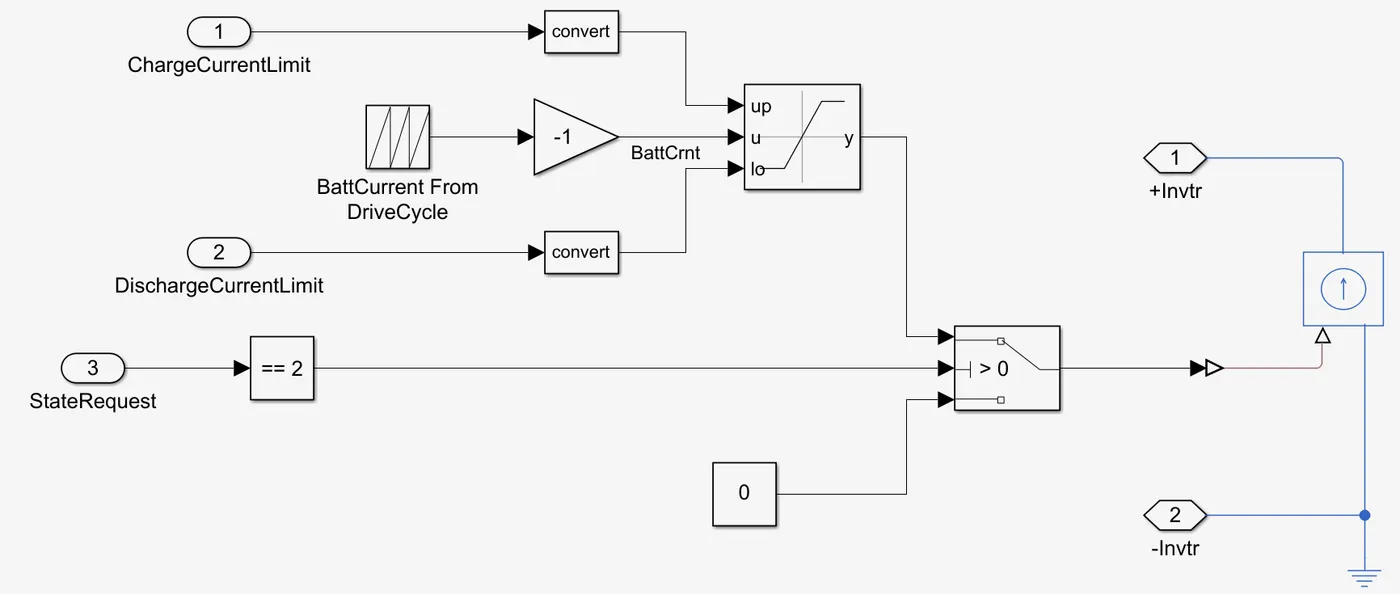
- Similarly going back to the load circuit, we can select the library link and open all the libraries linked with the load subsystem. The following window opens up and shows the other libraries linked with the load.
Task 2
What is coulomb counting? Refer to the above model and explain how BMS implements coulomb counting for SOC estimation?
COULOMB COUNTING:
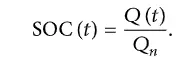
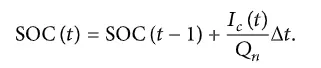
The SOC is one of the most important parameters for batteries. In general, the SOC of a battery is defined as the ratio of its current capacity (Q(t)) to the nominal capacity (Qn). The manufacturer's nominal capacity and represents the maximum amount of charge that can be stored in the battery. The SOC can be defined as follows:
The various mathematical methods of estimation are classified according to methodology. The classification of these SOC estimation methods is divided into the following four categories.
(i)Direct measurement: this method uses physical battery properties, such as the voltage and impedance of the battery.
(ii)Book-keeping estimation: this method uses discharging current as of the input and integrates the discharging current overtime to calculate the SOC.
(iii)Adaptive systems: the adaptive systems are self-designing and can automatically adjust the SOC for different discharging conditions. Various new adaptive systems for SOC estimation have been developed.
(iv)Hybrid methods: the hybrid models benefit from the advantages of each SOC estimation method and allow a globally optimal estimation performance. The literature shows that the hybrid methods generally produce a good estimation of SOC, compared to individual methods.
Book-keeping estimation:
Book-keeping estimation method uses battery discharging current data as input. This method permits to include some internal battery effects as self-discharge, capacity-loss and discharging efficiency. Two kinds of book-keeping estimation methods have been employed: The coulomb counting method and the modified Coulomb counting method.
1)Coulomb counting method
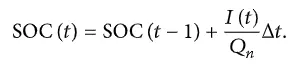
The Coulomb counting method measures the discharging current of a battery and integrates the discharging current over time to estimate SOC. Coulomb counting method is done to estimate the SOC(t), which is estimated from the discharging current, I(t), and previously estimated SOC values, SOC(t). SOC is calculated by the following equation:
But several factors affect the accuracy of the Coulomb counting method including temperature, battery history, discharge current, and cycle life.
2)modified Coulomb counting method
To improve the Coulomb counting method, a new technique called the modified Coulomb counting method is proposed. The modified Coulomb counting method uses the corrected current to improve the accuracy of estimation.
The corrected current is the function of discharging current. There is a quadratic relationship between the corrected current and discharging current of the battery. By the practice of experimental data, the corrected current is calculated by the following form:

where, k2, k1, k0 are constant values obtained from the practice experimental data.
In the modified Coulomb counting method, SOC is calculated by the following equation:
The experimental results show that the accuracy of the modified Coulomb counting method is superior to the conventional Coulomb counting method.
2b)
to compute the SOC of the battery, insert a plant block into the model.
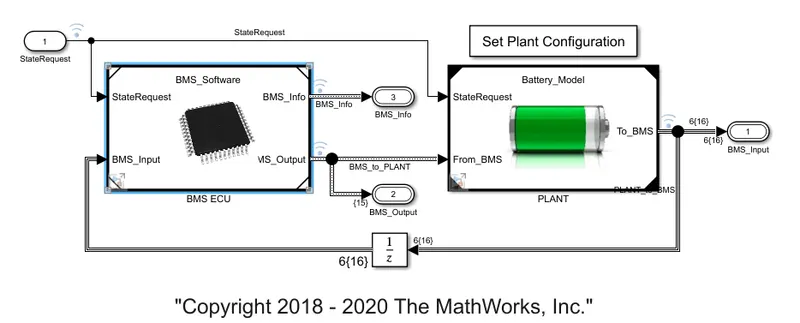
BMS algorithm models, protects, reports the measurement from the battery pack.
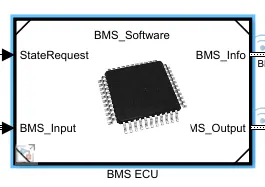
when we click on the BMS ECU block get,
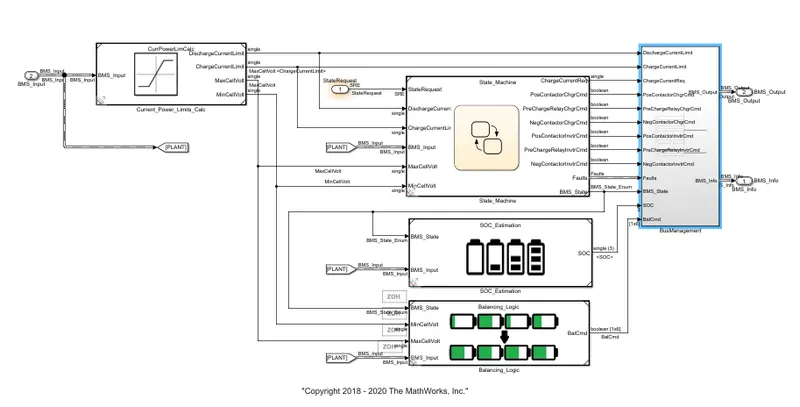
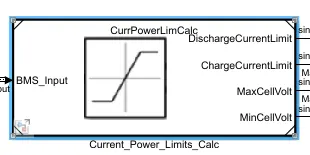
we get the below block diagram by clicking on the current power limit calc block.
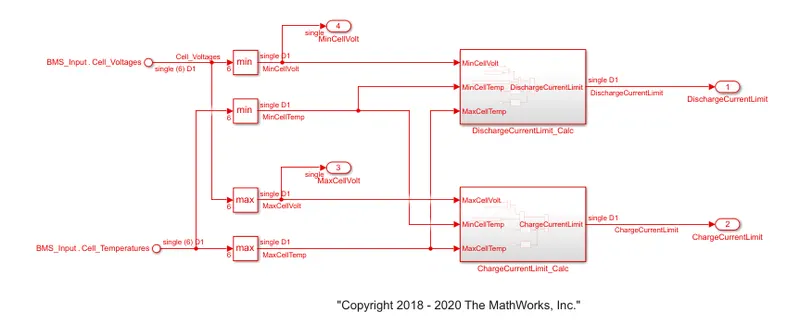
here the cell voltage and cell temperature are used to decide maximum allowable charging and discharging current limits.
when the cell is at the lowest SOC, its voltage is low, and thus it is important to prevent the cell from delivering a large amount of current because it will cause a large voltage drop that could be potential below the cut off voltage specified by the cell manufacture.
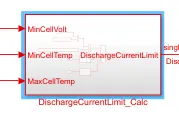
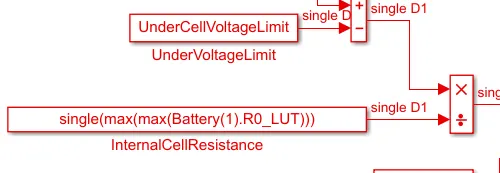
click on discharge-current limit calc block, we get the following block diagram shown below,
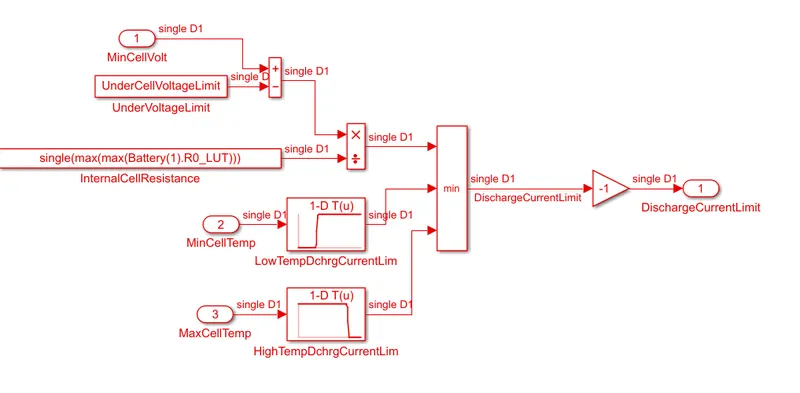
hereby comparing the minimum cell voltage in the module against this lowest threshold voltage and then divided by maximum internal cell resistance value, we can compute the voltage based threshold.
it is also important to limit the current delivery and current intake when the temperature is too high or too low.
using the lockup table with rising and fallings shape profile, we can specify current threshold-based temperature and thus can modulate allowable current delivery.
it is recommended to avoid low and high temperature during discharging and low temperature during charging.
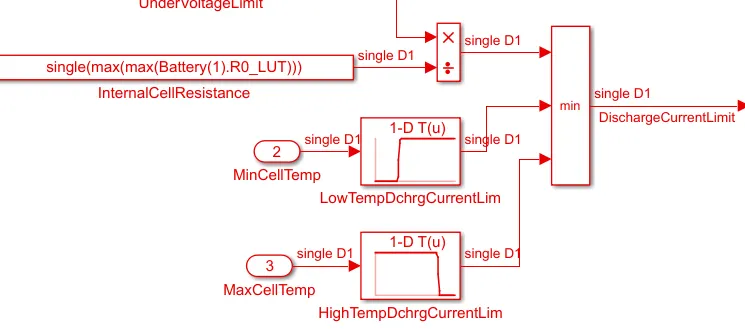
then the above two thresholds are then compared and a minimum of these two becomes the current limit.
knowing how much longer we can able to drive our car before we had to stop for recharge depends on the accurate estimation of battery SOC.
In the battery system, we do not measure SOC directly, we actually measure something else and then relate it with SOC.
3 methods are used for SOC estimation.
but coulomb counting is mostly used.
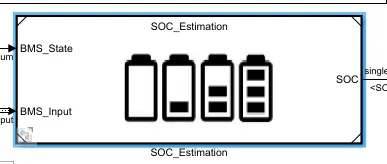
click on soc estimation block, we get,
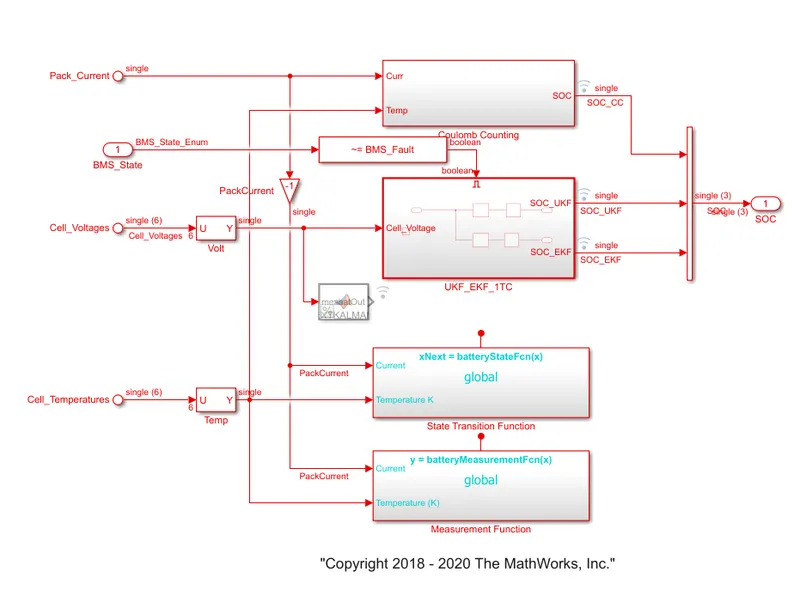
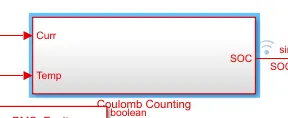
by clicking on the coulomb counting block, we get the below block diagram
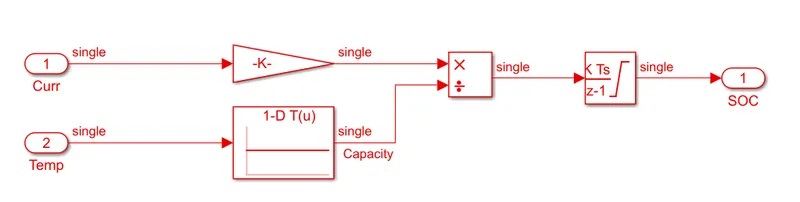
in this coulomb counting method, the entering and leaving currents of the cell are integrated to track the safe chargeable time.
here the two input signals current and temperature are taken
the current signal goes to gain block and the temperature signal goes to the current lookup table.
then as seen, signals are multiplied and divided as shown and then output is given to discrete-time integrator to track the safe chargeable time and then SOC is estimated.
advantage of the coulomb counting method is its simplicity and low computational cost.
the drawback of the coulomb counting method is an accumulation of current sensor error and the inability to recover from the wrong initial condition because of lack of feedback from voltage measurement.
CONCLUSION:
the various objectives given in the question are achieved and the various results are studied.