Week 7 State of charge estimation
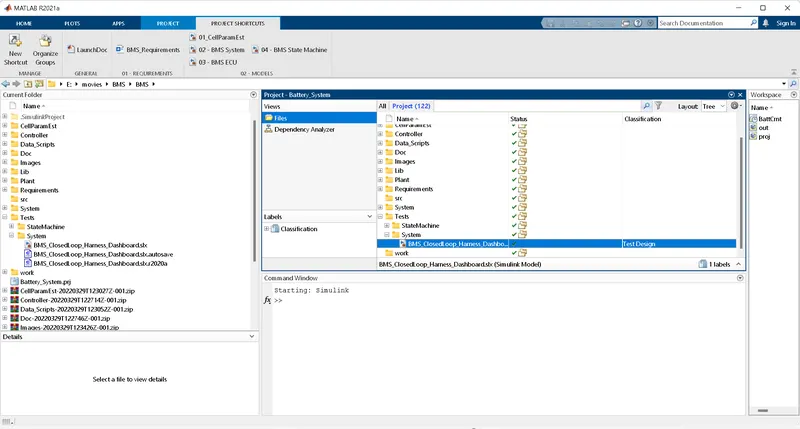
After downloading the model from matlab we have to run 3 different test cases . The model shows different blocks. It has different models modelled in it. In the test after the model is launched, Under test folder select system , after selecting system select BMS closed loop test harness dashboard
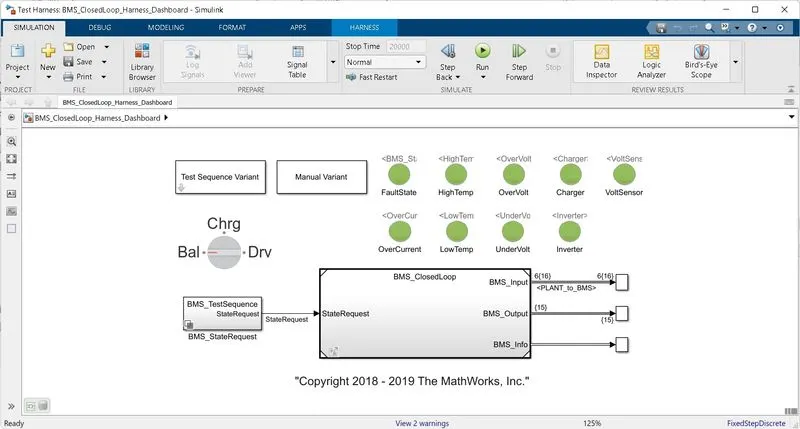
After clicking on harness dashboard , model will be opened.The model contains 4 Main blocks ,
1. Test sequence variant, which consists of 3 main test cases. 2.Manual variant , which describes the mode of driving either balanced ,charging or driving mode.
3.BMS state request block.
4.BMS closed loop.
The circle type structures on right indicates whether there is fault in the system.
system. If the circle is filled in green it represents that the system is working correctly. If any of the above circles turn red it represent the fault and the circle will change color to red.
1. Case 1:
Selecting 1st test sequence variant.
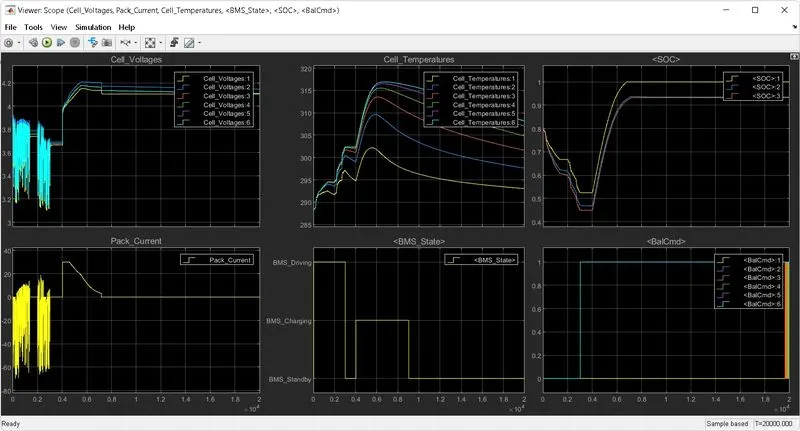
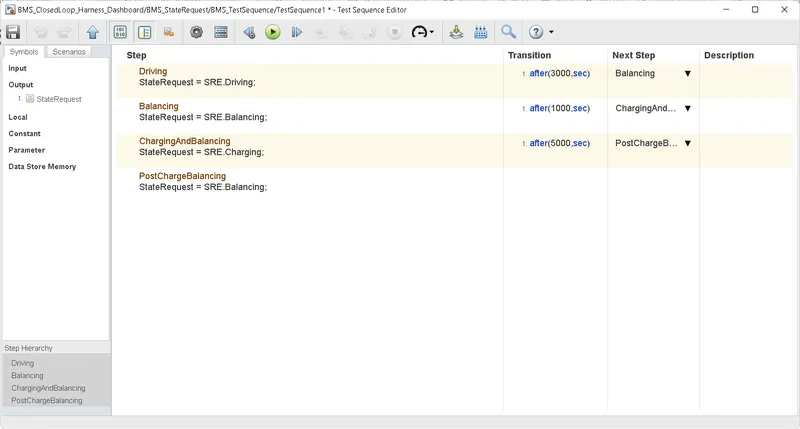
The cycle consist of driving , balancing,and balancing cycle and charging .
During the driving cycle as we can see the voltage and current continuously waves depending upon the load as seen in grapg 1 and 4. Therefore the Soc keeps on depleding.
during the 2nd cycle as battery is charged and balanced (i.e balancing of cell occurs) the voltage reaches the maximum voltage of 4.2 volts. w.r.t charging the cell temperature reaches high value.(i.e cell no 6 temp).
in the 3rd cycle: the battery is post charged and balanced throughout. Therfore the cell temperature almost gets maintained at equal temp. The cell voltage of Higher voltage cell is droped to maintain the balancing og the cell and hence the current output remains conctant throughout.
Case 2:
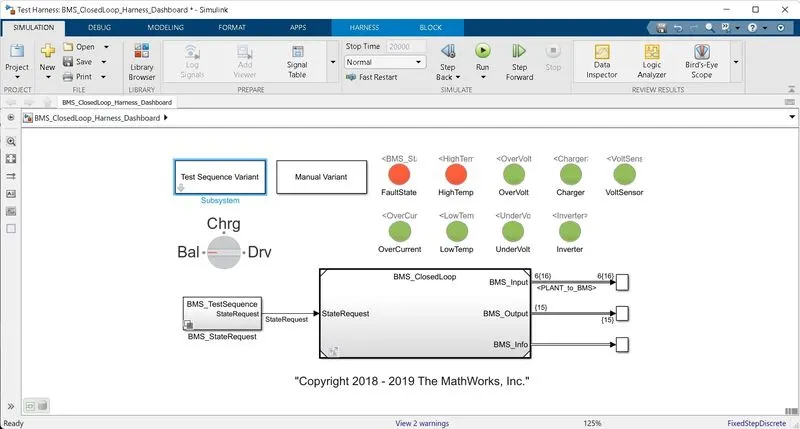
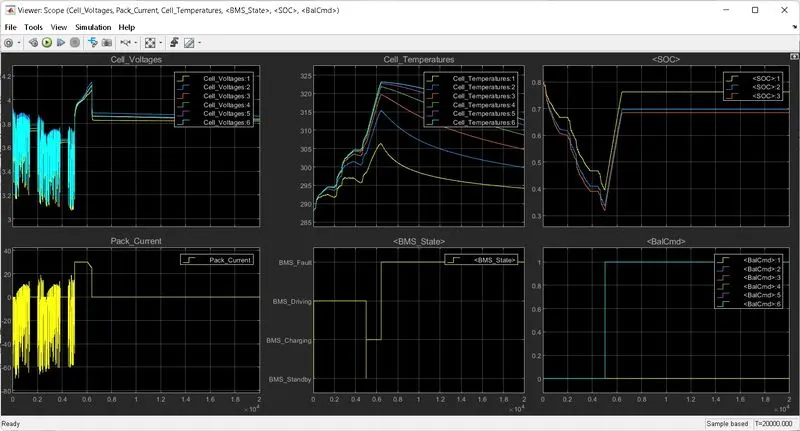
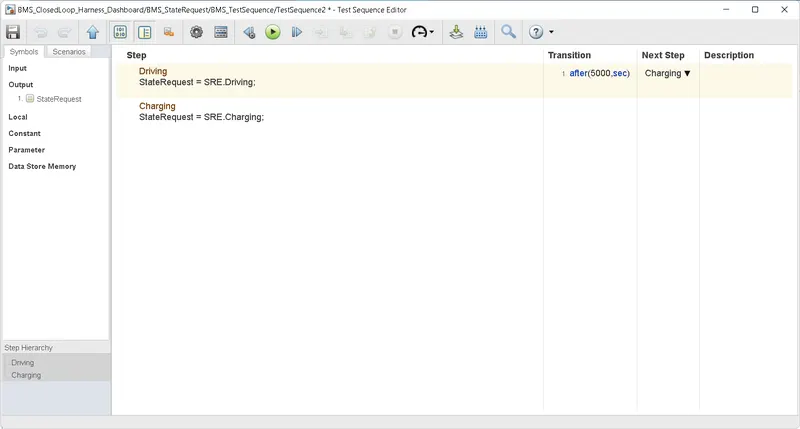
In type 2 case , as we can see the circles have turn red in color which represents the faulty state.From the above img its clear that charging and driving cycle takes place simultaneously.
As the driving cycle is started depending upon the load the current is been extracted from the cell which results in the voltage drop in every cell. Due to heavy load output the temperature of the cell have been increased drastically i.e 325. Dur to the high temp., there are chances of short circuit due to which fault alarm blinks . for the heavy loded vehicles the coocling capacity of the battery seperate colors or fans are present to maintain the inbetween temp.
As you can see the SOC of every cell decreses in the driving cycle and then gets charged with having different SOC of each cell.
Case 3:
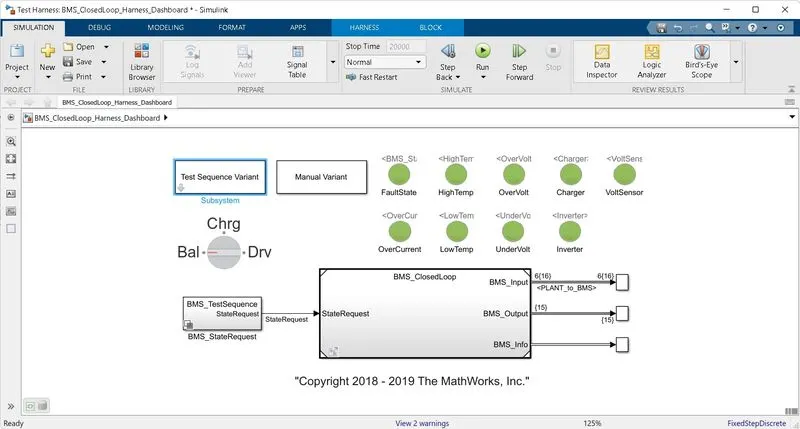
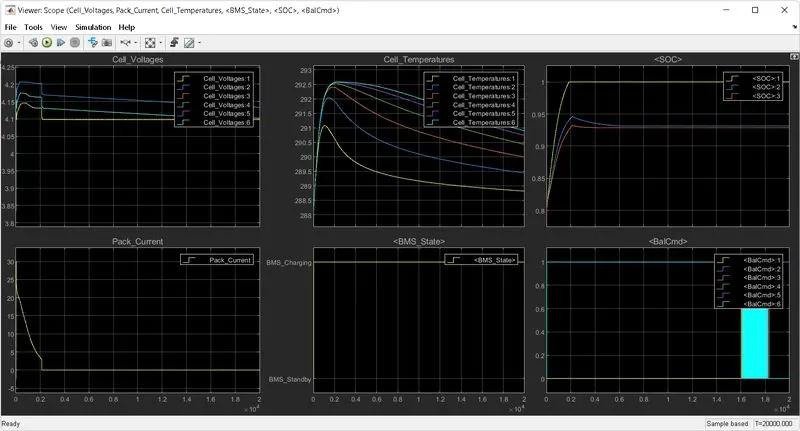
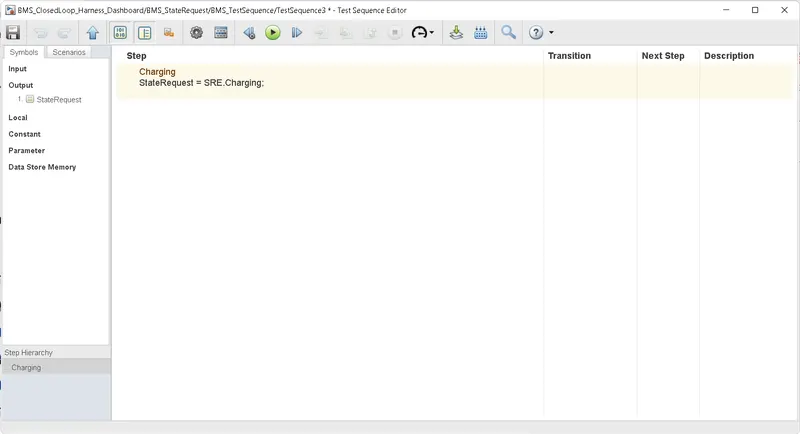
It represents the charging of the battery pack.The pack current is decreased , Soc and voltage simultaneouly increses and cell is balanced.The cell temp. gradually increases and then decreases without heating any peak value. Soc has almost reached 90 perct,. of the cell limit.
2.What is coulomb counting? Refer to the above model and explain how BMS implements coulomb counting for SOC estimation ?
Columb counting is technique used to measure the state of charge of the battery pack. In other words it measures the amount of flow entering or leaving in the measure time intervals in the battery pack mostly in Ah (ampere hours).
SCO(t) = SOC(t-1)+I(t)/Qn deltaT
1. BMS closed loop
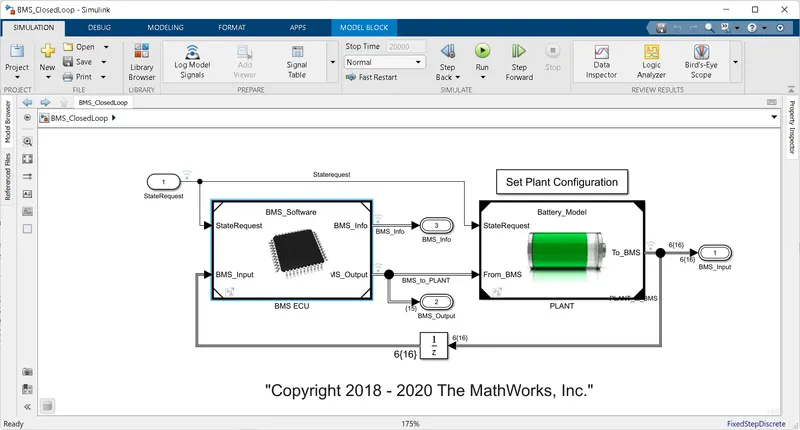
By clicking down on BMS ecu we get
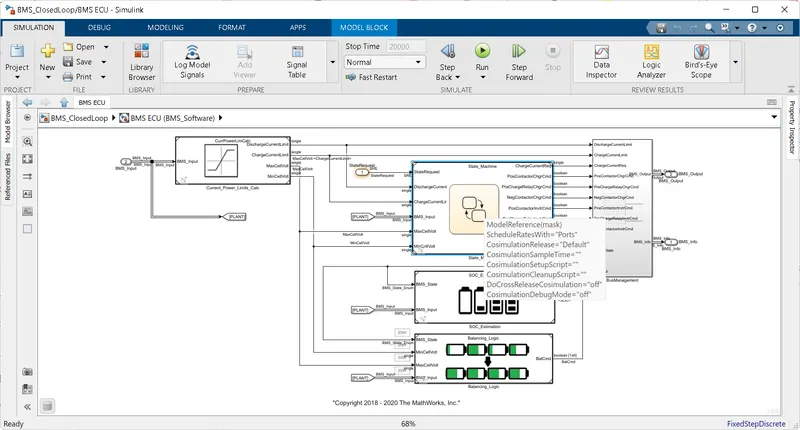
By double clicking on stae machine we get the following.
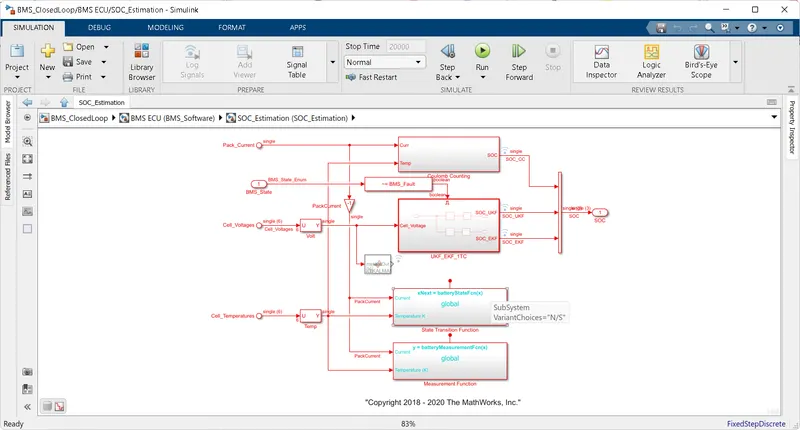
By clciking on SOC estimation we get the following.
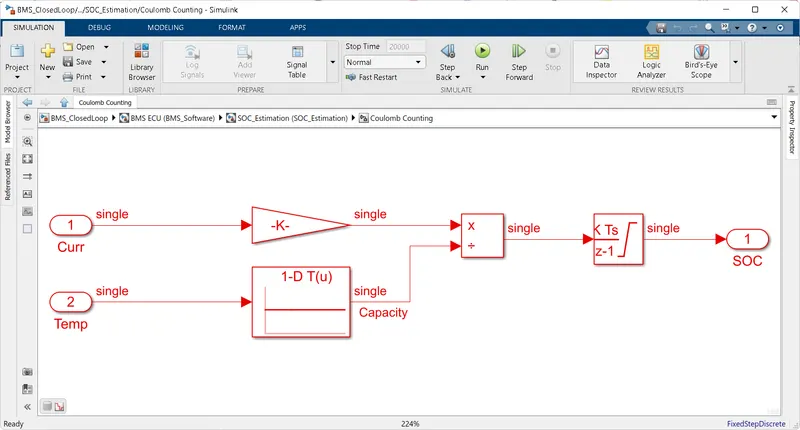
By clicking on columb counting block we get
Bms closed loop is linked with the BMS ecu model within it.
for the estimation of soc , The soc estimation blocks takes the input from state machine system. In the SOC estimation block , for columb counting battery pack current and temperature are the two main inputs to determine the soc of the system.
In columb counting : The curent is multiplied over the constant block using the gain block and further combines the two signal i.e current and temperature using another block .
To validate the temperature data using the 1D lookup table.
Then by integrating both the variables using discreate time integrator SOC is estimated