Week 4.1 - Genetic Algorithm
%ga algorithm by example 2
clear all % clears closes the previous data in command window
close all
clc
x=linspace(0,0.6,150);%creating a serch space from 0 to 0.6 into 150 parts
y=linspace(0,0.6,150);%creating a serch space from 0 to 0.6 into 150 parts
f=stalagmite2(x,y);%call for stalagmite function
numcases=50; %for running ga algorithm 50 times
tic %timer on for performing ga study 1
for i=1:numcases%performing the loop for study 1
[input,fopt(i)]=ga(@getstalagmite1,2);%performing ga to the function having 2 variables x and y, it finds the unconstrained maxima or minima depending upon the func sign
xopt(i)=input(1);
yopt(i)=input(2);
end
%study1 statistical behavior
study_time= toc%calculating the time required for study
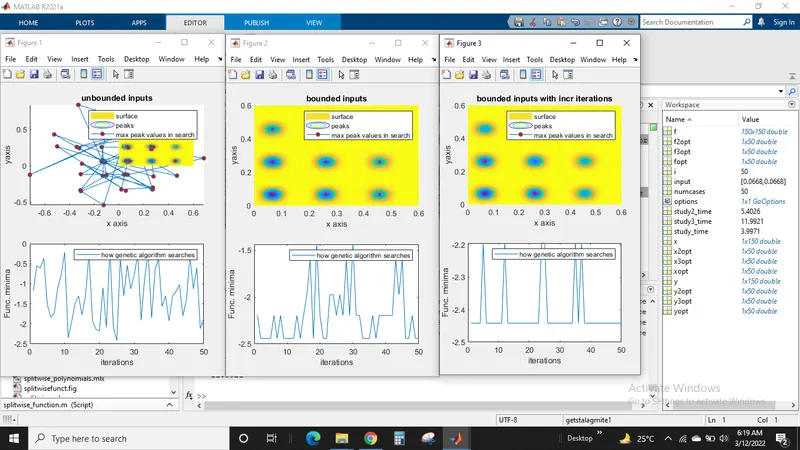
figure(1)%creating figure 1
subplot(2,1,1) % for a single figure window creating 2 rows 1 column in which 1st figure is in 1st row
xlabel('x axis')%labaling of x and y axis
ylabel('yaxis')
hold on %holding the command for the next plot
surfc(x,y,f)%creating 3 d grah of the resective values
shading interp %clears the line shading in surfc
plot3(xopt,yopt,fopt,'marker','o','markersize',5,'markerfacecolor','r')%plots x y and f values
legend('surface','peaks','max peak values in search')%displays what the grah lines represents
title('unbounded inputs')%title of the graph
subplot(2,1,2)% for a single figure window creating 2 rows 1 column in which 1st figure is in 2nd row
plot(fopt)
xlabel('iterations')%xlabel for 2nd graph in 2nd row 1st column
ylabel('Func. minima')%ylabel for 2nd graph in 2nd row 1st column
legend('how genetic algorithm searches')
%study2 statistical behaviour
tic %start timer for 2nd study
for i=1:numcases %performing the loop for study 2
[input,f2opt(i)]=ga(@getstalagmite1,2,[],[],[],[],[0,0],[1,1]);%finds local minima x to func subjected to linear inequalities it evaluates matrix product
%ga(func,vars,a,b,aeq,beq,ub,lb);no linear equalities exist , therefore the bounds are set to
%zero
x2opt(i)=input(1);%input values are assigned to xot and yopt
y2opt(i)=input(2);
end
study2_time= toc%end of study timer
figure(2)%new figure window
subplot(2,1,1)
xlabel('x axis')
ylabel('yaxis')
hold on
surfc(x,y,f)
shading interp
plot3(x2opt,y2opt,f2opt,'marker','o','markersize',5,'markerfacecolor','r')
legend('surface','peaks','max peak values in search')
title('bounded inputs')
subplot(2,1,2)
plot(f2opt)
xlabel('iterations')
ylabel('Func. minima')
legend('how genetic algorithm searches')
tic
%study 3 increasing the number of iterations
tic %start of study time for 3rd study
options=optimoptions('ga')%to have an extreme narrow passage we use options tool in ga with since in population size
options=optimoptions(options,'populationsize',170);%created an optim options using options
for i=1:numcases
[input,f3opt(i)]=ga(@getstalagmite1,2,[],[],[],[],[0,0],[1,1],[],[],options);%minimizes with default value of optimization parameters
%ga(func,vars,a,b,aeq,beq,ub,lb,non1)non1 means no non linear-
%constraintexist, no linear equalities exist , therefore the bounds are set to
%zero
x3opt(i)=input(1);
y3opt(i)=input(2);
end
study3_time= toc
figure(3)
subplot(2,1,1)
xlabel('x axis')
ylabel('yaxis')
hold on
surfc(x,y,f)
shading interp
plot3(x3opt,y3opt,f3opt,'marker','o','markersize',5,'markerfacecolor','r')
legend('surface','peaks','max peak values in search')
title('bounded inputs with incr iterations')
subplot(2,1,2)
plot(f3opt)
xlabel('iterations')
ylabel('Func. minima')
legend('how genetic algorithm searches')
%stalagmite2 func
function [values]=stalagmite2(x,y)%values of x and y are called from main function
[xx yy]=meshgrid(x,y);%creating a 2 dimensional array
for i=1:length(x); %creating a loop for performing ga
for j=1:length(y);
input(1)=xx(i,j);%assigning the respective values of x to input 1
input(2)=yy(i,j);%assigning the respective values of y to input 2
values(i,j)=getstalagmite1(input);%assing the input values to another funct and storing the same in values
end %termination of the loop
end %termination of the loop
%getstalagite func
function [Call]= getstalagmite1(input)%function call for maximization or minimization of problem
f1x=(sin (5.1 * pi* input(1) +0.5)).^6; %eqn 1
f1y=(sin (5.1 * pi* input(2) + 0.5)).^6;%eqn 2
f2x=(exp((-4)*log(2)*(input(1)-0.0667).^2))/0.64;%eqn 3
f2y=(exp((-4)*log(2)*(input(2)-0.0667).^2))/0.64;%eqn 4
Call=-(f1x.*f1y.*f2x.*f2y);%passing on the values and storing it for each execution of the loop
% minus signs mirrors the image to positive x axis which gives us maxima as
% the minimum point which is maxima of the funct
end %termination of function
explanation of ga func:
ga is used to solve both constrained and unconstrained problems. it is based on natural selection likely the charles darvin theory fittest of survival base on evalution.
there are 3major phases is ga,
1. initialization
2. selection
3. reproduction
1. Initialization
we gen an randomized ga defined poulation size, then the code finds the fittest of the survival based on no.of itterations.The fittness value from the code is used for reproduction of childerens.
2. Selection
after we select the fittest values, ga then passes it to next generations.The main goal is to find the region where the chances of getting the best soln is more.
3. Reroduction
Generation of offspring is of 2 tyes a. Crossover and 2. mutation
Syntax of GA:
x=ga(func,nvars)
ga function always minimises a func. deending on no. of variables that are asses in funct 'nvars' varies.
It finds the local minima x to the objective func.
Depending on non linear equalities, equalities the funcn syntax changes and may be replace by empty box parenthesis, '[]'.
to have and norrow search space it is necessary to specify the upper and lower boundaries with increase in poulation to find the best values. therefore we use the set of options in ga . Syntax is as follows.
Syntax: x=(ga,nvars,a,b,aeq,beq,ub,lb,non1con,intcon,options)
here a and b are linear inequalities; they can be empty box brackets
aeq,beq are subjected to linear equalities; they can be empty box brackets
ub, lb represent the upper and lower boundaries
non1con represents the non linear constraints.
intcon imlies to take integer values
options minimizes the default optimization parameters and replaces them with the values in opt which is created using optimoptions
ERRORS FACED:
1. during calling of funct, which can be solved easily .
2. during creating function from function call but solved easily by refering to the videos