Week 7 State of charge estimation
State of charge estimation :
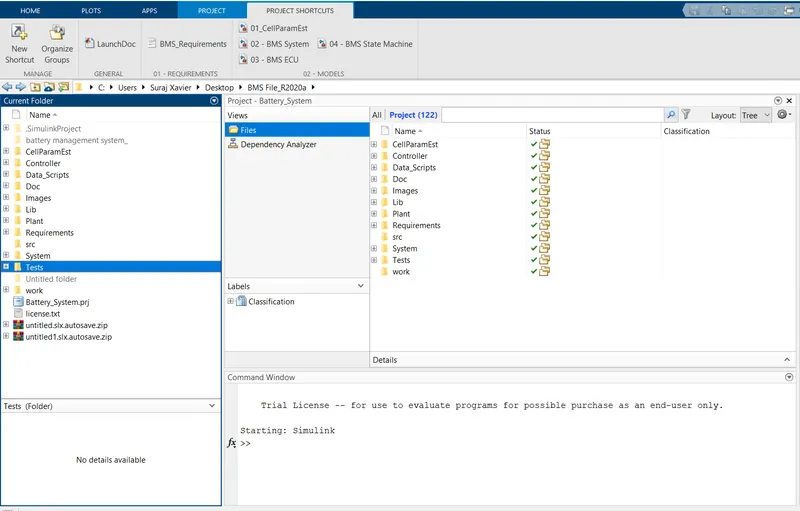
- The given zip file was downloaded and extracted.
- Then the file was opened in the matlab software.
- Make sure that the MinGw is downloaded from the add ons.
- Then the given file was added to the path.
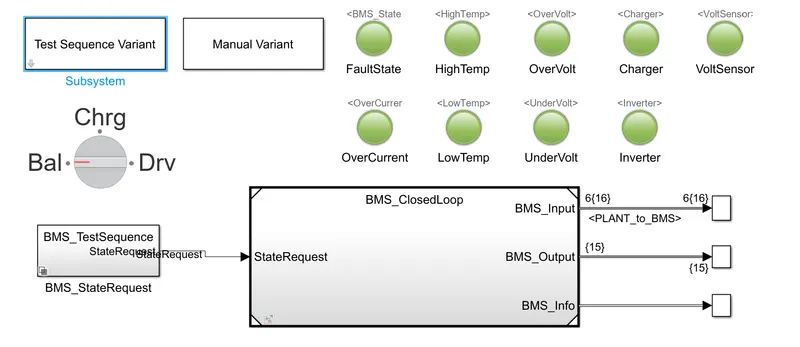
- Then the BMS closed loop harness dashboard was opened.
Test case 1 :
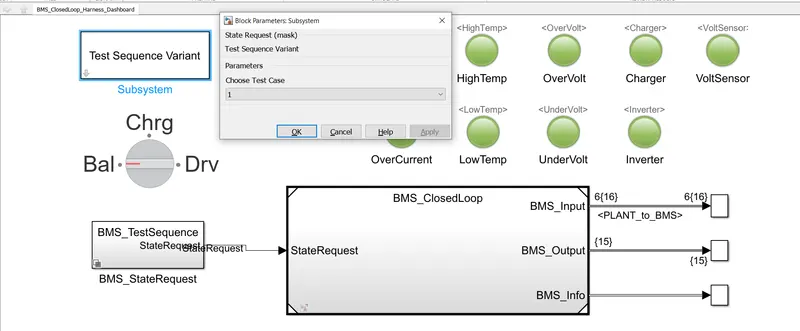
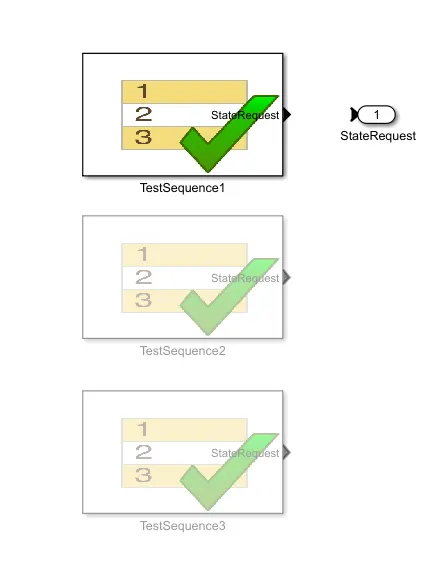
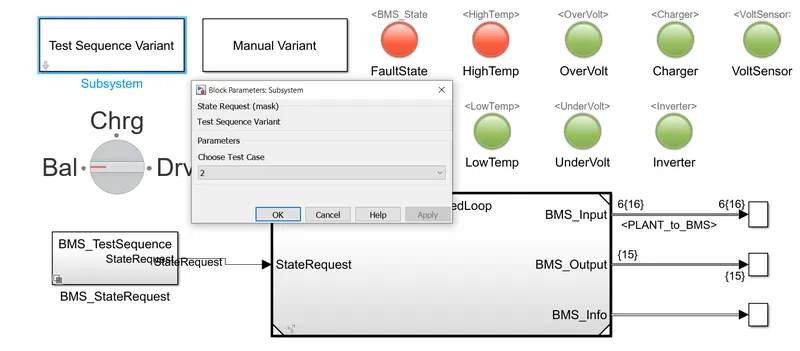
- The test sequence variant block was opened and the test case was selected as one.
- The model was run and the result was result was analysed.
Result analysis :
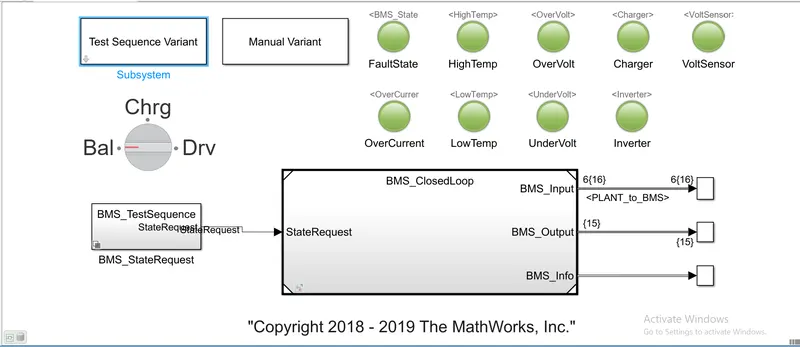
- The Lamp indication were green for all states which means the model is in good condition and no fault is occured.
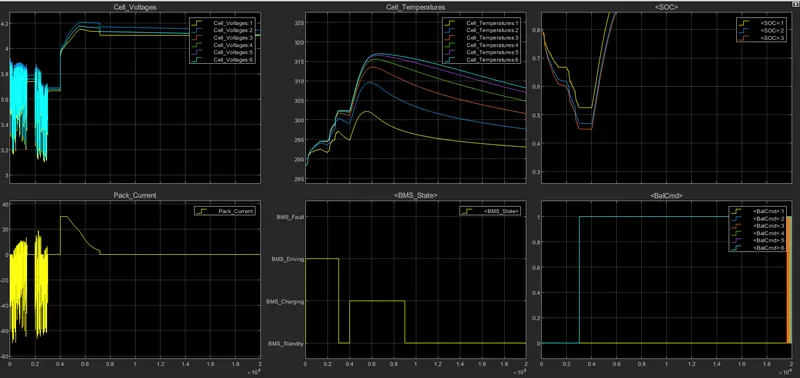
Driving state (0-3000 secs):
- All the cells for the first 3000 secs are in driving state so the discharge of all the cells occurs and its varies in the range of 3.1 to 3.9 V (min and max.).
- Cell temprature increases from 288K to 302 K.
- SOC also reduces from 80 % to 45%.
Balancing State (3000-4000 secs):
- After 3000sec for 1000 secs, cell balancing occur and the Modules are in standby mode and they are having constant voltage near about 3.7V.
- Cell temperature reduces slowly as no current flow through the cells during balancing.
- SOC is also constant during this period at 45% .
Charging and Balancing state (4000- 9000 sec):
- fter 4000 sec the charging occurs and the cell voltages increased from 3.7 to nearly about 4.2 V in Constant current mode with current of nearly 30A and then the constant voltage charging starts and current reduces from 30A to 2.5 A Charging and balancing of cells occur till 9000 sec.
- Cell temperature also start to increase exponentially upto constant current region and reduces as current flow reduces in constant voltage mode.
- SOC also increases from 45% to 94%.
Post charge Balancing state(9000- 20000sec):
- After 9000 sec the post cell balancing starts under standby mode.
- Cell temperature reduces in this mode and tries to reach the ambient temperature.
- SOC remains constant to 94%.
Test case 2 :
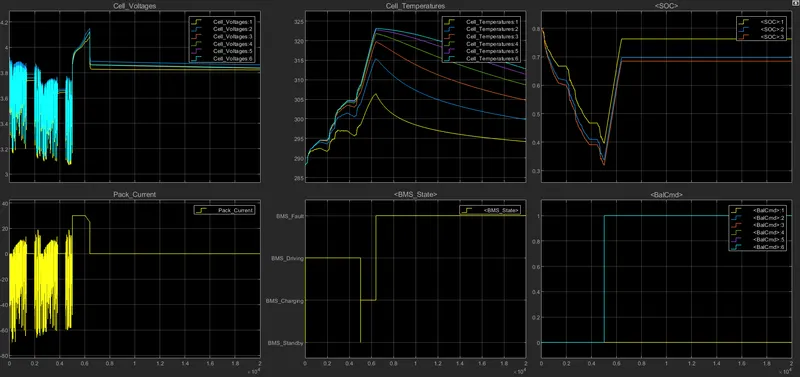
Result analysis :
- Here the red colour indicates that there is a fault state and high temperature.
- In the SOC graph the state of charge was initially around 80% but gradually decreased.
- Then after the stand by period the SOC increased constantly and then the SOC remained constant without any change in SOC.
- The three differect SOC's indicates three types of calculations for SOC.
- The BMS has come to fault state and the pack current has become zero and so the BMS will disconnect the current to the load.
- In charging condition the voltage was increasing and became constant and the temperature will also decrease.
Test case 3:
Result analysis :
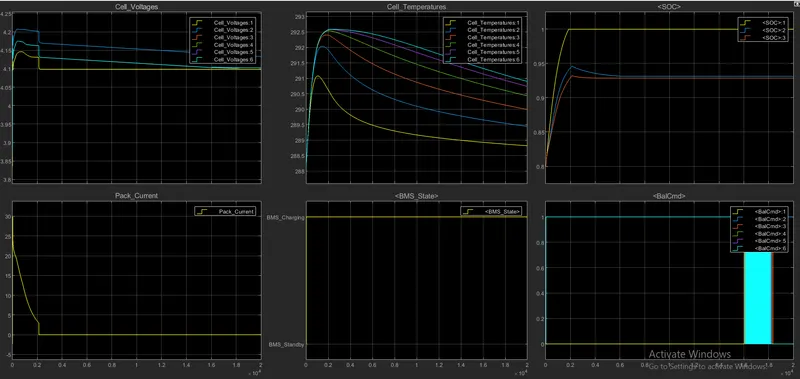
- Cell Voltages increases from there intial values and after 2000 sec they got constant .
- Pack current initally start from 0 to 30A and then start decreasing when the constant voltage mode is there to 2.5 A and got full charged upto 2000 sec.
- SOC was initally 80% and in 2000 sec it got fully charged that is 100%.
- Cell temperature starts to incraeses initally and when battery got fully charged then decrease down to the ambient temperature.
-
Entire battery pack sequence is operating in charging mode as shown above.
- Balancing of all cells is done at end of simulation.
Coulumb counting :
Coulomb counting is a technique used to track the state of charge of a battery pack. It works by integrating the active flowing current (measured in amps) over time to derive the total sum of energy entering or leaving the battery pack. This produces a capacity that is typically measured in Ah.
The coulomb counting method is also known as the battery current integration method. In this method, a discharging/charging current I(t) is measured and integrated over time to calculate the amount of energy remaining inside the battery. In this method, SOC is taken at the previous time step SOC(t-1) and the amount of energy removed/added at the current time step is subtracted/added from the SOC of the previous time step SOC(t-1) to obtain the amount of energy present in the battery at the present instant.
The SOC estimation in the coulomb counting method is done using the below equation,
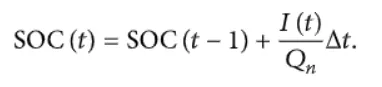
SOC(t-1) = SOC at previous time step
t = current time step
t-1 = previous time step
Q = Charge capacity of the battery
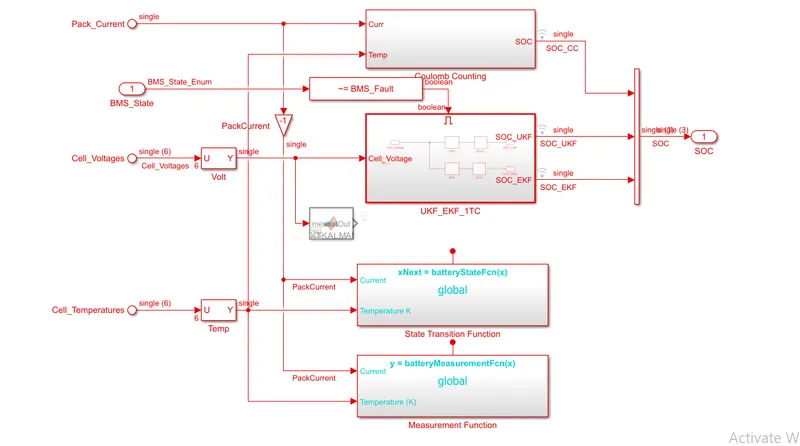
Coulumb counting method 1 :
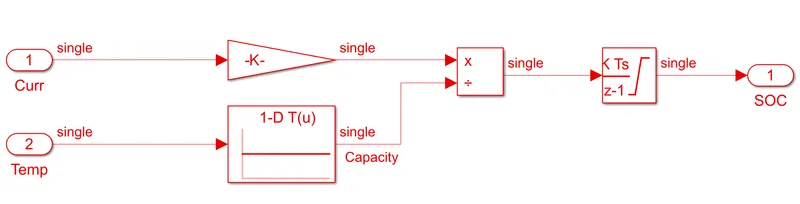
- Here the current is integrated over a period of time with also considering the temperature to obtain the SOC value.
Coulomb counting method 2 :
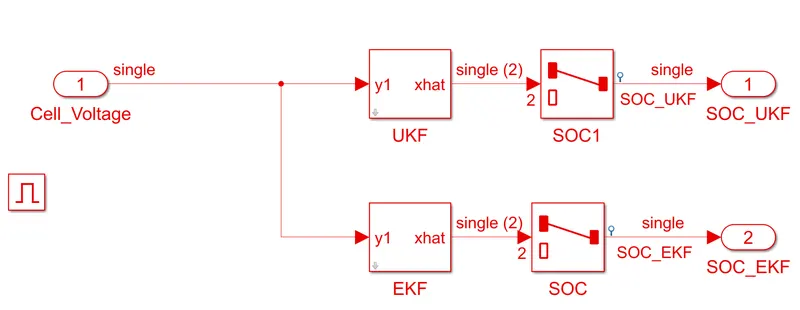
- Here unscented kalban filter and extended kalban filter is used to determine the SOC.
Conclusion :
The battery management system project model is downloaded and initialized in MATLAB and it is simulated for the 3 test sequences.
All the three test sequences of battery management systems are simulated and analysed for various characteristics and results are plotted and observed.
Coulomb counting method is studied and the implementation of that method is BMS to estimate the SOC is analysed.