Project - Data Handling and Interpolation
1)
Volts = [-17.3 -17.1 -17 -16.8 -16.5 -16 -15 -14 -12 -10 -8 -5 -2 -0.2 0.09 0.19 0.27 0.39 0.43 0.5 0.55 0.6 0.62 0.65];
Amps = [-28 -24 -19 -14 -9 -6 -4 -3 -2 -1.3 -1 -0.6 -0.3 -0.1 0 0 0 0.01 0.03 0.17 0.42 1.23 1.99 3.91];
time = [-17.3:0.1:0.9];
yi = interp1(Amps,time,'spline');
figure(2)
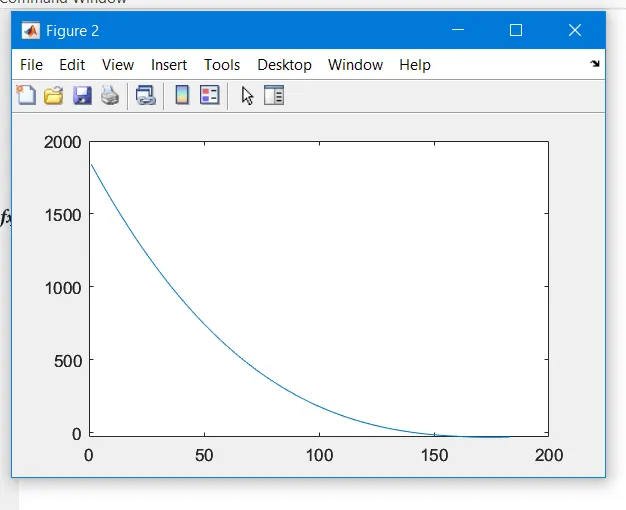
plot(yi)
Power = Volts.*yi;
EXPLANATION :
The values of votage and current was given as input from the provided excel sheet.The time interval was also given as per the given data from -17.3 to 0.9 at the interval of 0.1.The interpolation was done as y1 using the interpolation command and formation.Thus the given data has been interpolated and the graph has been plot and the resulted graph has been pasted above for reference.