Week 7 State of charge estimation
1. Simulate the 3 test cases from the harness dashboard.
The harness dashboard is shown below,
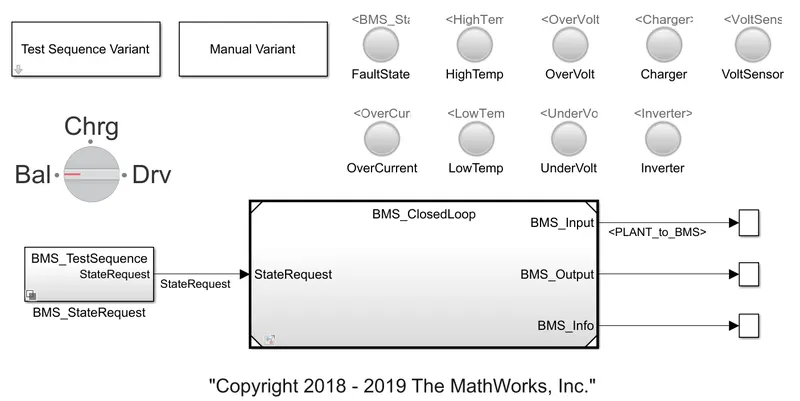
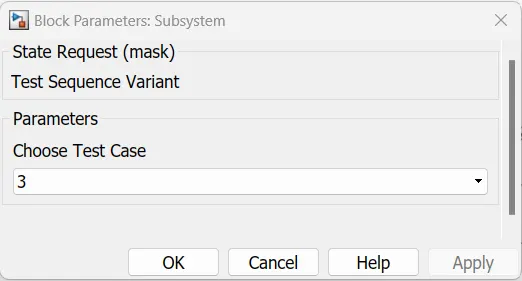
We can select the test cases from the Test Sequence Variant block. The Test Sequence Variant block parameters is shown below,
Results:
Test case 1
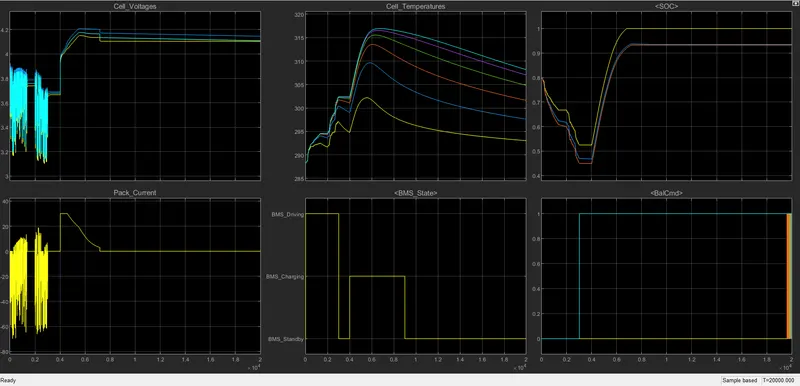
Observation - There were multiple fluctuations in the pack current and voltage in the initial stage when the pack was discharging. Upon the SOC decrease, the cell temperatures started increasing and when the SOC became constant, the temperature started reducing gradually. We could observe the CC and CV phase in the pack current and cell voltage graph. After charging, the BMS went to standby mode when the SOC became constant.
Test case 2
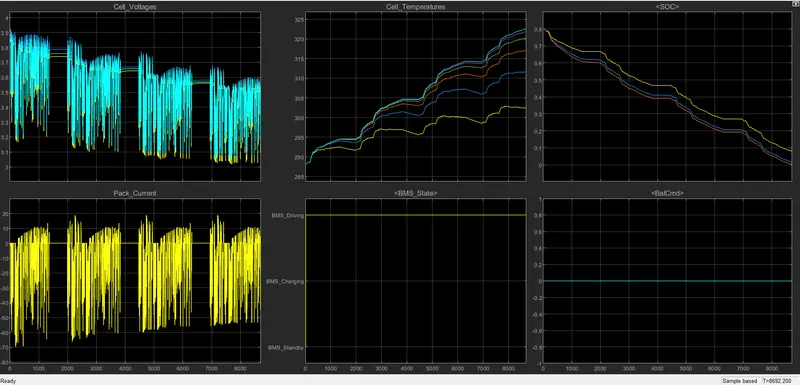
Observation - There is no CCCV charging of the pack in this test situation. It was also seen in the state graph of the BMS. Cell temperatures were rising as the SOC dropped to almost zero.
Test case 3
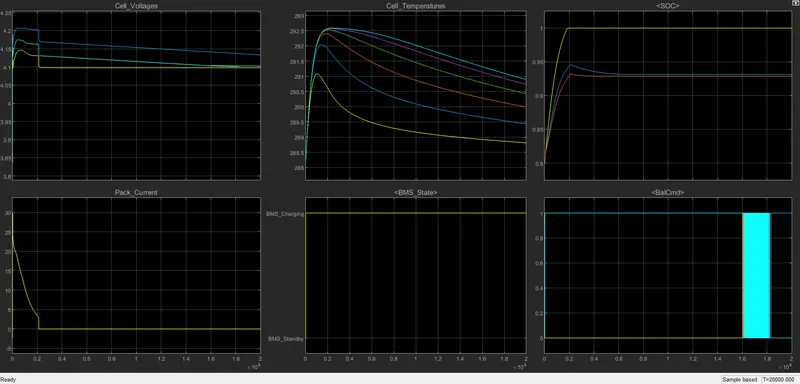
Observation - In the third test case, the pack is in the charging phase. Here too we could observe the CCCV phase in the cell voltage and pack current graph. The SOC increased to 100% and became constant throughout.
2. Coulomb counting method
The Coulomb counting method measures the discharging current of a battery and integrates the discharging current over time in order to estimate SOC. The coulomb counting method is done to estimate the SOC values, which are estimated from the discharging current and previously estimated SOC values, SOC is calculated by the following equation,
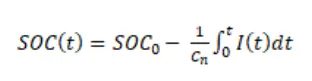
where,
SOC(t) = Actual SOC
SOCo = Initial SOC
Cn = Capacity of the battery
t = Instantaneous time
I(t) = Instantaneous current
Simulink model:
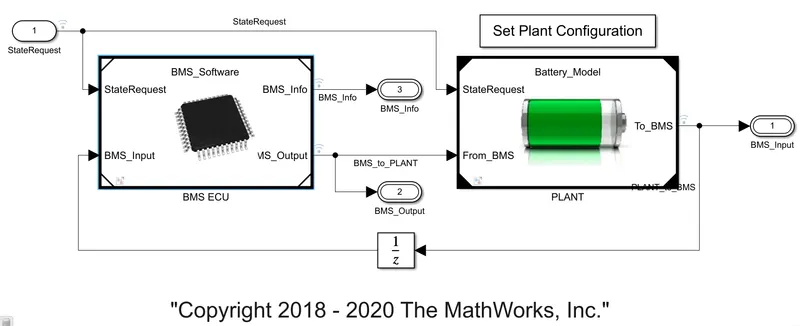
The SOC estimation block is inside the BMS ECU block.
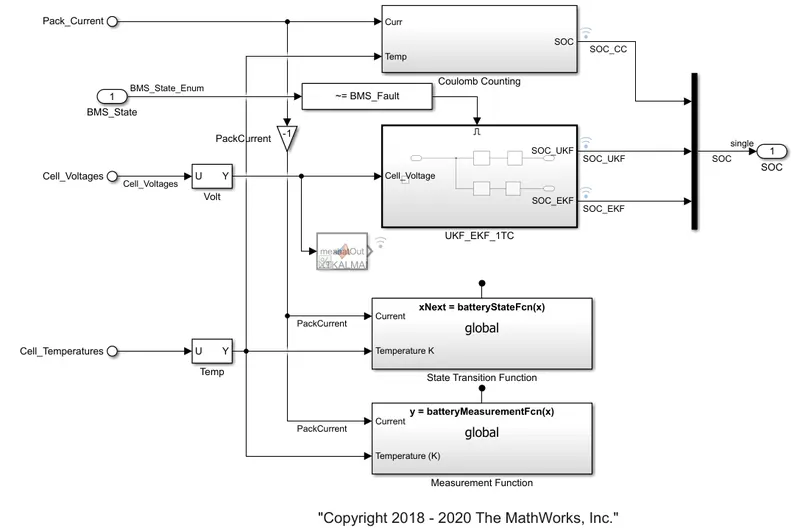
Coulomb counting block:
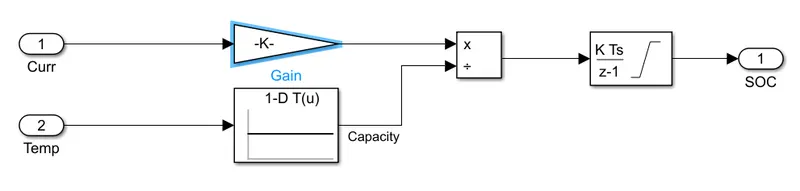
The current and temperature is fed as input. The current is multiplied by a factor for conversion and divided by the capacity of the pack which depends upon the temperature. The pack's SOC is calculated by integrating the resulting current value across time.
References: