Week 7 State of charge estimation
Aim - State of Charge Estimation.
Objective -
- Simulate the 3 test cases from harness dashboard and write a detailed report on the results.
- What is coulomb counting?
- Explain how BMS implements coulomb counting for SOC estimation?
Theory -
Battery management system (BMS) - The Battery Management System is a system which is used to predict the health and capacity of the charge in the battery.The BMs not only monitors the values but also for the detection of battery type, voltages, temperature, capacity, state of charge, power consumption, remaining operating time, charging cycles, and some more characteristics.
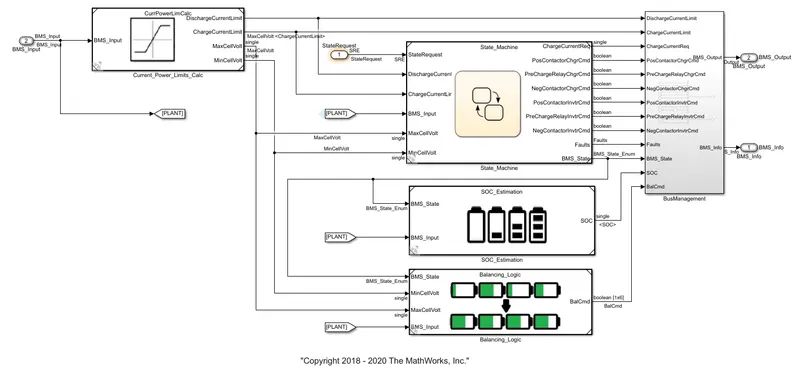
Now the model of the BMS simulation is as shown below. Which is BMS_closedloop.
Simulink BMS Design -
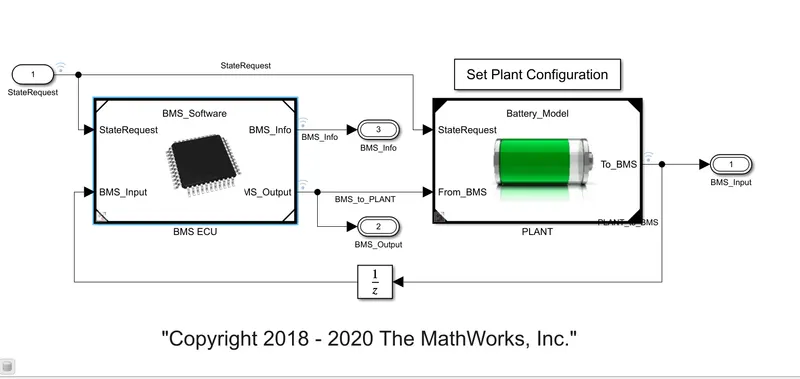
The BMS model is a combination of various subsystem models -
- The BMS ECU.
- BMS plant.
- The test hardness Dashboard.
BMS Plant - By clicking on the plant sub-system in the BMS model we can get the below shown BMS plant. The battery pack in the plant model having the input as balance command from the BMS and have the outputs as cell level voltage, total pack voltage, total pack current, cell temperatures and battery +ve and -ve terminals.
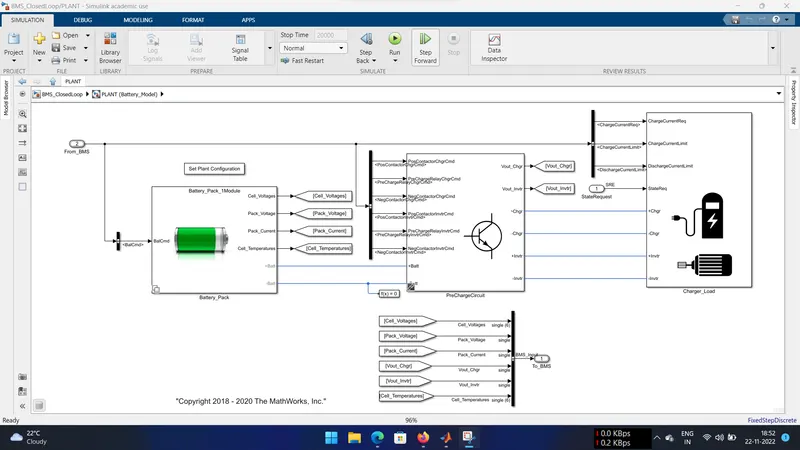
Battery pack - Consists of the cell with some configurations of voltage and capacity.
Precharge circuit - It is used limit the Inrush current to slowly charge the downstream capacitance.
Charger and Load - The Charger subsytem is with controlled current source which charges the battery according to the BMS state and drive load subsystem consist of load requirements of the drive cycle which draws the current and discharge the battery according to the load.
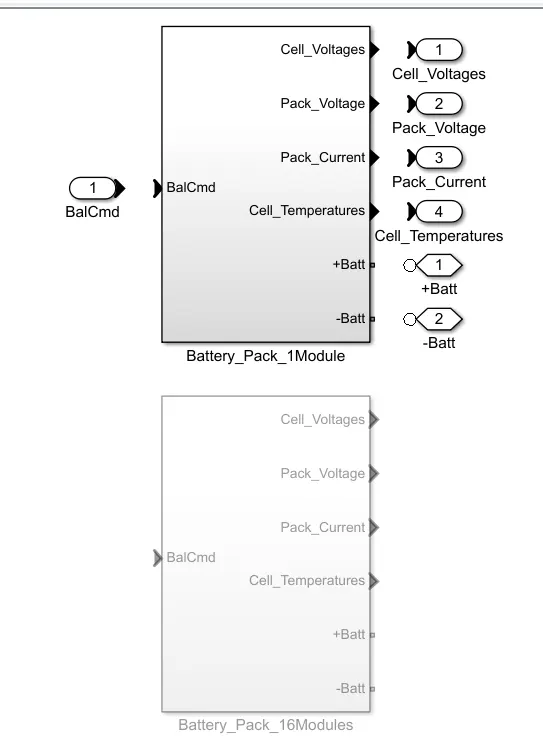
Inside of Battery_Pack - It mainly consists of two types those are battery pack 1module which having 6 cells in the 1 module that connected in series to each other which have 6 +ve terminals of each cell and 1 -ve terminals which goes to ground. By this series connection the voltage in each cell is calculated as total pack voltage and the current remains same.
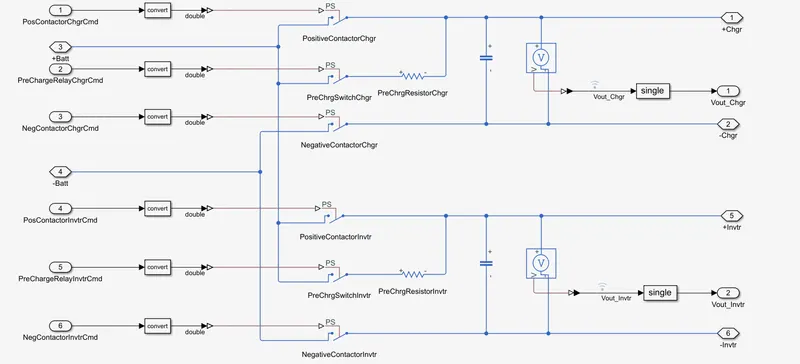
Inside of PreCharge_Circuit - This battery and the cell +ve and-ve terminals are connected to the pre charger circuit which is connected between the charge or load and battery to not to affect by over charge and over current which is act as a transistor.
Here a pre charger switching charge is connected in between the positive and negative contactor charger with the pre charge resistor in the charge side. As the same in the inverter side also the pre charger is connected between positive and negative contactor through resistor. Based on the given condition the charger or the inverter are connected through the resistor.
When they connected first the negative contactor is connected then it flows to the pre charged switch after that it flows to positive contactor charge through the high levelled resistor for the time delay operations if there is any fault observed in this circuit the pre charge is disconnects and it cut off with the positive contactor for the protection purpose.
BMS ECU - BMS ECU is the software like unit which controls,protects,balance and manage the battery,
It consists of subsystems,
State Machine - This is state machine, which gets the input from the state request,based on the state request state machine goes through the logic of charging,discharging,balancing by open the contactors of the battery,inverter and monitor the fault states and give the BMS output.
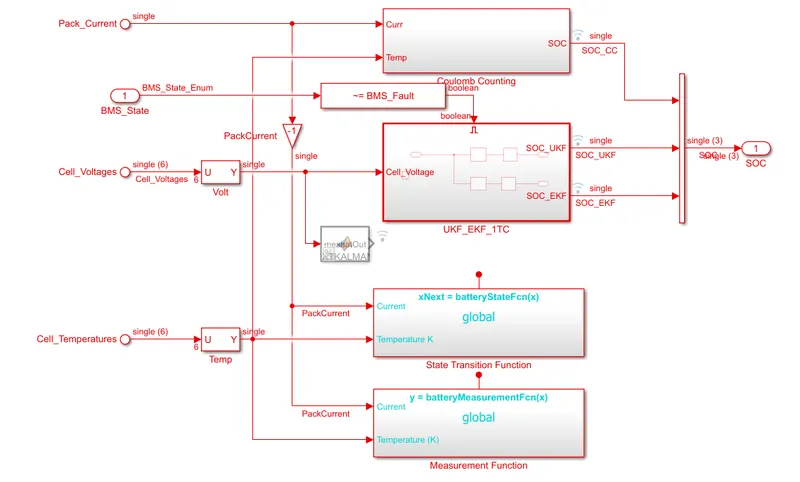
SOC Estimation - SOC is accurately estimated by coulomb counting and using the Kalman filters.
Balancing Logic - This is the subsystem which consist of state machine which will balance the cell according to the BMS state,It will activate balacing or deactivate the balancing according to the BMS state requirements.
Test Harness Dahsboard -
Test hardness dashboard is a model which is used to test BMS model outputs by changing the values of the given input to the BMS. By changing the test conditions, we can observe the results in the form of the graph in the scope.
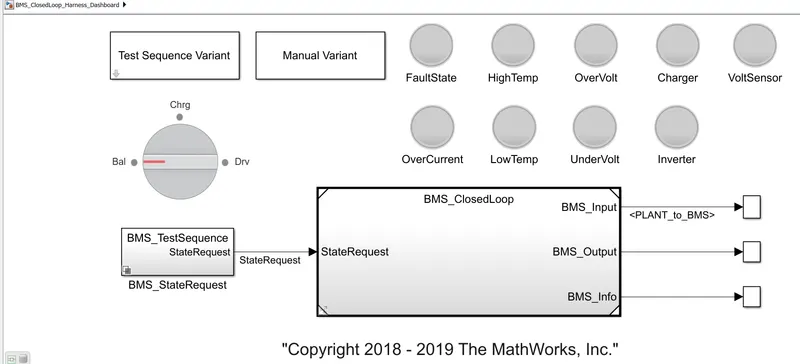
There are three operating conditions in this model which the battery run in these 3 operations when it is on those are driving, charging and balancing.
The 3 different test case conditions in this model is used to find out the results which can be selected by the test sequence variant sub system which look as shown,
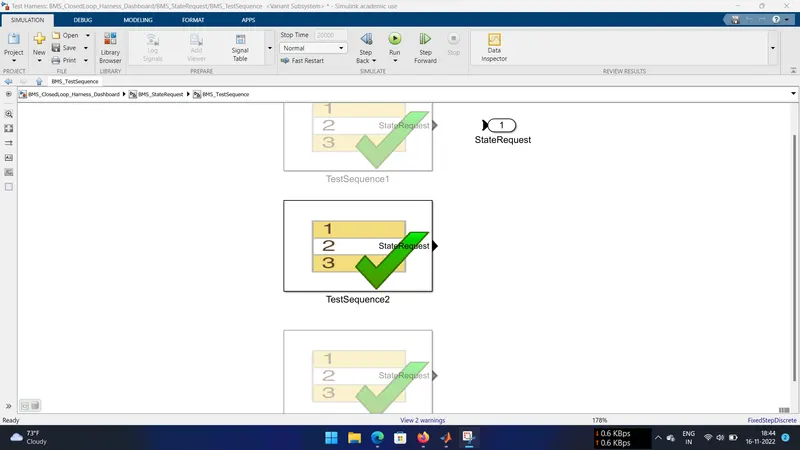
Once the test case number is selected then Test Sequence Variant subsystem run the model, now the model will run 20000 seconds (time duration is default). When the simulation starts the output result graphs will open.
Output Graphs consists of the following -
- Cell voltage.
- Cell temperature.
- SOC (state of charge).
- Pack current.
- BMS (battery manageent syestem) state.
- Balancing Command.
Test Case #1 -
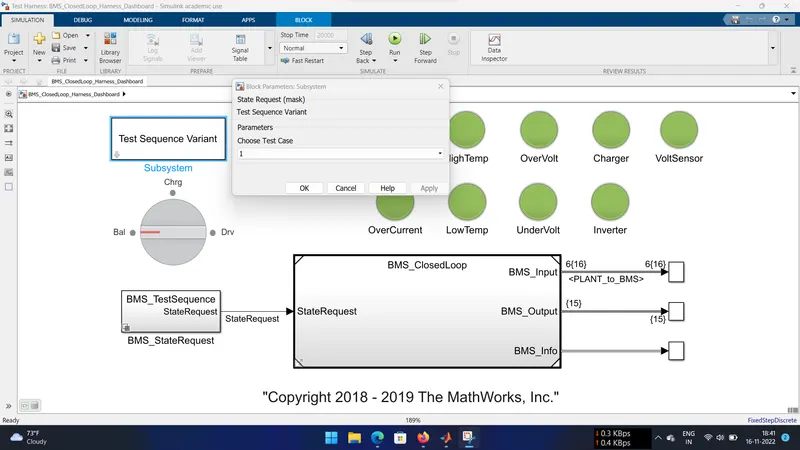
Here we observe that LED lights indicate all in green only which means that there are no issues in the model so the simulation can without fault.
Output Graph -
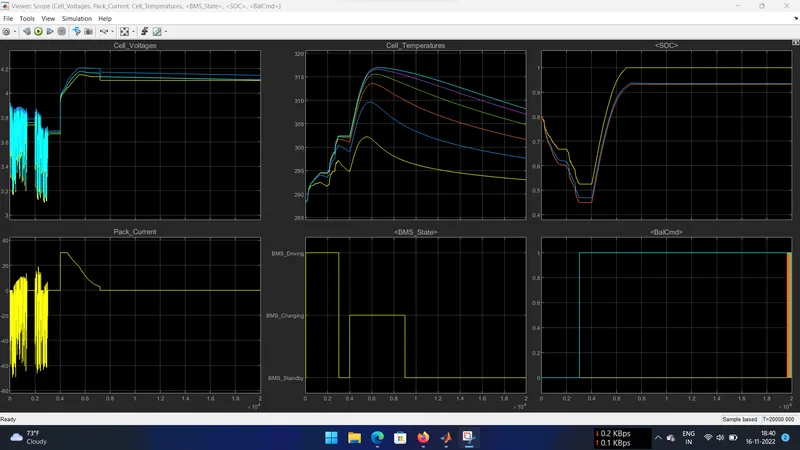
Observations -
Driving State -
- Driving state discharges of all the cells and its varies in the range of 3.1 to 3.9 V.
- Cell temprature increases from 288K to 302 K.
- SOC also reduces from 80 to 45 %.
Balancing State -
- Modules are in standby mode and they are having constant voltage near about 3.7V.
- Cell temperature reduces slowly.
- SOC is also constant.
Charging and Balancing State -
- Constant current mode with current of nearly 30A and then the constant voltage charging starts and current reduces from 30A to 2.5 A.
- Cell temperature reduces slowly.
- SOC also increases from 45% to 94%.
Post Charge Balancing State -
- After 9000 sec the post cell balancing starts under standby mode.
- Cell temperature reduces and reach the ambient temperature.
- SOC remains constant to 94%.
Test Case #2 -
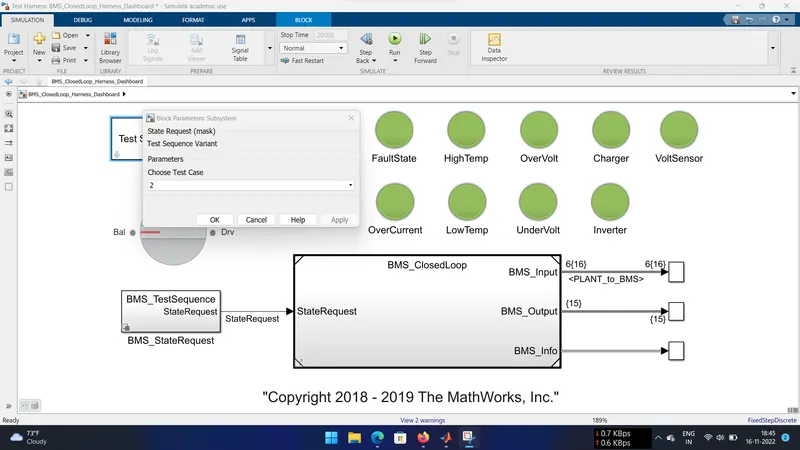
The Lamp indication were green for all states which means the model is in good condition and no fault is occured.
Output Graph -
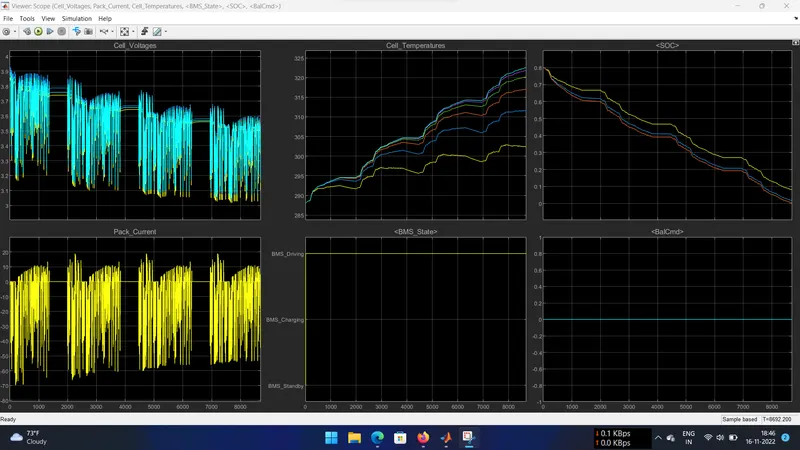
Observations -
- The cell voltage varies from 3.9 V to 3.05 volt which is cut off voltage of cell and the entire cell is drained upto 8692 sec.
- Cell temperatures varies from 288K to 323K.
- SOC reduces from 80% to 0% (cell got fully drained) in the drive mode under 8692 sec.
- Some stand by mode conditions are in between the drive modes.
- Entire sequence is performing in drive mode as shown from the above plot.
- Balancing of cells are not performed as shown as balance states are in 0 for entire drive mode.
Test Case #3 -
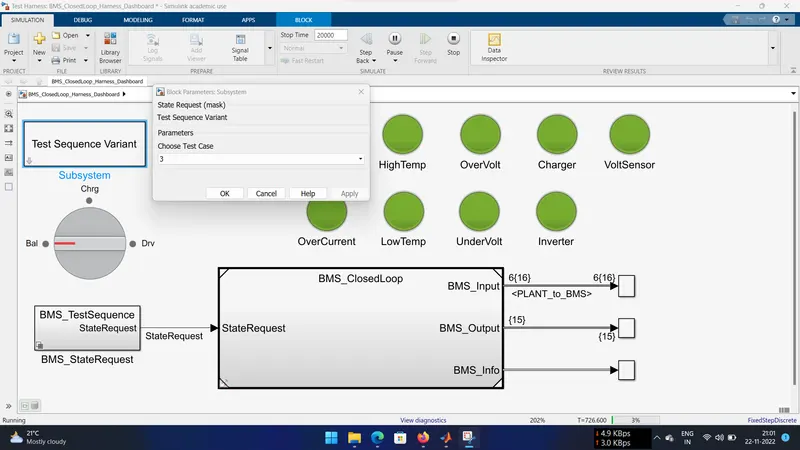
The Lamp indication were green for all states which means the model is in good condition and no fault is occured.
Output Graph -
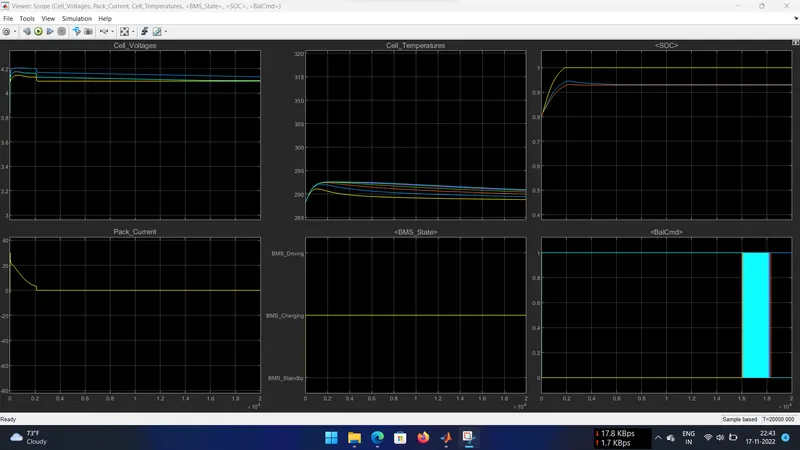
Observations -
Charging State -
- Cell Voltages increases intially and after 2000 sec they got constant.
- Pack current initally starts from 0 to 30A and then start decreasing when the constant voltage mode is there to 2.5 A and got full charged upto 2000 sec.
- SOC was initally 80% and in 2000 sec it got fully charged 100%.
- Cell temperature starts to incraeses initally and when battery got fully charged then decrease down to the ambient temperature.
- Entire battery pack sequence is operating in charging mode only as shown above.
- Balancing of all cells is done at end of simulation.
Coulomb Counting -
The coulomb counting method is also known as the battery current integration method. In this method, a discharging/charging current I(t) is measured and integrated over the period of time to calculate the amount of energy remaining inside the battery. This coulomb counting is used to calculate the SOC in the Battery Management System which gives accurate values but not much than Kalman Filter.
SOC - SOC stands for the state of charge of a battery. SOC represents the amount of energy left inside the battery with respect to the total amount of energy in a battery at the Fully charged condition.
The easiest method to calculate the SOC of a battery is by using a battery voltage translation method. This method is not accurate but helps to approximately and quickly calculate SOC and can be used in devices like power banks where SOC is shown in range and not the exact percentage.

SOC(t-1) = SOC at previous time step
here,
t = current time step
t-1 = previous time step
Q = Charge capacity of the battery
SOC Estimation Block in Simulink -
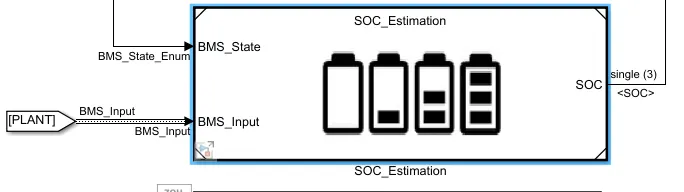
SOC is being estimated by
- Coulomb counting method.
- Unscented Kalman filter.
- Extended laman filter.
Inside of SOC_Estimation Block -
SOC Estimation sub system which is used to calculate the coulomb counting by using some blocks which as shown below
BMS implementaion of Coulomb Counting -
In this method, a discharging/charging current I(t) is measured and integrated over time to calculate the amount of energy remaining inside the battery.
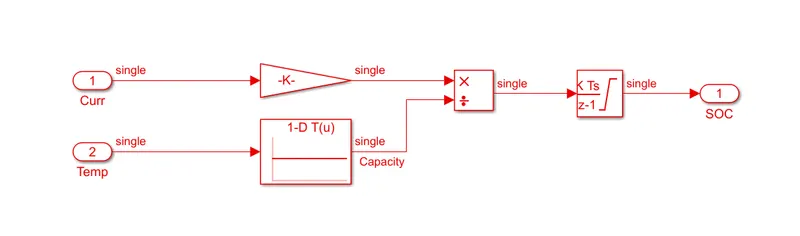
In the coulomb counting model, the pack current and temperature are the inputs for this model. The pack current is feed to the gain block with the vlue of 1/3600 to convert current into Ah.
The temperature is feed to the 1-D lookup table to give the inputs to divide block from the temperature input block. The Ah pack current and temperature get divided in the divide block and the output from the devide block is connceted to the Discrete- time integrator block to integrate the devided current and temperature signals. From the output of discrete-time integrator block we can get the desired final SOC (state of charge).
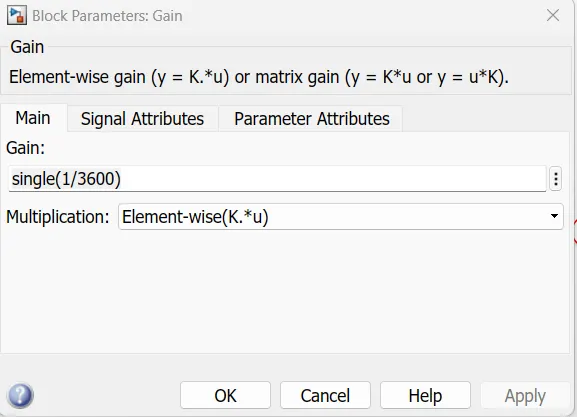
Discrete time integrator block and its configuration -
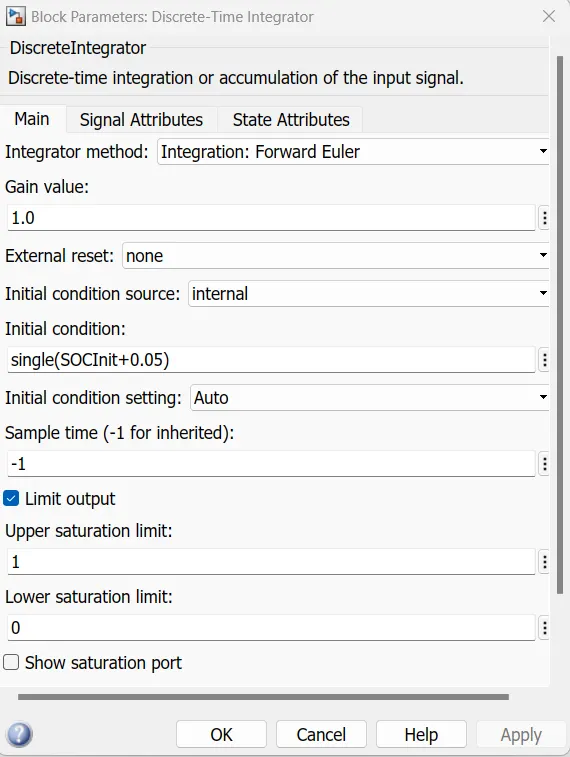
Thus the BMS system implements the SOC equation using above blocks to estimate the SOC.
Conclusion -
Sucessfully Simulated and Explained all three cases from harness dashboard and explained the role of Coulomb Counting for SOC estimation.