Project 1 - Parsing NASA thermodynamic data
Aim - Write a program in Matlab to parse a NASA's thermodynamic data file and to calculate the thermodynamic properties of the given gas species.
Objective -
1. To extracts 14 co-efficients and calculate the enthalpy, entropy and specific heats for all the species in the data file.
Where, R is the universal gas constant, T is the temeprature.

2. To calculate molecular weight of each species and display in command window.
3. To plot the Enthalpy, Entropy, and Cp for the local temperature range (low temperature: high temperature) specific for each species.
4. To save the plots as images with appropriate names and dump them in separate folders for each species with suitable name automatically.
Principle: -
NASA came up with polynomials that can be used to evaluate thermodynamic properties such as Cp, H, and S. They have also documented the coefficients that are required to evaluate these polynomials for 1000+ species.
Steps Followed -
1. Open the file and parse the file ,'fopen' is used to open a file.
2. To navigate throughout the file and using (fgetl) command.
3. Reading the header file and read the file line by line.
4. Used String split command to generate cell array.
5. The function for Cp, H, S is coded to calculate them by reading the values from the given data file.
6. Molecular weight is calculated by using the molecular weight function and the same is displayed on command window.
7. The plots for Cp, H, S are created for each species and saved in current directory folder in jpg format to access the species data with images.
8. Creating individual folders for different molecules and saves plots for specific heat, enthalpy, and entropy in the same folder.
Explaining the functions -
Entropy: -
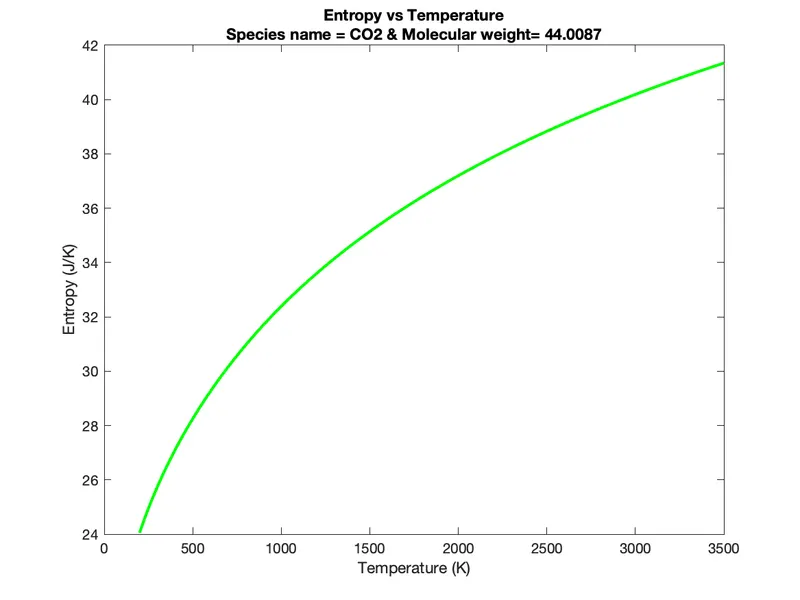
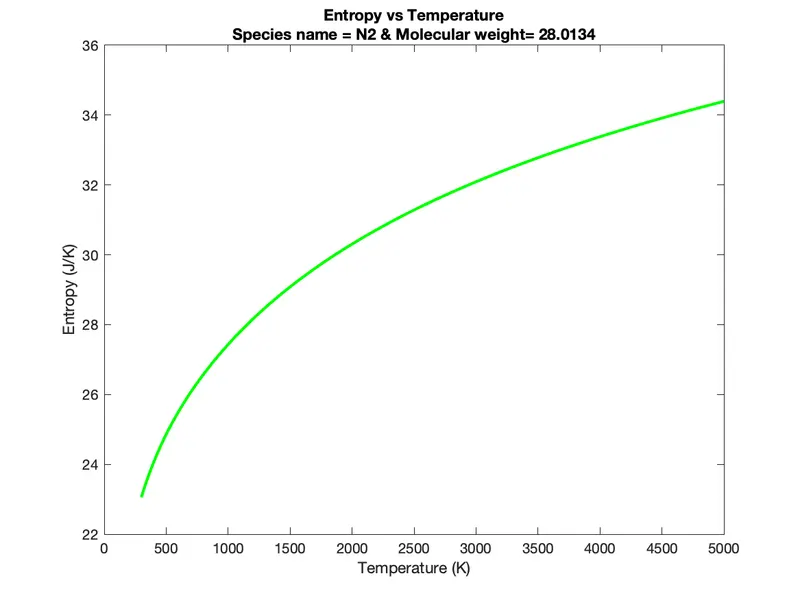
Entropy is a scientific concept, as well as a measurable physical property that is most commonly associated with a state of disorder, randomness, or uncertainty.

Enthalpy: -
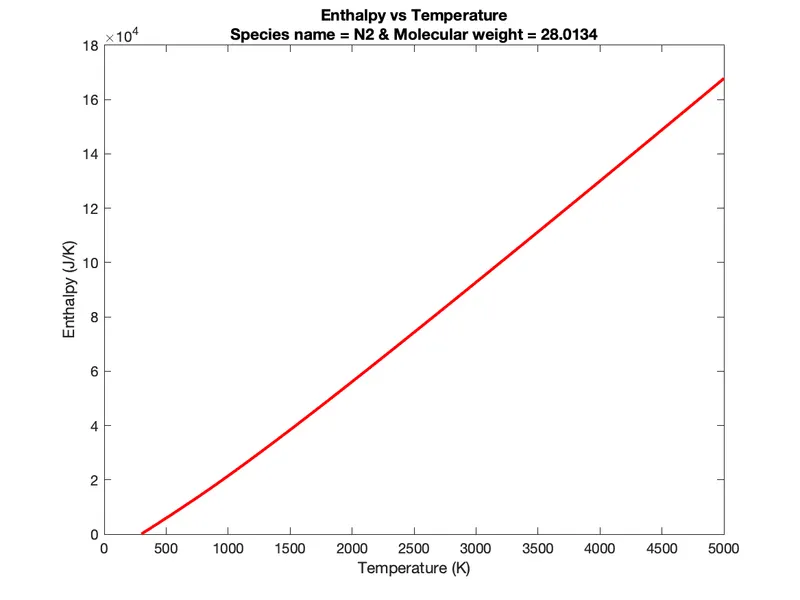
is a property of a thermodynamic system, defined as the sum of the system's internal energy and the product of its pressure and volume.It is a convenient state function standardly used in many measurements in chemical, biological, and physical systems at a constant pressure.

Specific Heat(Cp): -
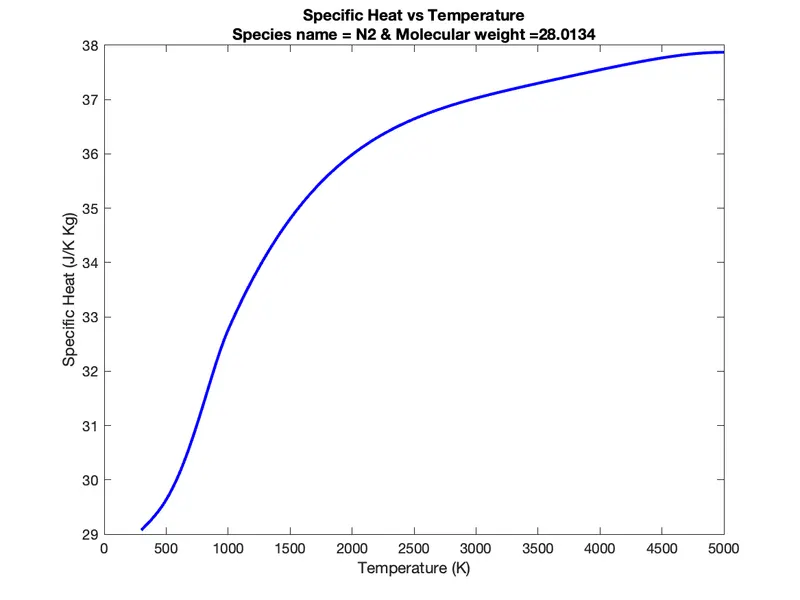
In thermodynamics, the specific heat capacity (Cp) of a substance is the heat capacity of a sample of the substance divided by the mass of the sample.

PROGRAM Codes -
%Parsing NASA Thermodynamic Data.

clear all
close all
clc

f1 = fopen('THERMO.dat','r');

fgetl(f1);
fgetl(f1);
fgetl(f1);
fgetl(f1);
fgetl(f1);

% Extracting all species data

for i = 1:53

% Extracting name of gas species

A = fgetl(f1);
z = findstr(A,' ');
species_name = A(1:z(1)-1);

% Reading the sixth line
% Reading the species name
% Finding out the species name

% Extracting local temperatures of gas species

a = findstr(A,'.');
t1 = A((a(1)-3):a(1)+3);
t1 = str2num(t1);
t2 = A(a(3)-4:a(3)+3);
t2 = str2num(t2);
t3 = A(a(2)-4:a(2)+3);
t3 = str2num(t3);

% t1 = Low Temperature
% t2 = Mid Temperature
% t3 = High Temperature
% Finding string from the line
% Assigning 't' variable for the local temperatures
% Converting string to number
% Extracting co-efficient of gas species


B = fgetl(f1);
b = findstr(B,'E');
a1 = B(1:b(1)+3);
a1 = str2num(a1);
a2 = B(b(1)+4:b(2)+3);
a2 = str2num(a2);
a3 = B(b(2)+4:b(3)+3);
a3 = str2num(a3);
a4 = B(b(3)+4:b(4)+3);
a4 = str2num(a4);
a5 = B(b(4)+4:b(5)+3);
a5 = str2num(a5);
C = fgetl(f1);
c = findstr(C,'E');
a6 = C(1:c(1)+3);
a6 = str2num(a6);
a7= C(c(1)+4:c(2)+3);
a7 = str2num(a7);
a8 = C(c(2)+4:c(3)+3);
a8 = str2num(a8);
a9 = C(c(3)+4:c(4)+3);
a9 = str2num(a9);
a10 = C(c(4)+4:c(5)+3);
a10 = str2num(a10);
D = fgetl(f1);
d = findstr(D,'E');
a11 = D(1:d(1)+3);
a11 = str2num(a11);
a12 = D(d(1)+4:d(2)+3);
a12 = str2num(a12);
a13 = D(d(2)+4:d(3)+3);
a13 = str2num(a13);
a14 = D(d(3)+4:d(4)+3);
a14 = str2num(a14);
% First 7 are high temperature co-efficients from a1 to a7
% Second 7 are low temperature co-efficients from a8 to a14
% Creating the range of low and high values of local temperatures
T = linspace(t1,t3,1000);
R = 8.314;                  % Universal gas constant in j/mol.k
% Calculation for Specific heat, Enthalpy and Entropy


for i = 1:length(T)
    if T(i)>t2
        Cp(i) = (a1 + a2.*T(i) + a3.*T(i).^2 + a4.*T(i).^3 + a5.*T(i).^4)*R;
        H(i) = (a1 + (a2.*T(i))/2 + (a3.*T(i)^2)/3 + (a4.*T(i).^3)/4 + (a5.*T(i).^4)/5 + (a6./T(i)))*R.*T(i);
        S(i) = a1.*log(T(i)) + a2.*T(i) + (a3.*T(i)^2)/2 + (a4.*T(i)^3)/3 + (a5.*T(i).^4)/4 + a7;
    else
        Cp(i) = (a8 + a9.*T(i) + a10.*T(i).^2 + a11.*T(i).^3 + a12*T(i).^4)*R;
        H(i) = (a8 + (a9.*T(i))/2 + (a10.*T(i).^2)/3 + (a11.*T(i).^3)/4 + (a12.*T(i).^4)/5 + (a13./T(i)))*R.*T(i);
        S(i) = a8.*log(T(i)) + a9.*T(i) + (a10.*T(i)^2)/2 + (a11.*T(i)^3)/3 + (a12.*T(i).^4)/4 + a14;
    end
end


% Molecular weight calculation
elements = ['H','C','O','N','A','S'];                           % Declaring species elements
atomic_weight = [1.0079 12.0107 15.999 14.0067 39.948 32.065];  % Declaring the atomic weight value
mol_mass = 0;


for l = 1:length(species_name)
    for m = 1:length(atomic_weight)
        if strcmp(species_name(l), elements(m))
            mol_mass = mol_mass + atomic_weight(m);
            position = m;
        end
    end
    n = str2double(species_name(l));
    if n>1
        mol_mass = mol_mass + atomic_weight(position)*(n-1);
    end
end

% Printing the molecular weight of the gas species in the command window
sprintf('Molecular Weight of %s is %f u',species_name,mol_mass)
% Creating a folder to save the plots


directory_curr = pwd;
mkdir(species_name)         % Creating a new folder with the species name in the main folder
cd(sprintf(species_name))   % Changing the directory to the folder of the species name

% Plotting specific heat vs temperature
figure(1)
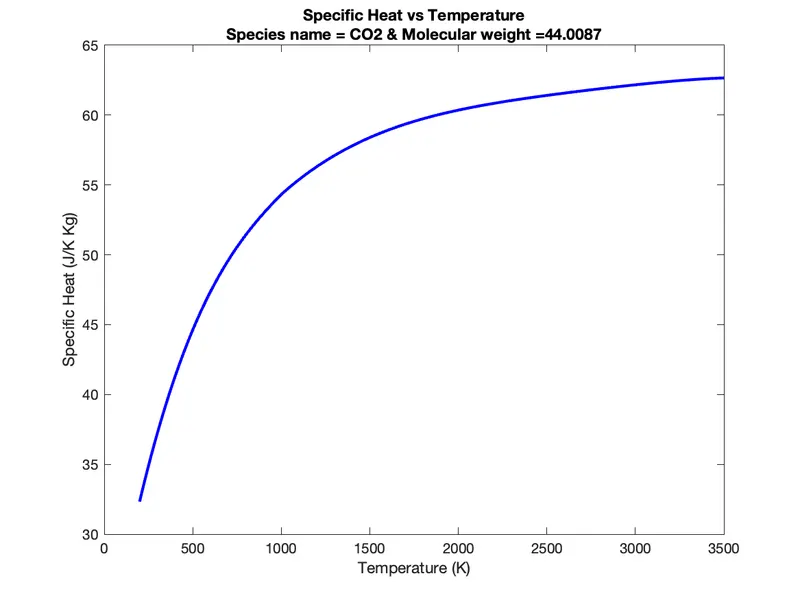
plot (T,Cp, 'color','b','linewidth',2)
xlabel('Temperature (K)')
ylabel('Specific Heat (J/K Kg)')
title({'Specific Heat vs Temperature',['Species name = ',species_name,' & Molecular weight =',num2str(mol_mass)]});
saveas(figure(1),'Cp vs Temp.png')

% Plotting enthalpy vs temperature
figure(2)
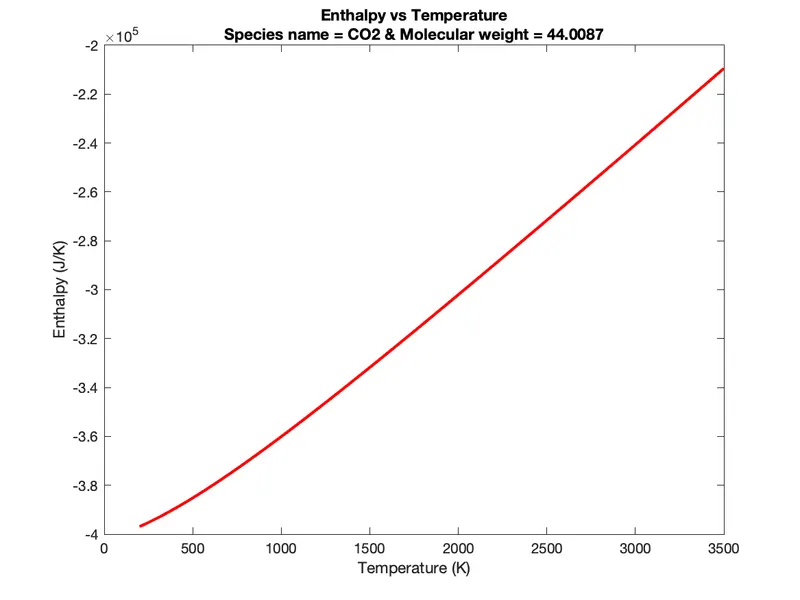
plot (T,H, 'color', 'r','linewidth',2)
xlabel('Temperature (K)')
ylabel('Enthalpy (J/K)')
title({'Enthalpy vs Temperature',['Species name = ',species_name,' & Molecular weight = ',num2str(mol_mass)]});
saveas(figure(2),'Enthalpy vs Temp.png')
% Plotting entropy vs temperature
figure(3)
plot (T,S, 'color', 'g','linewidth',2)
xlabel('Temperature (K)')
ylabel('Entropy (J/K)')

title({'Entropy vs Temperature',['Species name = ',species_name,' & Molecular weight= ',num2str(mol_mass)]});
saveas(figure(3),'Entropy vs Temp.png')

% To change the current directory to the main folder

cd(directory_curr);
end
Explaining the codes-
-First we have to open the given file 'THERMO.dat' file using fopen command and then we will extract all the information provided in the file using fgetl command.
-Then we have to get global temperature by using strslplit command and then we skip some lines using the fget command.
-Now we use 'for' loop command to get all temperature and coefficients that are presnt in the given file.
-For getting temperature and coefficients we use finstr command inorder to input the accurate spot and specifying it so that we can get all the data.
-Now the datas which are obtanied from the file will be of string format which we need to convert into numbers by using str2num command.and by this we will get the temperature and coefficient of all the species.
-Now we make use of if command to create file for each species, in case if the folder exist it will simply save as plot or else it will create a folder to save the plot.
-Now the specific heat,enthalpy ,entropy function is calculated and gets plotted.
-The three figures are plotted using plot command and each species name is displayed using title command.And further it will named using xlabel and ylabel command.
-Now we are saving the plots as our images using save command to seperate directories.
-Finally we will close the file using fclose command.
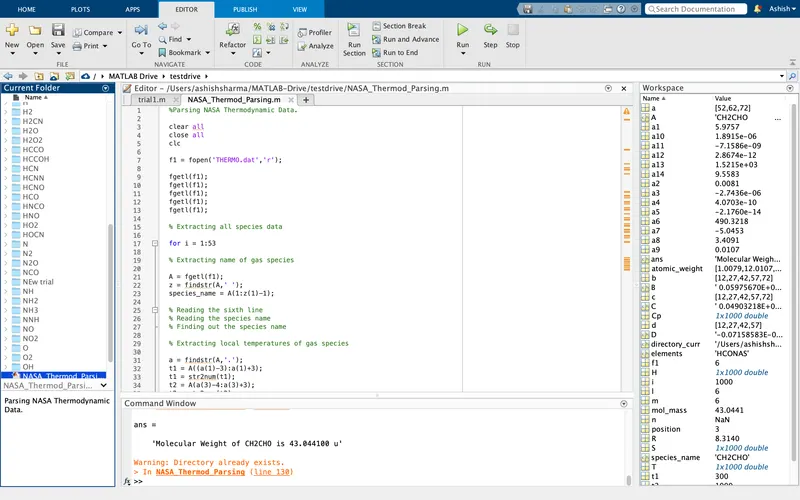
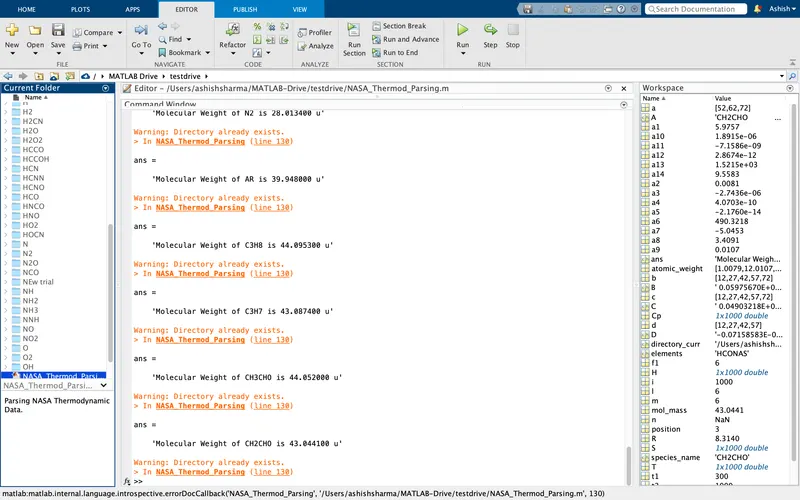
INDIVIDUAL Species Graphs/Details can be accessed by Google Drive Link - Google_Drive Link
COMMAND WINDOW O/P -
ans =
'Molecular Weight of O is 15.999000 u'
ans =
'Molecular Weight of O2 is 31.998000 u'
ans =
'Molecular Weight of H is 1.007900 u'
ans =
'Molecular Weight of H2 is 2.015800 u'
ans =
'Molecular Weight of OH is 17.006900 u'
ans =
'Molecular Weight of H2O is 18.014800 u'
ans =
'Molecular Weight of HO2 is 33.005900 u'
ans =
'Molecular Weight of H2O2 is 34.013800 u'
ans =
'Molecular Weight of C is 12.010700 u'
ans =
'Molecular Weight of CH is 13.018600 u'
ans =
'Molecular Weight of CH2 is 14.026500 u'
ans =
'Molecular Weight of CH2(S) is 46.091500 u'
ans =
'Molecular Weight of CH3 is 15.034400 u'
ans =
'Molecular Weight of CH4 is 16.042300 u'
ans =
'Molecular Weight of CO is 28.009700 u'
ans =
'Molecular Weight of CO2 is 44.008700 u'
ans =
'Molecular Weight of HCO is 29.017600 u'
ans =
'Molecular Weight of CH2O is 30.025500 u'
ans =
'Molecular Weight of CH2OH is 31.033400 u'
ans =
'Molecular Weight of CH3O is 31.033400 u'
ans =
'Molecular Weight of CH3OH is 32.041300 u'
ans =
'Molecular Weight of C2H is 25.029300 u'
ans =
'Molecular Weight of C2H2 is 26.037200 u'
ans =
'Molecular Weight of C2H3 is 27.045100 u'
ans =
'Molecular Weight of C2H4 is 28.053000 u'
ans =
'Molecular Weight of C2H5 is 29.060900 u'
ans =
'Molecular Weight of C2H6 is 30.068800 u'
ans =
'Molecular Weight of CH2CO is 42.036200 u'
ans =
'Molecular Weight of HCCO is 41.028300 u'
ans =
'Molecular Weight of HCCOH is 42.036200 u'
ans =
'Molecular Weight of H2CN is 28.033200 u'
ans =
'Molecular Weight of HCN is 27.025300 u'
ans =
'Molecular Weight of HNO is 31.013600 u'
ans =
'Molecular Weight of N is 14.006700 u'
ans =
'Molecular Weight of NNH is 29.021300 u'
ans =
'Molecular Weight of N2O is 44.012400 u'
ans =
'Molecular Weight of NH is 15.014600 u'
ans =
'Molecular Weight of NH2 is 16.022500 u'
ans =
'Molecular Weight of NH3 is 17.030400 u'
ans =
'Molecular Weight of NO is 30.005700 u'
ans =
'Molecular Weight of NO2 is 46.004700 u'
ans =
'Molecular Weight of HCNO is 43.024300 u'
ans =
'Molecular Weight of HOCN is 43.024300 u'
ans =
'Molecular Weight of HNCO is 43.024300 u'
ans =
'Molecular Weight of NCO is 42.016400 u'
ans =
'Molecular Weight of CN is 26.017400 u'
ans =
'Molecular Weight of HCNN is 41.032000 u'
ans =
'Molecular Weight of N2 is 28.013400 u'
ans =
'Molecular Weight of AR is 39.948000 u'
ans =
'Molecular Weight of C3H8 is 44.095300 u'
ans =
'Molecular Weight of C3H7 is 43.087400 u'
ans =
'Molecular Weight of CH3CHO is 44.052000 u'
ans =
'Molecular Weight of CH2CHO is 43.044100 u'
Plots For O2 -
Plots For N2 -
Plots For CO2 -
Conclusion: -
1. Parsing of the file is sucessfully shown.
2. Ploted for 53 molecules and stored seperatly.
3. All three plots(Cp, H, S) were saved in a folder for a molecule and shown in Graphs.
4. Molecular weight is generated for the 53 molecules and shown in the command window.
References -
Best way to parse text file - (mathworks.com)
Parsing a text file in matlab and accessing contents of each sections - (mathworks.com)