Week 7 State of charge estimation
1)
Aim :
To simulate the 3 test cases from harness dashboard and write a detailed report on the results
From the given model :-
BMS CLOSED LOOP HARNESS DASHBOARD:
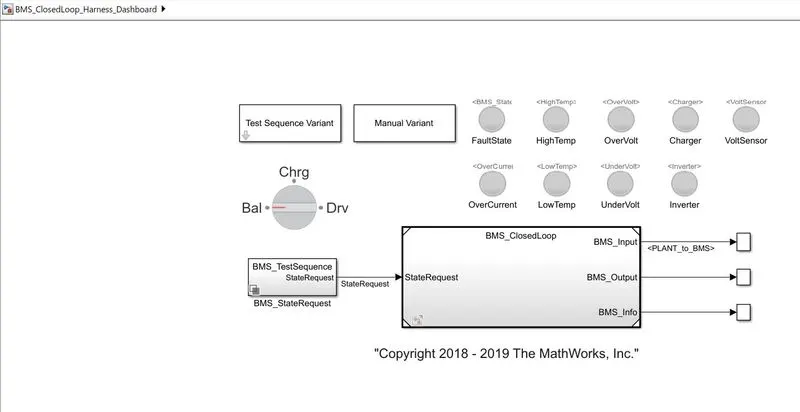
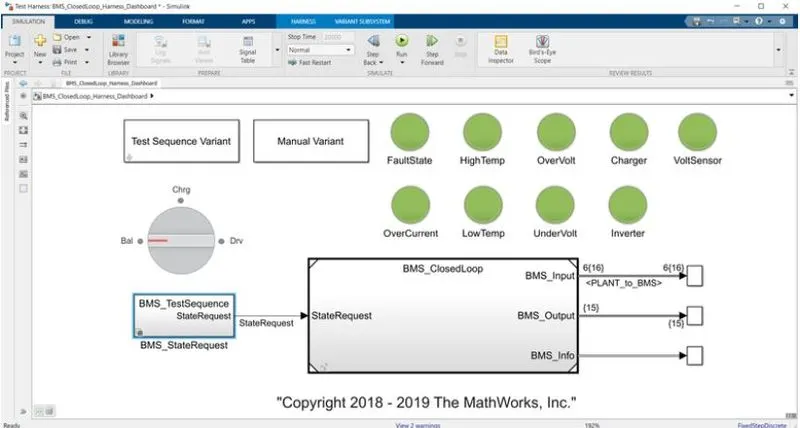
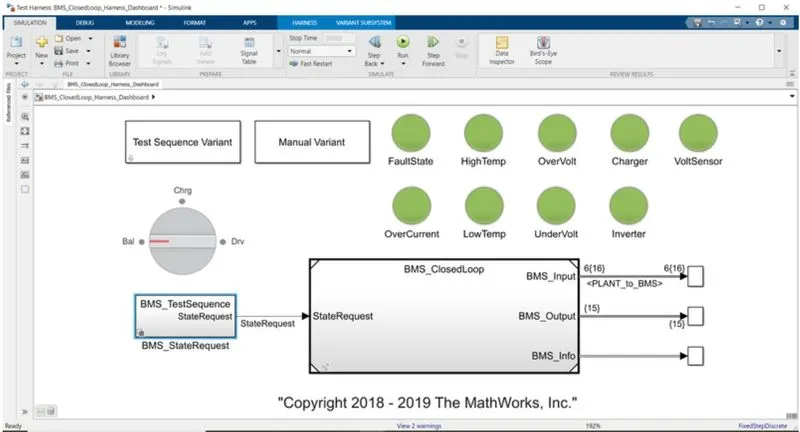
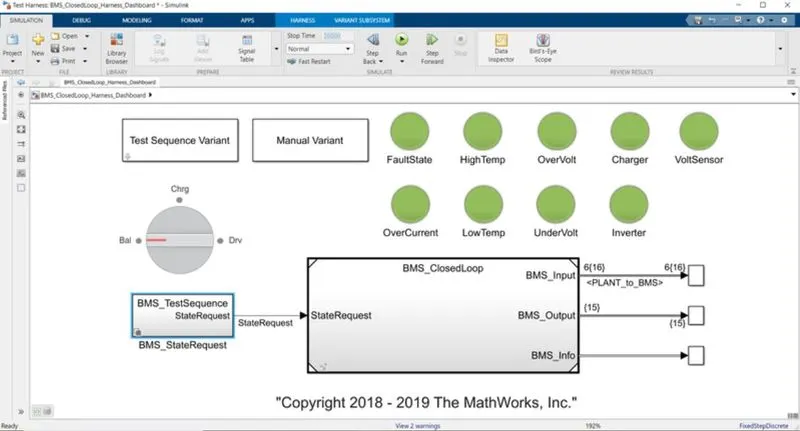
It has a subsystem called Test Sequence Variant, which has three test sequences and allows the user to choose the one they require. Subsystem 2 is the manual version. If this block is active, we must choose the manual test sequence by turning a rotary switch that has three conditions: charging, driving, and battery. The subsystem known as BMS status request serves as the request input to the BMS closed loop and provides information on the test sequence that is chosen, whether it is an automatic test sequence or a manually chosen sequence. It has indicator LEDs for the battery's high temperature, overvoltage, charger, voltage sensor, overcurrent, low temperature, undervoltage, and inverter states. Red light indicates a problem or bad condition with the battery system, while green light indicates a healthy battery.
BMS ECU :
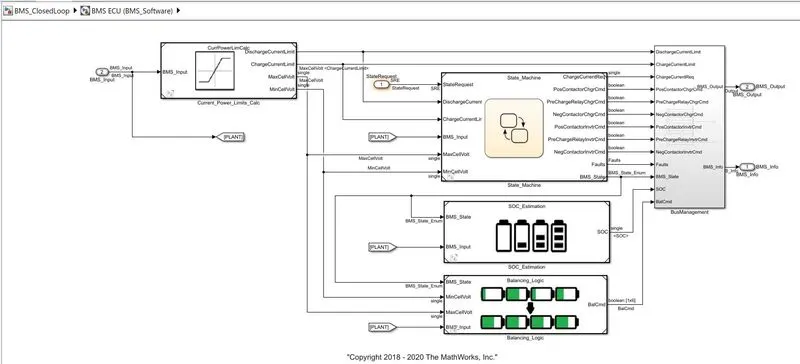
The software-like BMS ECU manages, balances, protects, and controls the battery. It consists of a block that regulates and calculates the charge and discharge current limits for each subsystem. Cell voltage ranges from minimum to maximum. state machine - This is a state machine that receives input from the state request, processes the state request based on charging, discharging, and balancing logic by opening the battery and inverter contactors, checks for fault states, and outputs the BMS. SOC estimation - By coulomb counting and utilising the Kalman filters, SOC is precisely estimated. It will activate or deactivate balacing in accordance with the BMS state requirements. Balancing logic is a subsystem that consists of a state machine that balances the cell in accordance with the BMS state.
BMS CLOSED LOOP :
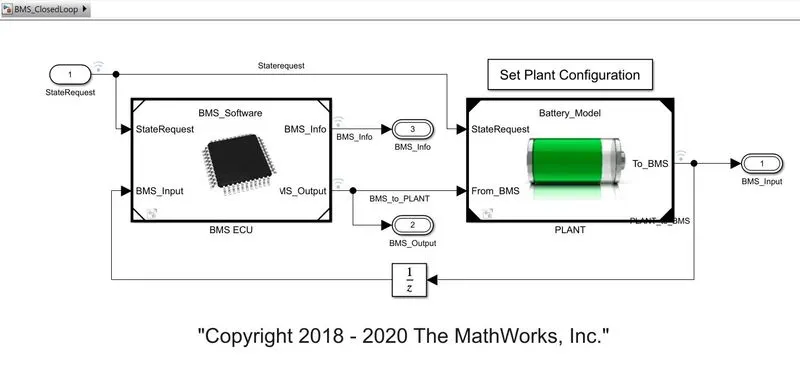
The closed loop is made up of the two subsystems BMS ECU and Plant battery, which come in two configurations of one and sixteen battery modules, respectively.
PLANT :
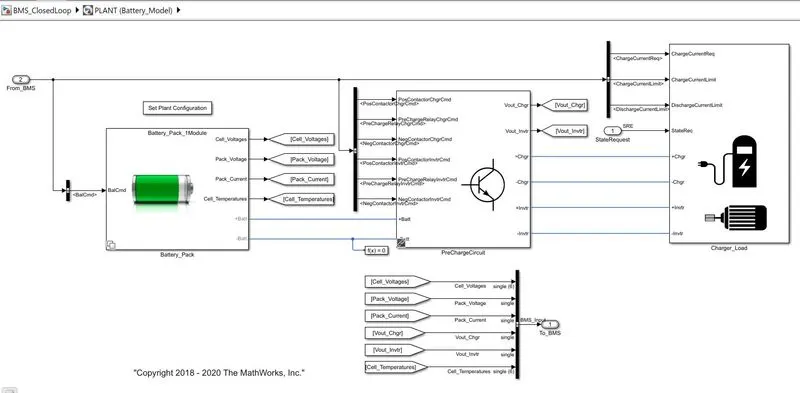
Battery packs are made up of cells that have different voltage and capacity configurations. Precharge circuit: This device controls the downstream capacitance's rate of charging while limiting inrush current. Charger and Load: The drive load subsystem consists of the required loads for the drive cycle, which draw current and discharge the battery in accordance with the load. The charger subsystem has a controlled current source that charges the battery in accordance with the BMS state. The scope expands once the compilation is successful. Measurements of cell voltages, cell temperatures, SOC, pack current, BMS State, and balancing command are included in the scope.
Simulate the three test scenarios from the harness dashboard and produce a thorough report on the outcomes for Task 1.
Results of case 1 :
Dashboard result
Scope :
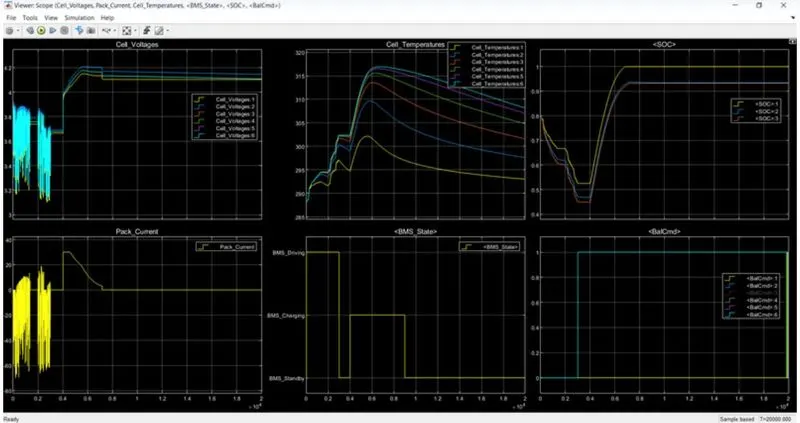
Driving state (0–3000 secs): For the first 3000 secs, all of the cells are in the driving state, which causes a discharge that ranges from 3.1 to 3.9 V. (min and max.). From 288 K to 302 K, the cell temperature rises. SOC decreases as well from 80% to 45%.
Charging and Balancing state (4000- 9000 sec): In the charging and balancing state (4000–9000 seconds), the cell voltages rise from 3.7 to nearly 4.2 V in constant current mode with current of almost 30 A, and then the constant voltage charging begins with current falling from 30 A to 2.5 A. Up to 9000 seconds, the cells are charged and balanced. As current flow decreases in the constant voltage mode, cell temperature likewise starts to rise exponentially up until the constant current area. SOC rises from 45% to 94% as well.
Balancing State (3000–4000 seconds): Cell balancing occurs after 3000 sec and 1000 secs, and the modules enter standby state with a constant voltage of roughly 3.7V. As there is no current flowing through the cells when balancing, cell temperature slowly decreases. SOC stays at 45% throughout this time as well.
Post charge balancing state (9000-2000 sec): Post cell balancing begins in standby mode after 9000 sec. In this state, the cell's temperature drops and it seeks to become closer to the surrounding temperature. SOC holds steady at 94%.
Results of case 2 :
Dashboard result
Scope :
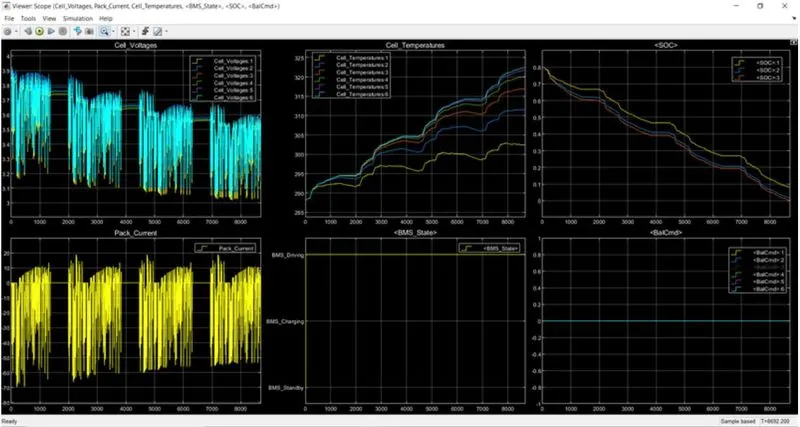
Driving State (0–1000 sec): The cell voltage varies between 3.9 V and 3.05 V, the cell's cutoff voltage, and the battery is completely depleted after 8692 sec. The range of cell temperatures is 288K to 323K. In the driving mode, SOC decreases from 80% to 0% (cell is totally drained) in less than 8692 seconds. Between the drive modes are a few stand-by mode conditions. As can be seen from the figure above, the entire sequence is operating in drive mode. As balance states are at 0 for the whole driving mode, cell balancing is not accomplished as depicted.
Results of case 3 :
Dashboard result
Scope :
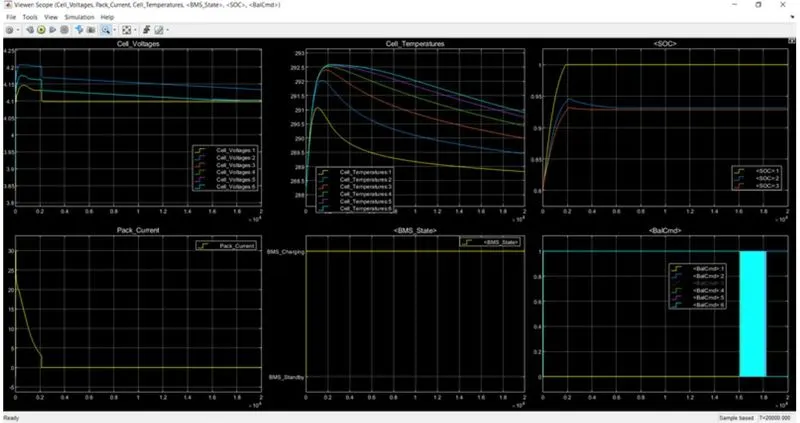
Driving State (0–20000 sec): Cell voltages increase from their initial values and become steady after 2000 seconds during the charging condition (0–2000000 sec). Initial pack current ranges from 0 to 30 A, and after the constant voltage mode is enabled, the pack current starts to decline to 2.5 A and is fully charged within 2000 seconds. SOC started out at 80% and reached 100% after 2000 seconds of charging. Initial cell temperature increases are followed by a drop to ambient temperature as the battery is fully charged. The entire battery pack sequence is functioning as shown above in the charging mode. At the conclusion of the simulation, all cells are balanced.
All three of the battery management system test sequences are simulated, evaluated for different attributes, and the outcomes are plotted and observed.
2)
Aim : By refering to the above model and explain how BMS implements coulomb counting for SOC estimation
SOC :
SOC refers to a battery's state of charge. SOC is a measurement of the remaining energy in a battery in relation to the total amount of energy present when the battery is fully charged. A user can calculate how much energy he can extract from a battery at a given moment and when to charge or stop charging a battery with the help of SOC. For a Li-ion battery, there is no direct way to calculate SOC, but there are a few different ways we can do it with the aid of some additional parameters. The battery voltage translation method is the simplest way to determine a battery's state of charge (SOC). Although not precise, this method aids in approximating and calculating SOC rapidly. It can be used with devices like power banks where SOC is displayed as a range rather than an exact percentage. For instance, a typical power bank displays SOC readings between 0 and 25%, 25 and 50%, 50 and 75%, and 75 and 100%. Due to this method's numerous drawbacks, more accurate techniques like the Coulomb counting method, fuzzy logic method, Kalman filter, RBF Neural network, fuzzy neural network, hybrid methods, etc., are required. Each method has its own restrictions on precision and complexity, so choosing the right one for SOC estimation requires careful consideration.
Coulomb counting :
Coulomb counting is a technique for monitoring the charge level of a battery pack. It computes the total amount of energy entering or exiting the battery pack by integrating the active flowing current (measured in amps) over time. As a result, a capacity that is typically expressed in Ah is produced.
Coulomb Counting Method :
The battery current integration method is another name for the coulomb counting technique. In this approach, the quantity of energy left in the battery is determined by measuring and integrating the discharging/charging current I(t). This approach measures the state of charge (SOC) at the previous time step SOC(t-1) and compares it to the amount of energy lost or added at the current time step to determine the amount of energy in the battery at the moment. Using the equation below, the SOC is estimated using the coulomb counting method.
SOC(t) = SOC(t - 1) + (I(t) / Qn) * δt
SOC(t-1) = SOC at previous time step
t = current time step
t-1 = previous time step
Q = Charge capacity of the battery
This method is more accurate and trustworthy than the voltage translational method, but it disregards factors like temperature, hysteresis, discharge rate, battery age, etc.
Coulomb counting method :
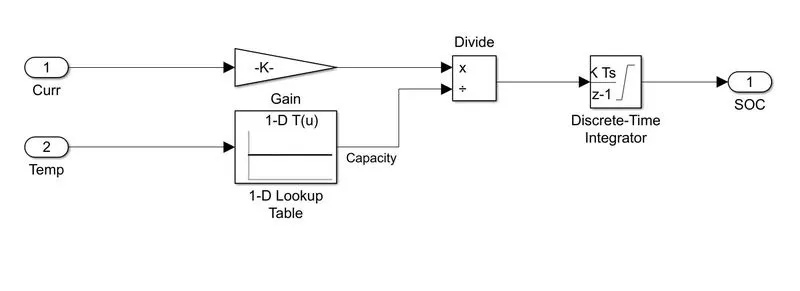
The soc equation mentioned above is put into practise by this block to calculate the SOC. In this approach, the quantity of energy left in the battery is determined by measuring and integrating the discharging/charging current I(t).
Conclusion :
For the three test sequences, the battery management system project model is downloaded, initialised in MATLAB, and simulated. All three of the battery management system test sequences are simulated, examined for different properties, and the results are plotted and monitored. The study of the Coulomb counting method and analysis of its application in the BMS to calculate the SOC.