Week 7 State of charge estimation
ANSWER:
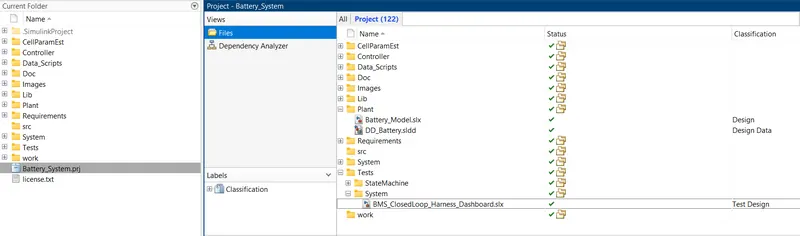
Simulink Model BMS_Closeloop_Hardness_Dashboard:
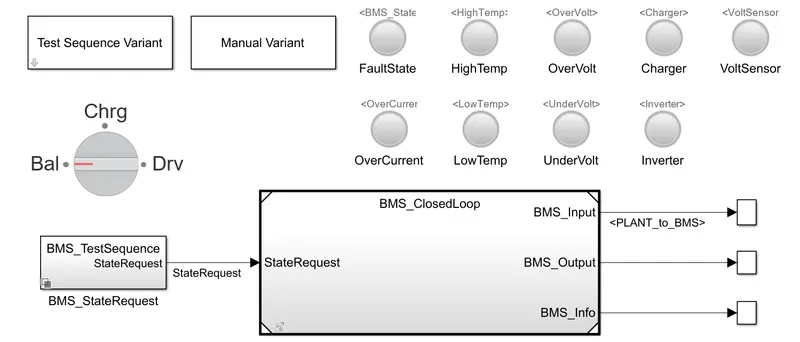
Blocks in model:
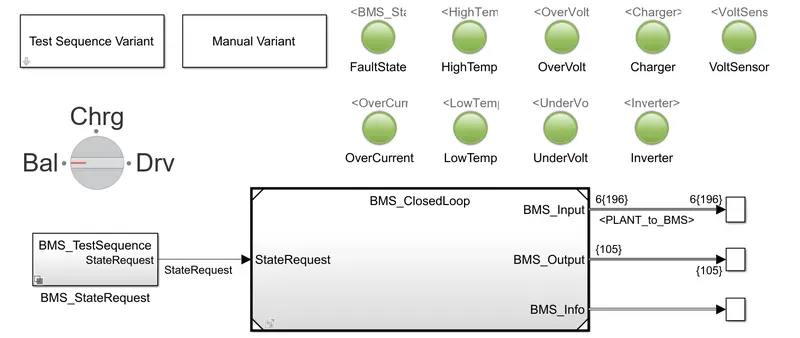
1)Dash board
- Test Sequence Varient(Selector).
- Manual Varient(Selector).
- BMS_Testsequence state request(Subsystem) to provide state request commands.
- Lamps to indicate Fault state,High temperature,Over voltage,Over current,charging ,voltage sensor operation,inverter operation,low temperature,Under voltage.If any fualt in these red indication will intimate us and all in good conditions indicated by green indication.
- Rotating switch for manual Varient changes while running simulation.
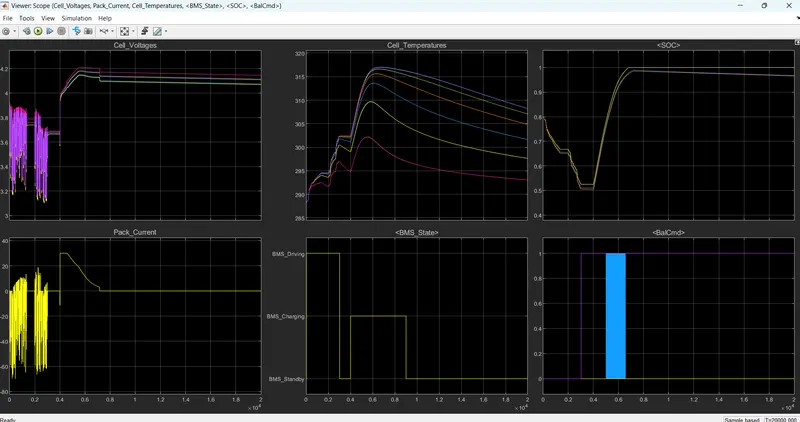
- In scope results the SOC of module,Module current,Individual cell voltages,Individual cell temperature,Battery state,Cell balancing states are seen as outputs.
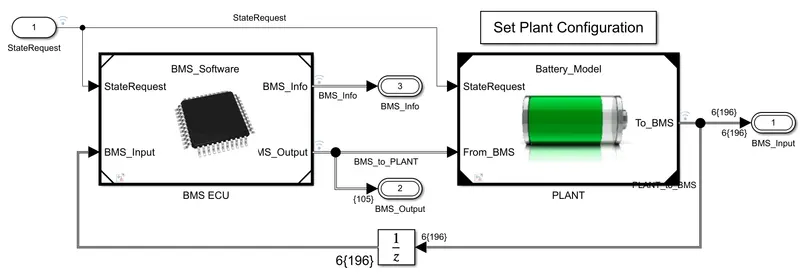
2) BMS_Closed loop
In this main block consist of two subsystems,BMS ECU and PLANT units.
The plant output from plant unit given as input to BMS ECU as BMS_input feedback loop.The state request is given to BMS ECU unit.
The BMS Output commands given as input to plant unit as 'From_BMS'.Alsp the state request is given to Plant unit.
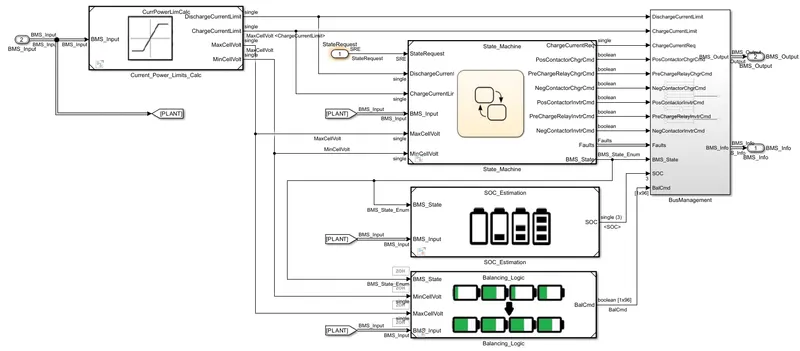
In BMS ECU unit,the current power limit calculations are done used in State machine block,Soc Estimations,Cell balancing logics as shown below,
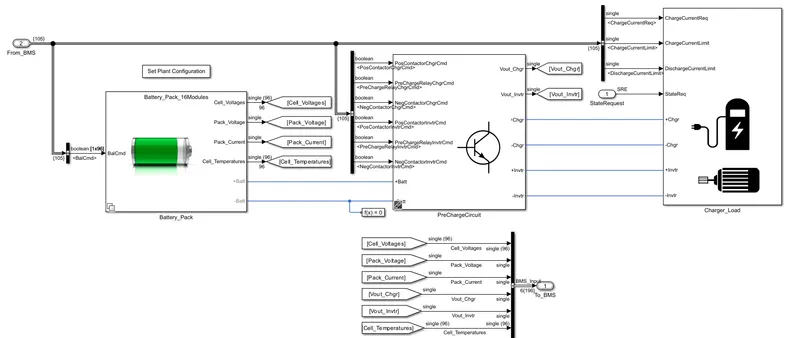
In Plant unit,the battery pack unit,Pre charge unit,charger/load units are created.
In battery packs there are two types of configurations as 1 module(6 cells) and 16 modules(96 cells).
Here we are chossing 1 module for lesser simulation running time.
To run three test cases from harness dashboard of closed loop BMS control.
We have to test three cases for this model by selecting test sequence varient and select the cases one by one as fallows,
Here from the above test sequence editor figure it was set as,
- Driving for first 3000 secs.
- After 3000sec starts balancing operations occure for next 1000 Secs.
- Then charging and balancing occurs for next 5000 secs.
- After that sequences post charge balancing operation occurs till end of the simulation period.
Results:
Run the simulation and results are shown as,
Observations:
Driving state (0-3000 secs):
- All the cells for the first 3000 secs are in driving state so the discharge of all the cells occurs and its varies in the range of 3.1 to 3.9 V (min and max.).
- Cell temprature increases from 288K to 302 K.
- SOC also reduces from 80 % to 45%.
Balancing State (3000-4000 secs):
- After 3000sec for 1000 secs, cell balancing occur and the Modules are in standby mode and they are having constant voltage near about 3.7V.
- Cell temperature reduces slowly as no current flow through the cells during balancing.
- SOC is also constant during this period at 45% .
Charging and Balancing state (4000- 9000 sec):
- fter 4000 sec the charging occurs and the cell voltages increased from 3.7 to nearly about 4.2 V in Constant current mode with current of nearly 30A and then the constant voltage charging starts and current reduces from 30A to 2.5 A Charging and balancing of cells occur till 9000 sec.
- Cell temperature also start to increase exponentially upto constant current region and reduces as current flow reduces in constant voltage mode.
- SOC also increases from 45% to 94%.
Post charge Balancing state(9000- 20000sec):
- After 9000 sec the post cell balancing starts under standby mode.
- Cell temperature reduces in this mode and tries to reach the ambient temperature.
- SOC remains constant to 94%.
TEST CASE - 2
Procedure:
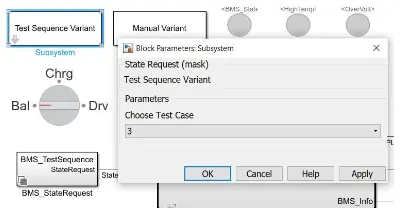
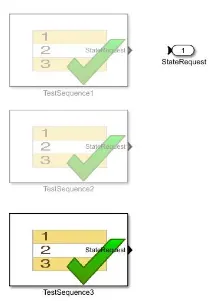
Select the test sequence variant as 2 and inside the BMS state request subsystem the test sequence 2 is selected.
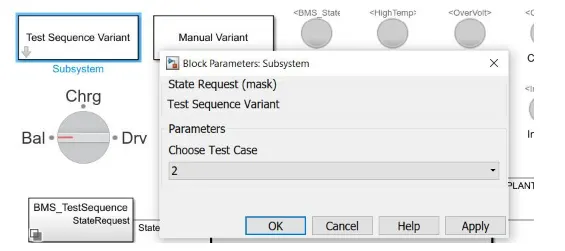
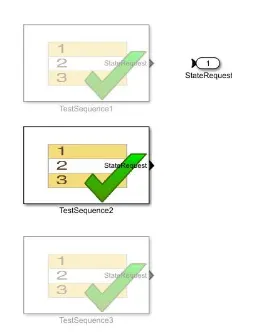
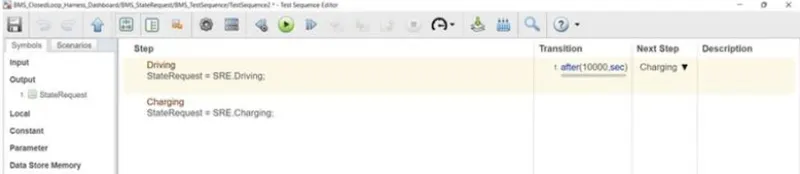
double click on the test sequence it will open the sequence editor as shown below
- Driving state for first 10000 secs.
- Then Charging state for next 10000 secs.
Results of case 2:
Test sequence 2
Dashboard results:
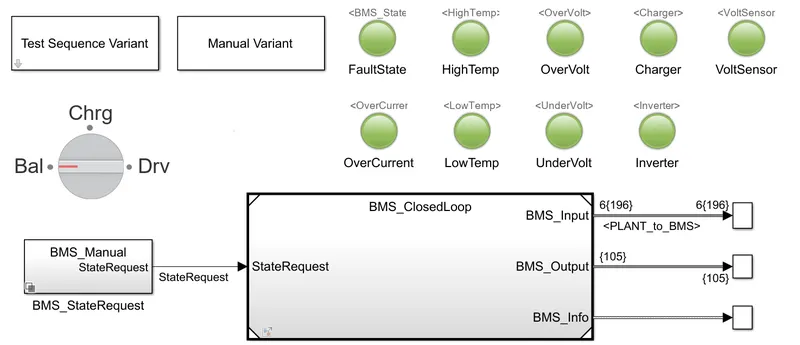
The Lamp indication were green for all states which means the model is in good condition and no fault is occured.
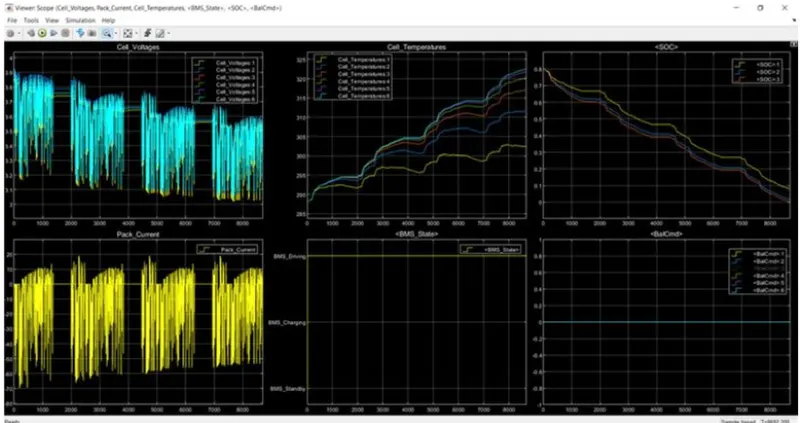
Observations:
Driving State (0-10000 sec):
- The cell voltage varies from 3.9 V to 3.05 volt which is cut off voltage of cell and the entire cell is drained upto 8692 sec.
- Cell temperatures varies from 288K to 323K.
- SOC reduces from 80% to 0% (cell got fully drained) in the drive mode under 8692 sec.
- Some stand by mode conditions are in between the drive modes.
- Entire sequence is performing in drive mode as shown from the above plot.
- balancing of cells are not performed as shown as balance states are in 0 for entire drive mode.
TEST CASE - 3
Procedure:
Select the test sequence variant as 3 and inside the BMS state request subsystem the test sequence 3 is selected.

Results of case 3:
Test sequence 3:
Dashboard results:
The Lamp indication were green for all states which means the model is in good condition and no fault is occured.
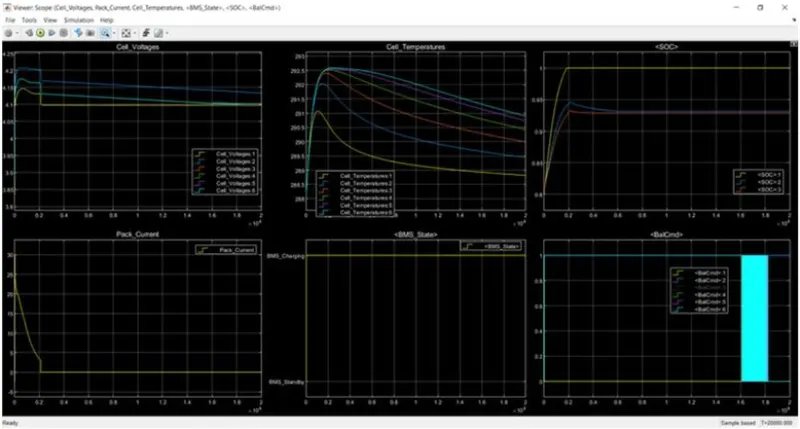
Observations:
Charging state (0-20000 sec):
- Cell Voltages increases from there intial values and after 2000 sec they got constant .
- Pack current initally start from 0 to 30A and then start decreasing when the constant voltage mode is there to 2.5 A and got full charged upto 2000 sec.
- SOC was initally 80% and in 2000 sec it got fully charged that is 100%.
- Cell temperature starts to incraeses initally and when battery got fully charged then decrease down to the ambient temperature.
-
Entire battery pack sequence is operating in charging mode as shown above.
- Balancing of all cells is done at end of simulation.
Conclusion:
All the three test sequences of battery management systems are simulated and analysed for various characteristics and results are plotted and observed.
2) What is coulomb counting? Refer to the above model and explain how BMS implements coulomb counting for SOC estimation ?
SOC: SOC stands for the state of charge of a battery. SOC represents the amount of energy left inside the battery with respect to the total amount of energy in a battery at the Fully charged condition. SOC can help a user to determine when to charge the battery or stop charging and how much energy he can extract from a battery at that time. There is no direct method to calculate SOC for a Li-ion battery but there are several ways in which we can calculate SOC with the help of some additional parameters.
The easiest method to calculate the SOC of a battery is by using a battery voltage translation method. This method is not accurate but helps to approximately and quickly calculate SOC and can be used in devices like power banks where SOC is shown in range and not the exact percentage. For example, a typical power bank shows SOC in the range from 0-25%, 25-50%, 50-75%, 75-100%.
There are several limitations to this method and hence more accurate methods are needed like the Coulomb counting method, the Fuzzy logic method, the Kalman filter, the RBF Neural network, the Fuzzy neural network, the Hybrid methods, etc.
Each method has its limitations, accuracy, and complexity and hence proper decision should be made while selecting methods for SOC estimation.
Coulomb counting:
Coulomb counting is a technique used to track the state of charge of a battery pack. It works by integrating the active flowing current (measured in amps) over time to derive the total sum of energy entering or leaving the battery pack. This produces a capacity that is typically measured in Ah.
Coulomb Counting Method :
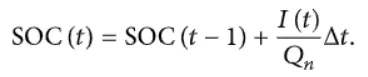
The coulomb counting method is also known as the battery current integration method. In this method, a discharging/charging current I(t) is measured and integrated over time to calculate the amount of energy remaining inside the battery. In this method, SOC is taken at the previous time step SOC(t-1) and the amount of energy removed/added at the current time step is subtracted/added from the SOC of the previous time step SOC(t-1) to obtain the amount of energy present in the battery at the present instant.
The SOC estimation in the coulomb counting method is done using the below equation
Where,
SOC(t-1) = SOC at previous time step
t = current time step
t-1 = previous time step
Q = Charge capacity of the battery
This method is accurate and reliable than the voltage translational method but does not take into account the discharge rate, temperature, hysteresis, age of the battery, etc.
Coulomb counting block in BMS:
soc estimation block:
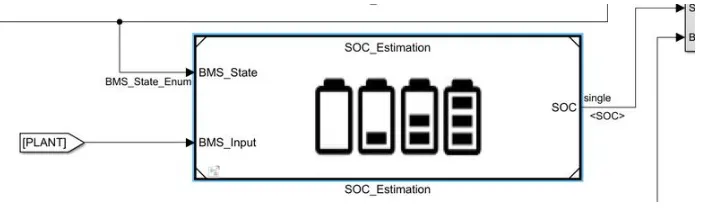
Here SOC is estimated by
i) Coulomb counting method
ii) Unscented Kalman filter
iii) Extended laman filter.
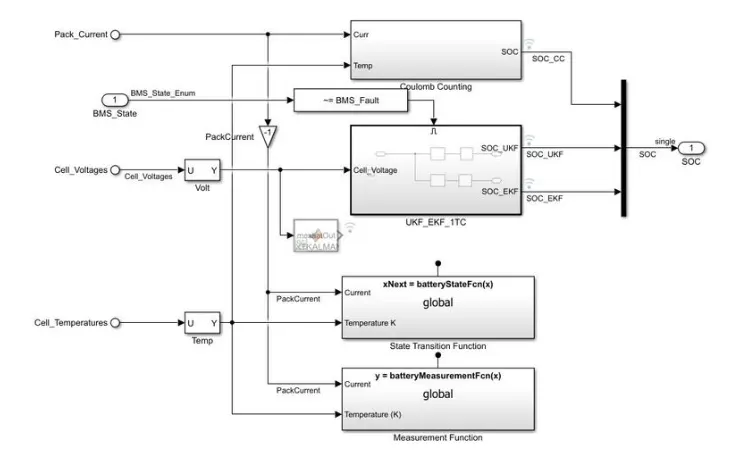
Coulomb counting method:
This block implements the above mentioned soc equation to estimate the SOC.
In this method, a discharging/charging current I(t) is measured and integrated over time to calculate the amount of energy remaining inside the battery.
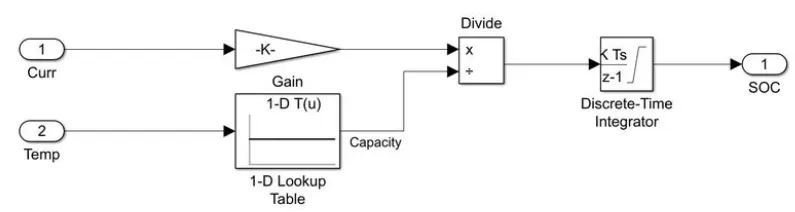
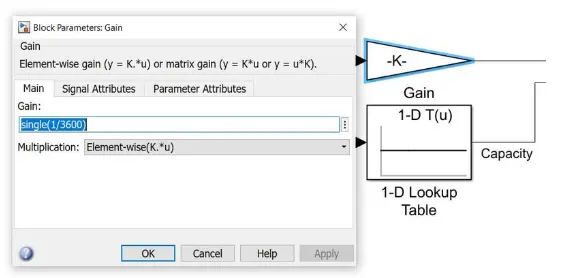
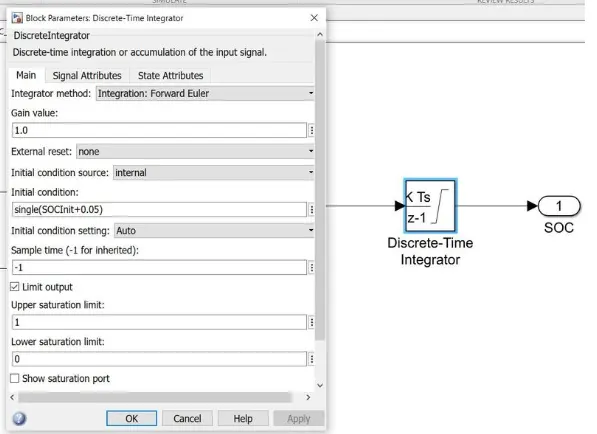
Thus the BMS system implements the SOC equation using above blocks to estimate the SOC.
CONCLUSION:
The battery management system project model is downloaded and initialized in MATLAB and it is simulated for the 3 test sequences.
All the three test sequences of battery management systems are simulated and analysed for various characteristics and results are plotted and observed.
Coulomb counting method is studied and the implementation of that method is BMS to estimate the SOC is analysed.