Project - Data Handling and Interpolation
Answer:
%Reading the xlsx file.
>> f = xlsread('VI.xlsx');%storing first column value of 'f' in 'V'.
>> V = f(:,1)

V =

  -17.3000
  -17.1000
  -17.0000
  -16.8000
  -16.5000
  -16.0000
  -15.0000
  -14.0000
  -12.0000
  -10.0000
   -8.0000
   -5.0000
   -2.0000
   -0.2000
    0.0900
    0.1900
    0.2700
    0.3900
    0.4300
    0.5000
    0.5500
    0.6000
    0.6200
    0.6500
%storing second column value of 'f' in 'I'.
>> I = f(:,2)

I =

  -28.0000
  -24.0000
  -19.0000
  -14.0000
   -9.0000
   -6.0000
   -4.0000
   -3.0000
   -2.0000
   -1.3000
   -1.0000
   -0.6000
   -0.3000
   -0.1000
         0
         0
         0
    0.0100
    0.0300
    0.1700
    0.4200
    1.2300
    1.9900
    3.9100
% Voltage range 'vinp', Given range of voltage data mentioned in problem.
>> Vinp = -17.3:0.1:0.9;% Using 'interp1' function for calculatiing current and values for given
>> linp = interp1(V,I,Vinp,"spline");%ploting trig_function with time
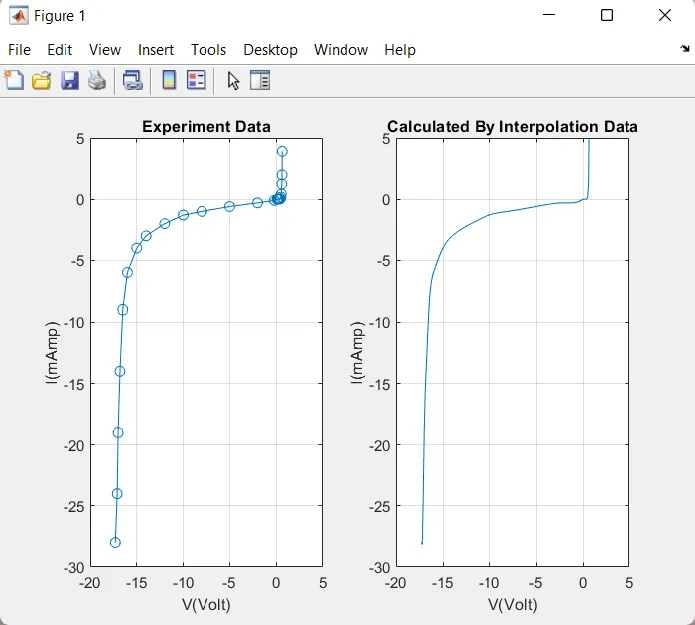
>> figure(1);
>> subplot(121)
>> plot(V,I,'-o');grid;
%Giving title for the figure
>> title('Experiment Data');% Giving the labels to both the axis and Defining axis limits
>> ylabel('I(mAmp)');xlabel('V(Volt)');
>> axis([-20 5 -30 5]);
%Plotting the trig_function with time and Giving title for the figure.
>> subplot(122)
>> plot(Vinp,linp);grid;
>> title('Calculated By Interpolation Data');
>> ylabel('I(mAmp)');xlabel('V(Volt)');
>> axis([-20 5 -30 5]);
Figure 1:
%Ploting the values is.
%Giving title for the figure.
% labeling x and y axis is.
% Showing the legends are
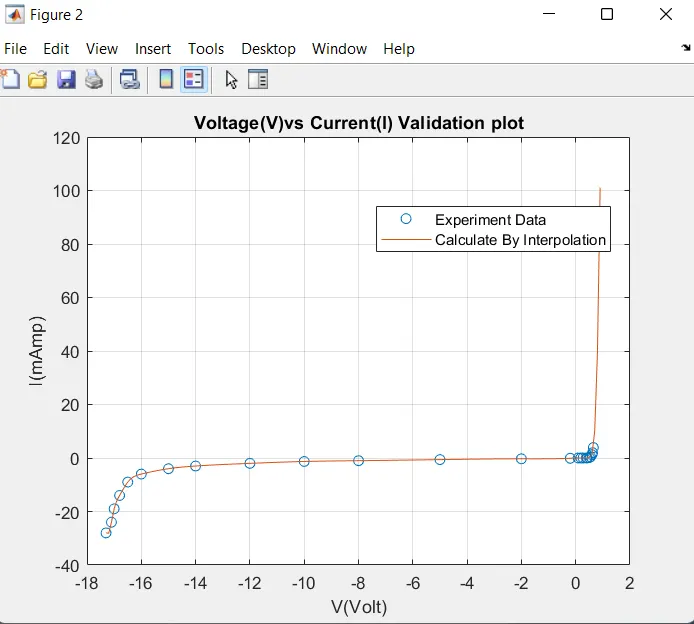
>> figure(2);
>> plot(V,I,'o',Vinp,linp);grid;
>> title('Voltage(V)vs Current(I) Validation plot');
>> xlabel('V(Volt)');ylabel('I(mAmp)');
>> legend('Experiment Data','Calculate By Interpolation','Location','Best');
Figure 2:
%Given voltage Data in problem
%Giving title for the figure is
%labeling x and y axis is
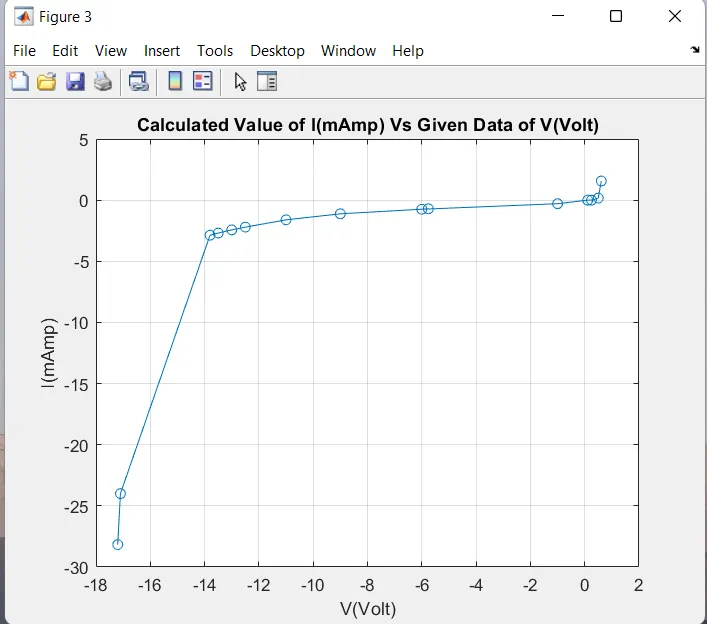
>> figure(3);
>> plot(VV,VI,'-o');grid;
>> title('Calculated Value of I(mAmp) Vs Given Data of V(Volt)');
>> xlabel('V(Volt)');ylabel('I(mAmp)');
Figure 3:
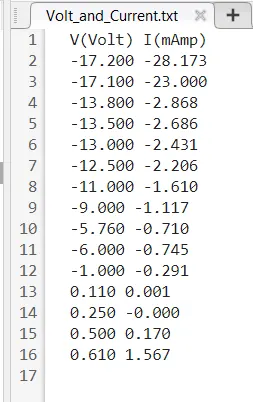
%Output file is
%storing value of variabel x in fileid
%closing output fileid
>> fid = fopen('Volt_and_Current.txt','w');
>> fprintf(fid,'V(Volt) I(mAmp)n');
>> for i=1:length(VV)
fprintf(fid,'%.3f %.3fn',VV(i),VI(i));
end
>> fclose(fid);
Output:
Calculated and ploted: