Week 7 State of charge estimation
Q.1 ANS - Lithium ion battery packs are widely used energy storage system in electrical vehicle. The battery management system(BMS) is responsible for safe operation, performance and battery life under divorce charge discharge and environment condition. When designing a BMS the cell voltage and temperature, state of charge, state of health and the charging profile has to be controlled and maintained. Also indicate whether there has been a fault.
By using given link we are able to get BMS system and the closed loop harness dashboard.
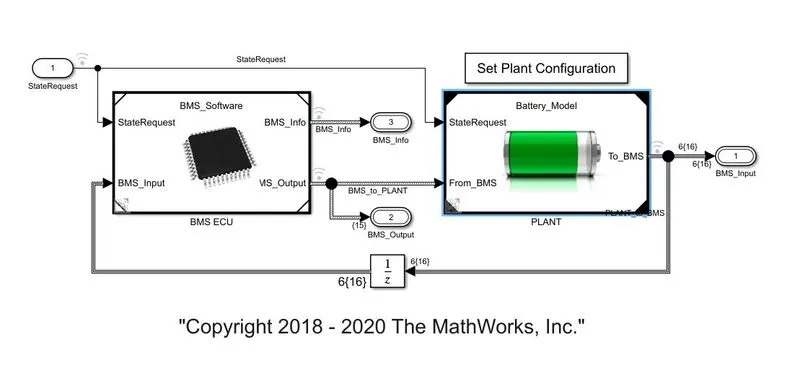
The BMS model consist of a BMS ECU(electrical control unit) and a plant. The control unit with its various monitoring and control algorithms is connected to a block with the representation of the battery pack and associated circuitry and peripherals. Ths BMS model shown below.
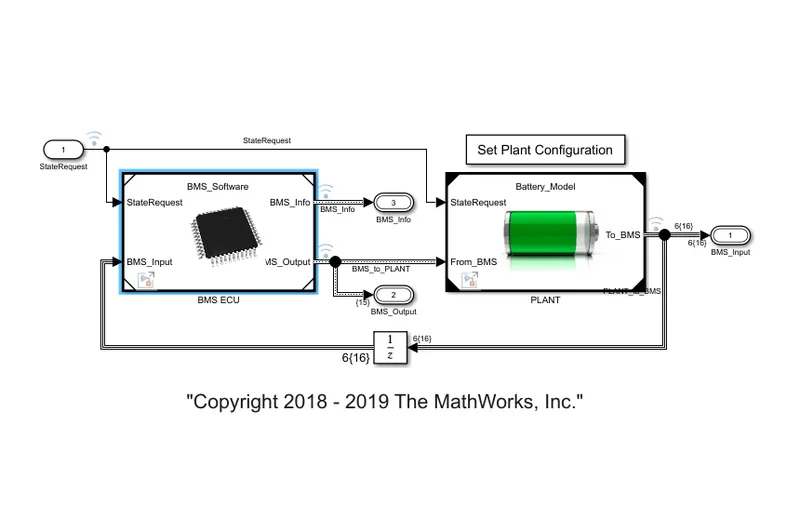
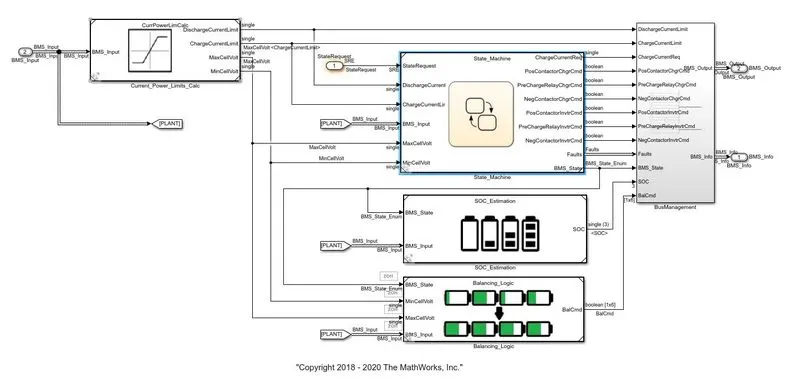
When you click on the BMS ECU, its subsystem opens. Now click on the state machine.
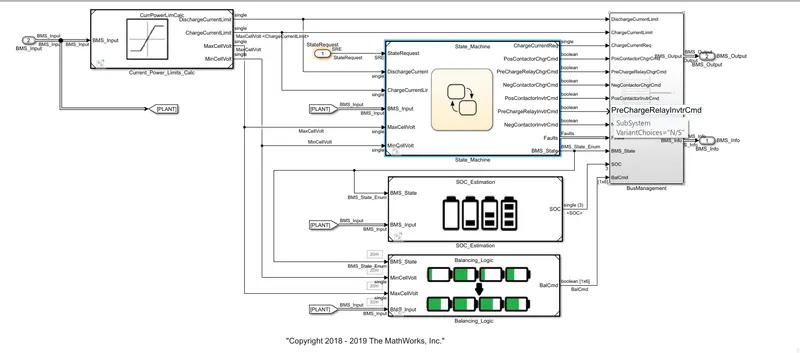
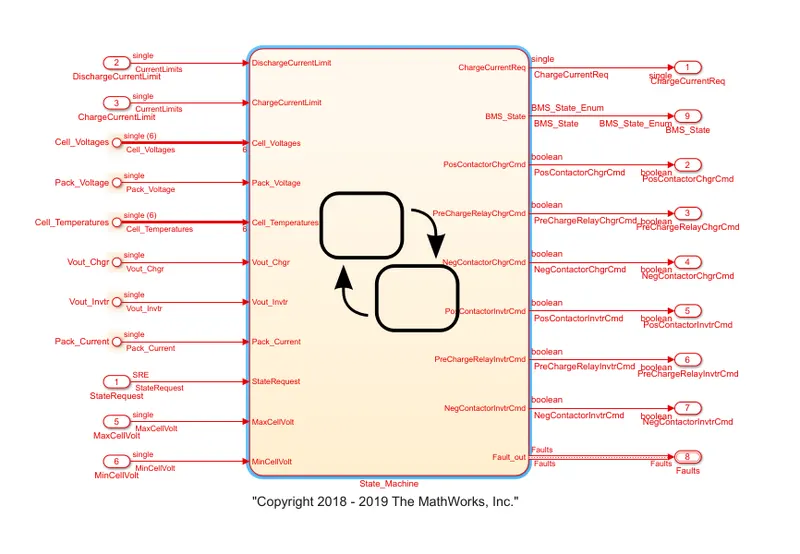
State machine defines the main operating state of the BMS. The state machine has four parallel states.
1. The first one defines the variable BMS State which indicate standby, driving, and fault. Charging comprises constant current and constant voltage stages.
2. The second state switches the fault state ON in case a current, voltage or temperature value reaches an unsafe level.
3. The third and fourth states defines the contactor ON and OFF switching sequence for the charger and inverter.
After the BMS we have to go for the harness. The harness dashboard shown below. It consist of the test sequence variant subsystem which holda three different test cases. This dashboard also helps in determining the fault states and other parameters as shown in the diagram below. Green colour indicates that the system is working without any fault while red signal will indicate that there is a fault in the system.
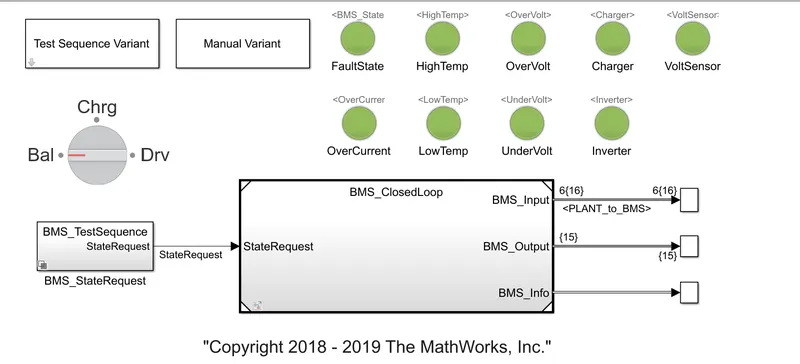
To check the fault in the system we have to go test sequence variant and select test case 1 and ok.
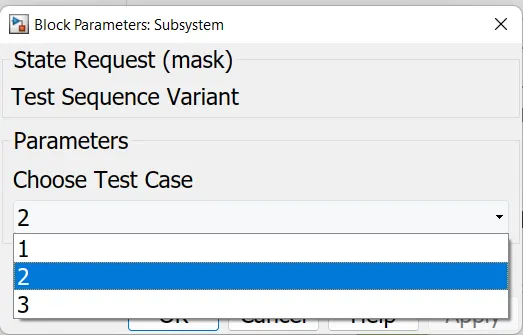
After applying the test case we have to open BMS test request block.
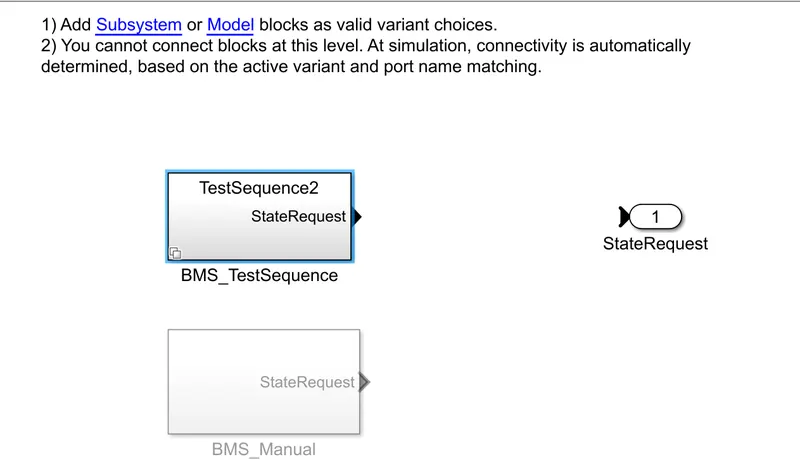
In that we have to select BMS test sequence block and then on select test sequence 1. Selecting the first test sequence we can check the condition for this perticular condition.
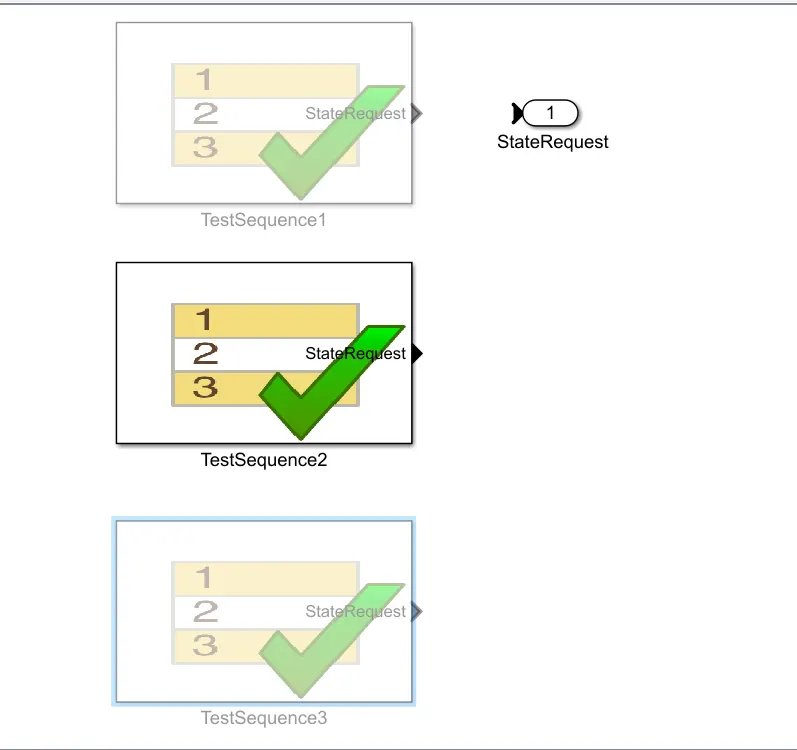
There are three stages of driving condition namely -
Driving, charging and standby.
When the simulation begins, initially the vehicle is in driving state and the SOC will decrease for this time period. After the some time period the next step is balancing mode and the vehicle is in standby condition. After the vehicle is in charging mode and the battery SOC increases almost 100%.
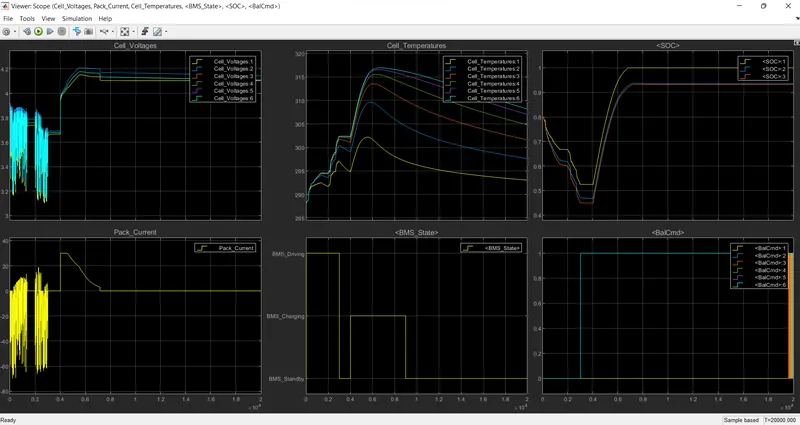
The above scope shows the result for test case1.
The input cycle can be seen i the BMS State plot in which the vehicle initially undergoes driving, then charging till SOC=90% and then later in standby state.
During charging the battery pack voltage is increased upto 4.2V.
The cell temperature increases during the driving and charging cycle and starts falling off in standby mode.
The SOC drops to less than 50% after the driving cycle and then later put into charging untill SOC reaches 100%.
The current supplied to the EV during driving phase can be seen in current plot.
Now we will go for the second test case. For this we have to go to test case variant and choose test case 2 and then ok. After applying the test case we have to open BMS test request block. In that we have to select BMS test sequence block and then on select test sequence 2. Selecting the second test sequence we can check the condition for this perticular condition.
This test case has two phases for the battery pack. Driving and charging phases. 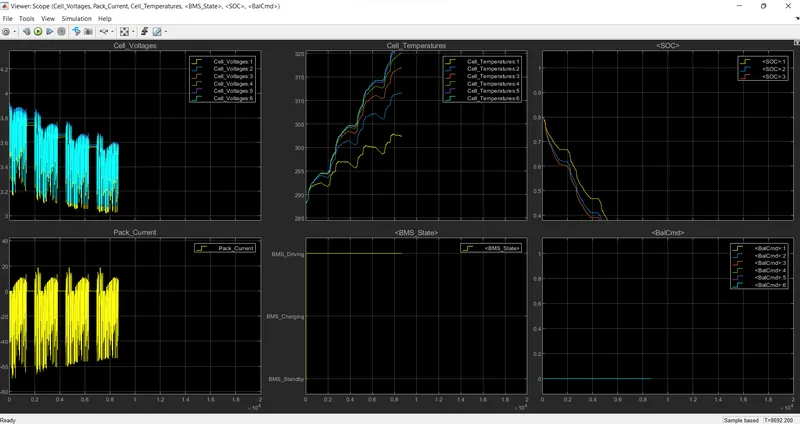
The above scope shows the test case 2 result.
The scope shows the various parameter for the BMS model under second test case. After few second when the driving cycle is over the fault condition occure and the SOC does not increase even for the charging phase.
The last test is for the third test sequence. For this we have to go to test case variant and choose test case 3 and then ok. After applying the test case we have to open BMS test request block. In that we have to select BMS test sequence block and then on select test sequence 3. Selecting the third test sequence we can check the condition for this perticular condition.
There is only a single phase here for the third test case. The charging phase.
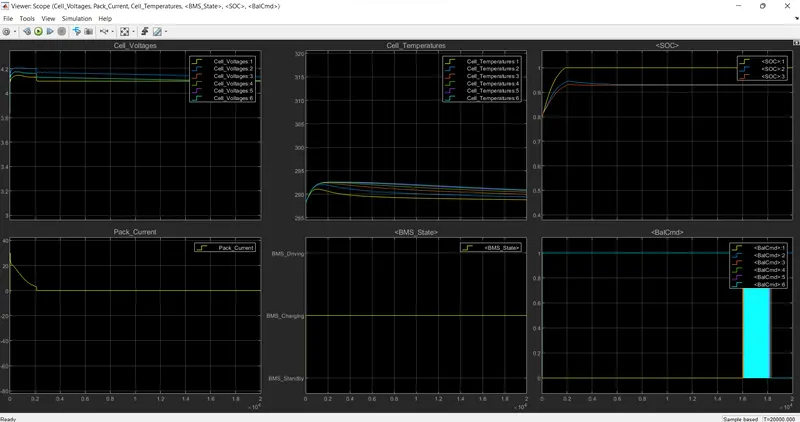
The scope shows the result for the third case. Hre the SOC increases from 80 to 100% and then remains in standby mode.
Following these steps the BMS model can be implemented to check the faults and error using the three different test cases from the harness dashboard.
Q.2 ANS -
The Coulomb counting method measures the discharging current of a battery and integrates the discharging current over time in order to estimate SOC. Coulomb counting method is done to estimate the SOC(t), which is estimated from the discharging current, I(t), and previously estimated SOC values, SOC(t-1). SOC is calculated by the following equation:
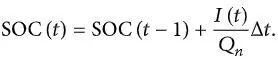
But there are several factors that affect the accuracy of Coulomb counting method including temperature, battery history, discharge current, and cycle life.
Modified Coulomb Counting Method
To improve the Coulomb counting method, a new technique called modified Coulomb counting method is proposed. The modified Coulomb counting method uses the corrected current to improve the accuracy of estimation.
The corrected current is the function of discharging current. There is a quadratic relationship between the corrected current and discharging current of battery. By practice of experimental data, corrected current is calculated by the following form:

where k2, k1 and k0 are constant values obtained from the practice experimental data.
In modified Coulomb counting method, SOC is calculated by the following equation:
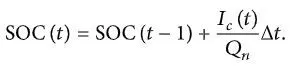
The experimental results show that the accuracy of the modified Coulomb counting method is superior to the conventional Coulomb counting method [1].
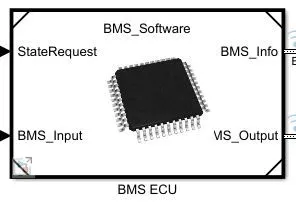
From the given model by Mathworks as shown below of BMS Closed Loop model, when seen inside the BMS ECU,
And then inside the SOC estimation block
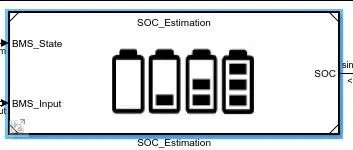
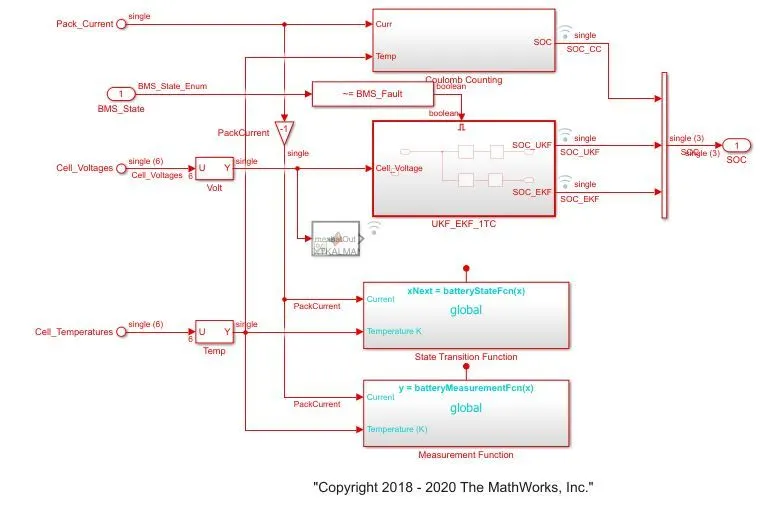
The Coulomb counting block can be observed on the top of the model, where the Coulomb counting was carried out. The model for the same can be seen below.
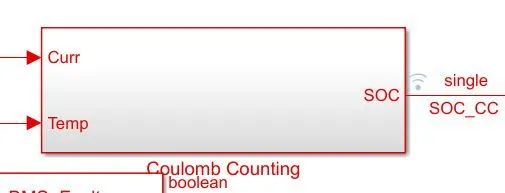
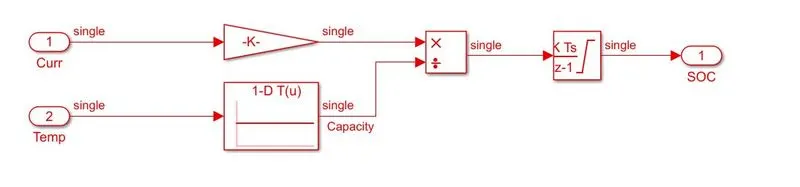
This system carries out the estimation by coulomb counting equation mentioned earlier. The main advantage of coulomb counting is that of its simplicity and low computational cost. Temperature and current are taken as input from the battery. Current signal is given to the gain block and the temperature is given to capacity as it varies according to the temperature. These inputs are given to integration where current will be integrated wrt time. This output is given to another block where it is divided by capacity and henceforth the SOC is estimated.