Week 7 State of charge estimation
Que.1:Simulate the 3 test cases from harness dashboard and write a detailed report on the results.
Ans:
Simulink Model: Battery system Model -> Harness Dashboard. 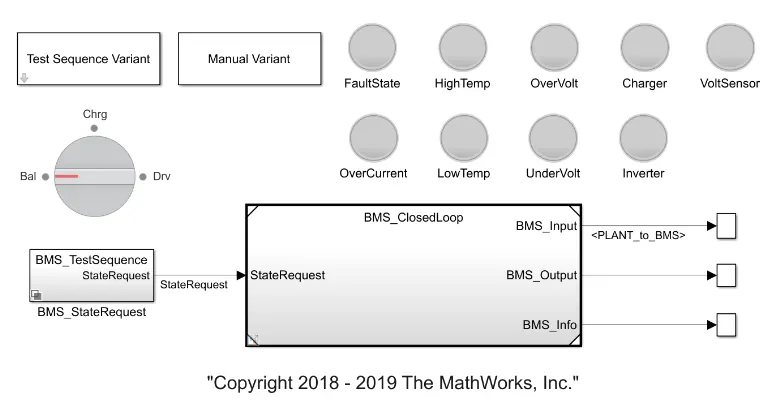
The harness dashboard is shown above. It consist of Test sequence varient subasystem which hold a 3 different cases. The dashboard also helps in determining the fault states & other parameter as shown in a diagram. Green color indicate the system working without any errors while red signal will indicate that there is fault in the system.
Observations/Result:
A) Test case 1:
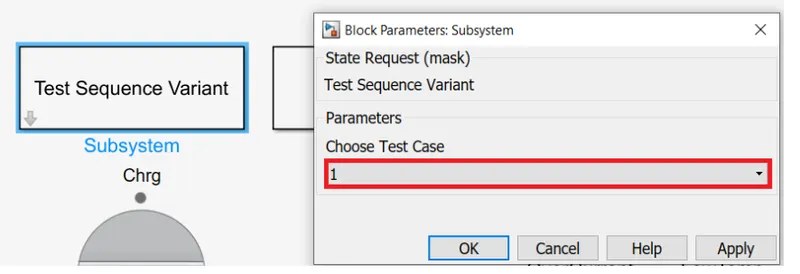
Step 1: To check the fault in the system we have to go back to the harness dashboard. Here in the first compilation the test case 1 is selected.
Step 2: After applying test case, we have to run the simulation for 20000 seconds.
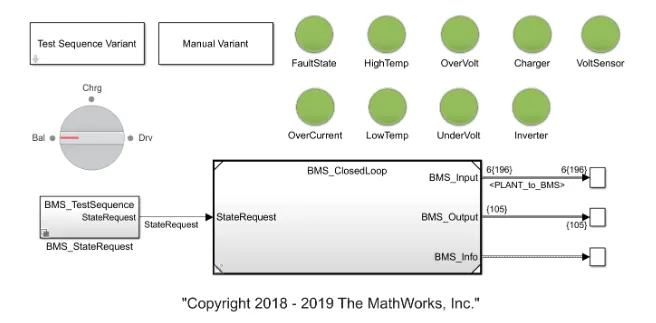
The dashboard shows no error & faults.
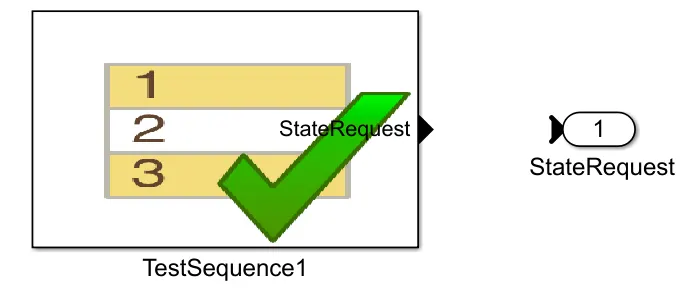
Step 3: If we click on 'BMS state request' the following system open up. Now we have to select 'BMS Test sequence'.
1)Add subsystem or model block as a valid variant choices.
2)We cannot connect block at this stage . At simulation connectivity is autimatically determined, based on active varient and port name matching.
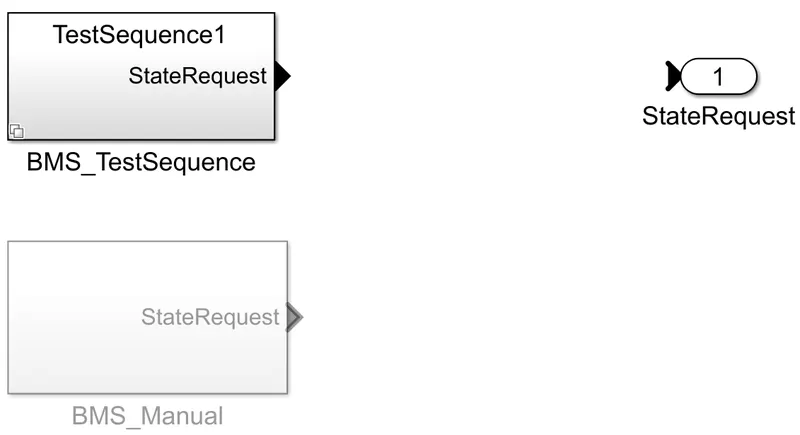
Selecting the first test sequence we can check the conditions for particular condition.
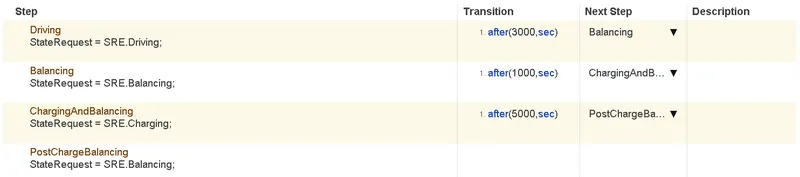
There are three condition, namely:
- Driving
- charging
- Standby
When the simulition begins, initially the vehicle is in driving state & the SOC wil decrease for this time period. Here we can see all the lights have turned green as there is no fault or errors in the model. After a time period of 3000 seconds the next step i balancing mode & vehicle standby condition. After, another 1000 seconds, the vehicle is in charging phase & battery's SOC increases almost to 100%. The next phase is post charging phase in which the vehicle again goes to standby mode.
Step 4: The Scope shows the following result for test case 1,
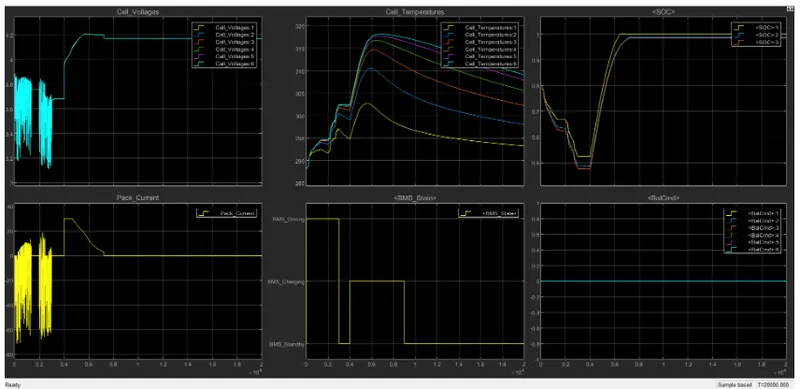
- The input cycle can be seen in the BMS_State plot in which the vehicle initially undergoes driving, then charging till 90% & then later in standby state.
- During charging the battery pack voltage is increase upto 4.2V.
- The cell temperature increases during driving & charging cycle & starting fall of in standby mode.
- The SOC drops to less than 50% after the driving cycle & then later put into charging until SOC reaches 100%.
- The current supplied to the EV during driving phase can be seen in the current plot.
B) Test case 2:
Step 1: To check the fault in the system we have to go back to the harness dashboard. Here in the for the instance the test case 2 is selected.
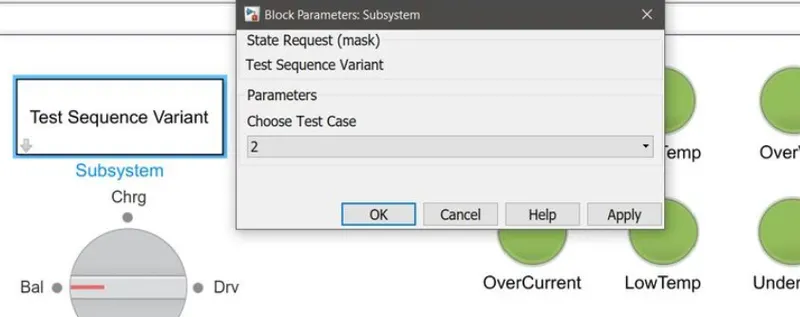
Step 2: After applying test case, we have to run the simulation.
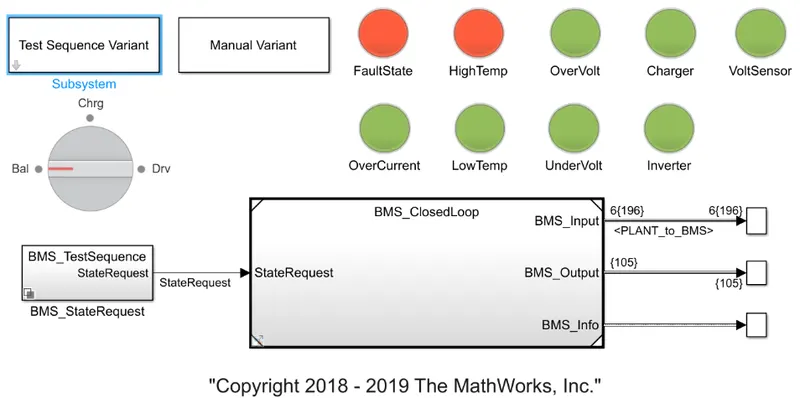
The result shows that there is fault condition in the vehicle. The dashboard in the model depicts the same with red color indication.
Step 3:
If we click on 'BMS state request' the following system open up. Now we have to select 'BMS Test sequence'.
1)Add subsystem or model block as a valid variant choices.
2)We cannot connect block at this stage . At simulation connectivity is autimatically determined, based on active varient and port name matching.
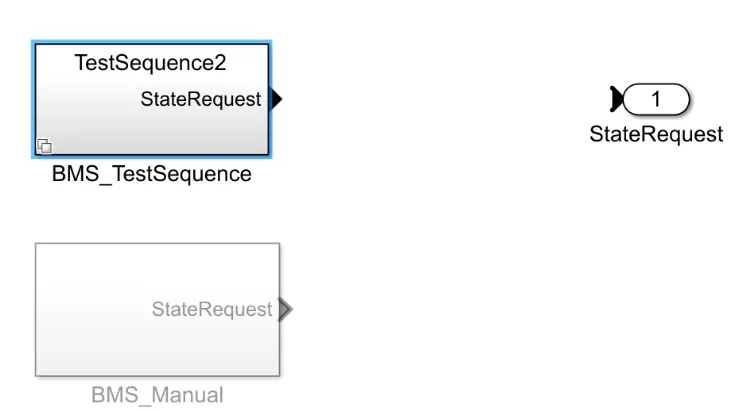
Selecting the second test sequence we can check the conditions for particular condition.
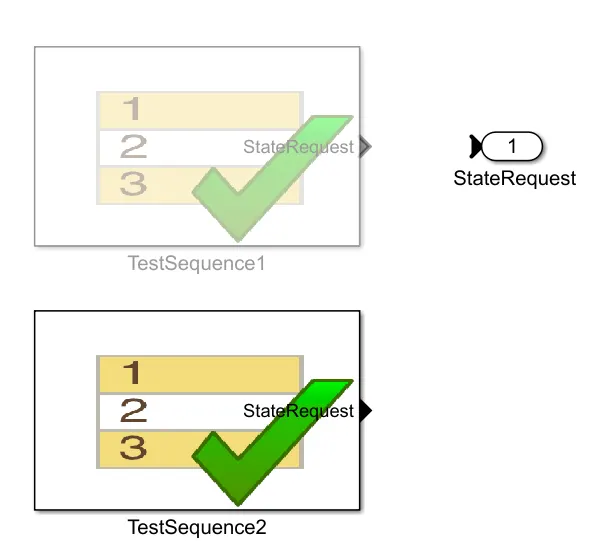
This test cases has two phases for the battery pack, i.e. driving & charging phases.

Step 4: The Scope shows the following result for test case 2,
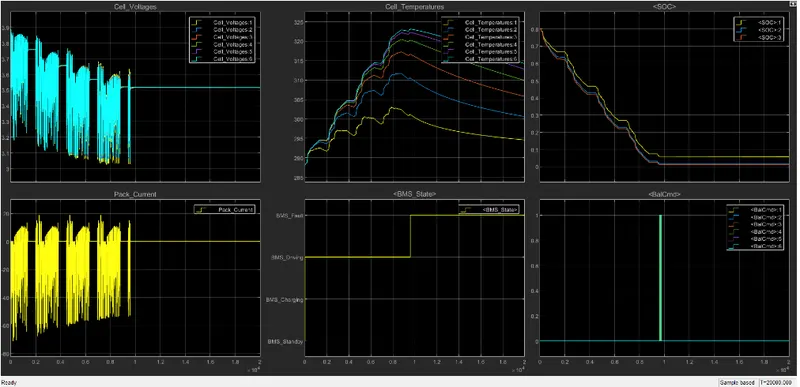
The scope shows the various parameters for BMS model under second test case. After 10000 sec when the driving cycle is over, the fault condition occurs & so the SOC does not increase even for the charging phase.
C) Test case 3:
Step 1: To check the fault in the system we have to go back to the harness dashboard. Here in the for the instance the test case 3 is selected.
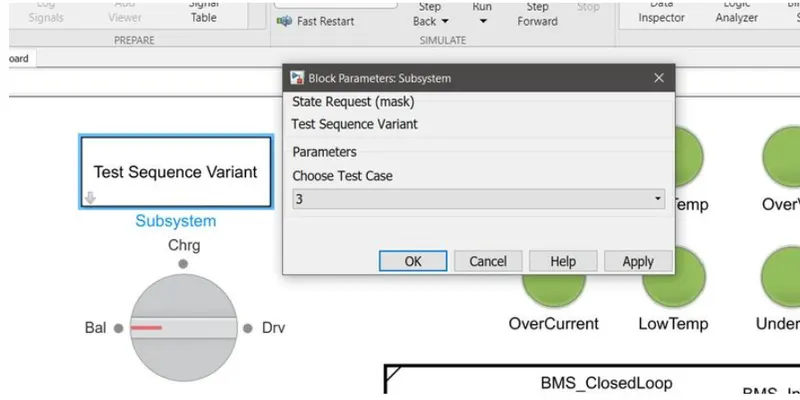
Step 2: After applying test case, we have to run the simulation for 20000 seconds.
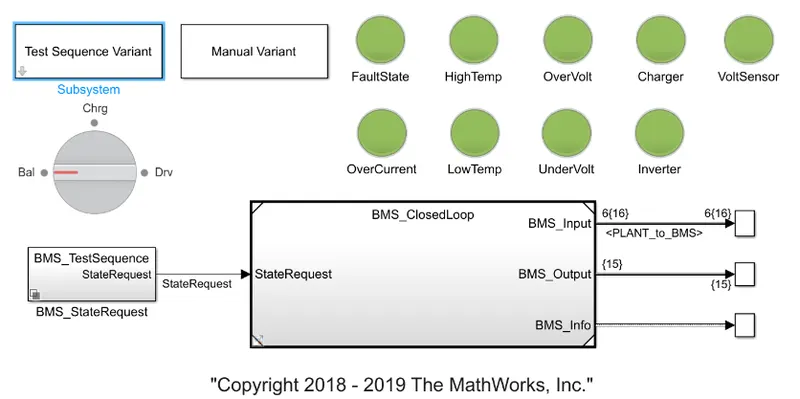
The dashboard shows no error & faults.
Step 3: If we click on 'BMS state request' the following system open up. Now we have to select 'BMS Test sequence'.
1)Add subsystem or model block as a valid variant choices.
2)We cannot connect block at this stage . At simulation connectivity is autimatically determined, based on active varient and port name matching.
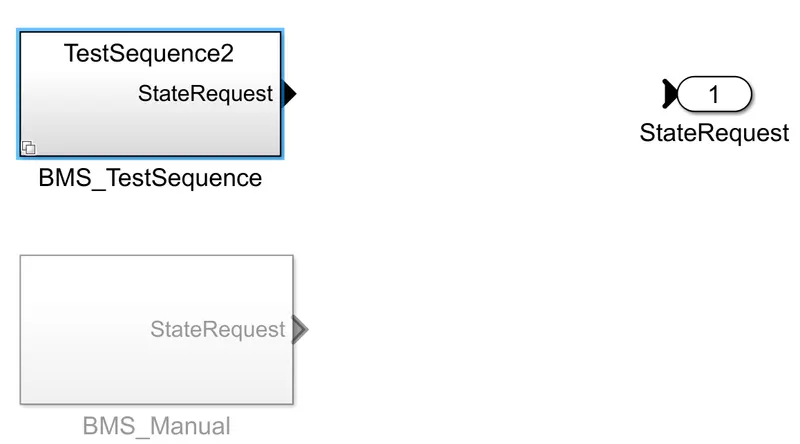
Selecting the third test sequence we can check the conditions for particular condition.
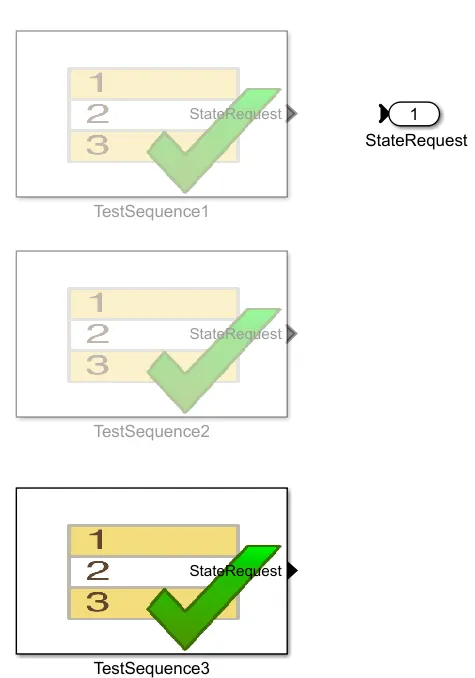
Selecting third test sequence we can check condition for particular condition.

There is only single phase here for third case i.e. Charging phase.
Step 4: The Scope shows the following result for test case 3,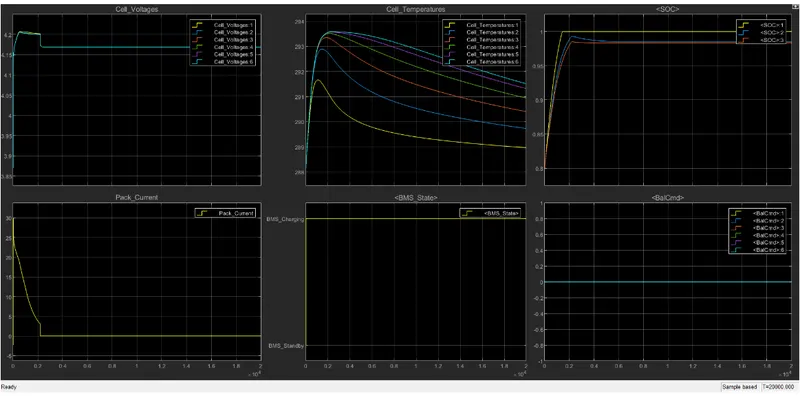
Here SOC increases for 80 to 100% & then remain in standby mode.
Que.2:What is coulomb counting? Refer to the above model and explain how BMS implements coulomb counting for SOC estimation ?
Ans:
SOC: The State of Charge (SOC) is a measurement of amount of energy available in a battery at specific point in time expressed as a percentage. For example, the SOC reading for a computer might read 95% or 100%.
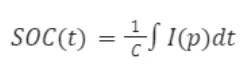
Where,
C= Total capacity of the Battery.
i= Current.
SOC Estimation: The determination of battery SOC is always an essential part of a BMS The accurate & reliable estimation of battery SOC can provide necessary assessment factor for vehicle energy management & optimal design of the control system. Therefore, a larger number of methods have been proposed for estimating battery SOC in real-time. Here we are calculating State estimation by coloumb counting method.
A)Coulomb counting: The SOC is one of the most important parameters for batteries. In general, the SOC of a battery is defined as the ratio of its current capacity (Q(t)) to the nominal capacity (Qn). The nominal capacity is given by the manufacturer and represents the maximum amount of charge that can be stored in the battery.
The SOC can be defined as follows:
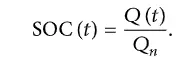 ..................................(1)
The various mathematical methods of estimation are classified according to methodology. The classification of these SOC estimation methods is divided into the following four categories.
(i)Direct measurement: this method uses physical battery properties, such as the voltage and impedance of the battery.
(ii)Book-keeping estimation: this method uses discharging current as the input and integrates the discharging current over time to calculate the SOC.
(iii)Adaptive systems: the adaptive systems are self-designing and can automatically adjust the SOC for different discharging conditions. Various new adaptive systems for SOC estimation have been developed.
(iv)Hybrid methods: the hybrid models benefit from the advantages of each SOC estimation method and allow a globally optimal estimation performance. The literature shows that the hybrid methods generally produce good estimation of SOC, compared to individual methods.
B)BMS implements coulomb counting for SOC estimation:
Coulomb counting method: The coloumb counting method measures the discharging current over time in order tro estimate SOC coloumb counting method is done to estimate the SOC values, which is estimated from the discharging current & previously estimated SOC values, SOC cais calculated by following equation.
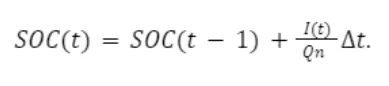 ..........................(2)
From the given model by Mathworks as shown below of BMS Closed Loop model:
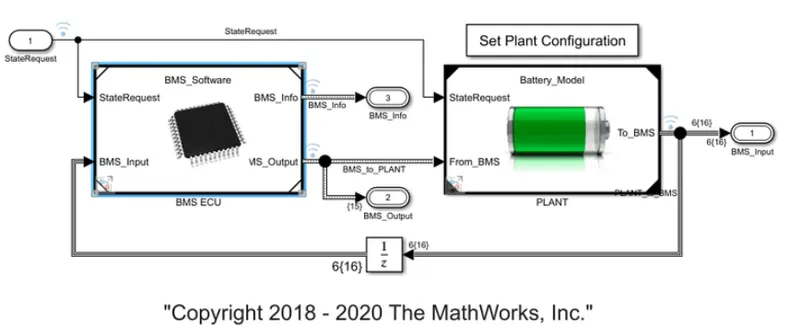
BMS algorithm models , protects , reports the measurement from battery pack.
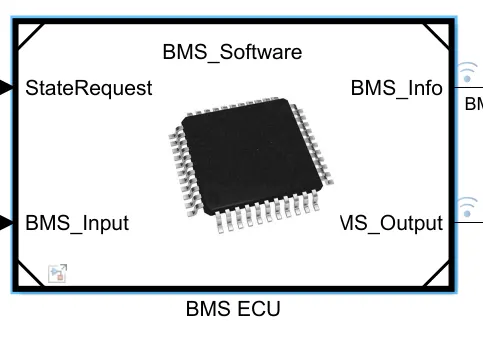
GO to BMS ECU:
Inside the BMS ECU i.e. the SOC estimation block:
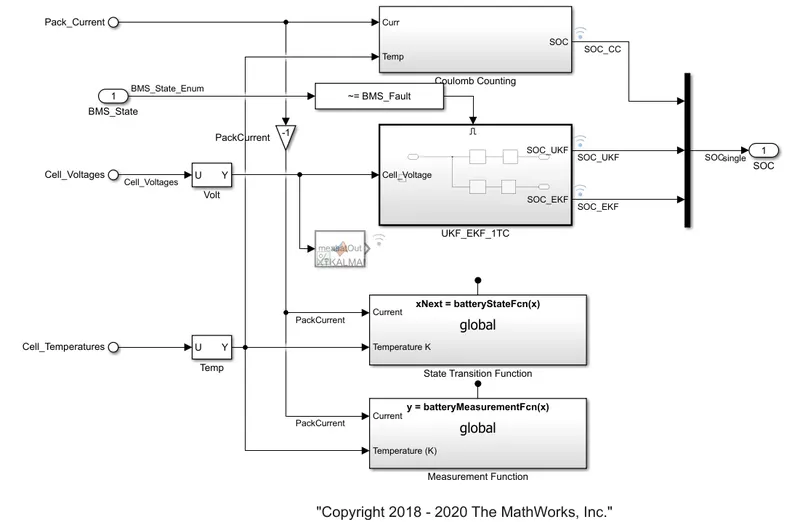
The Coulomb counting block can be observed on the top of the model, where the Coulomb counting was carried out. The model for the same can be seen below.
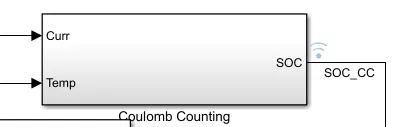
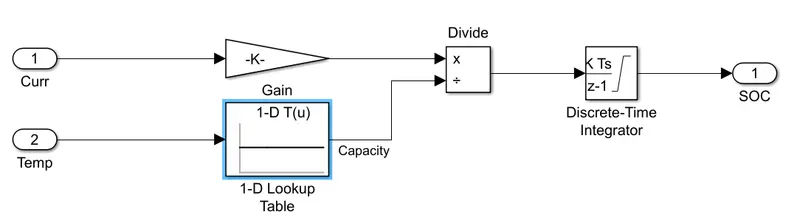
Model description:
- In this coulomb counting method, the entering and leaving currents of the cell are integrated to track the safe chargable time.
- Here the two input signals current and temperature are taken the curent signal goes to gain block and the temperature signal goes to current look up table.
- Then as seen , signals are multiplied and divided as shown and then output is given to discrete time integrator to track the safe chargable time and then SOC is estimated.
This system carries out the estimation by coulomb counting equation mentioned earlier. The main advantage of coulomb counting is that of its simplicity and low computational cost. Temperature and current are taken as input from the battery. Current signal is given to the gain block and the temperature is given to capacity as it varies according to the temperature. These inputs are given to integration where current will be integrated wrt time. This output is given to another block where it is divided by capacity and henceforth the SOC is estimated. The drawback of coulomb counting method is accumulation of current sensor error and inability to recover from wrong initial condition because of lack of feedback from voltage measurement.
Conclusion: Estimating of battery SOC under different discharging conditions i.e. test cases & BMS implementation of coulomb counting for SOC estimation has been performed , observed & analysed successsfully.