Week 7 State of charge estimation
1. Simulate the 3 test cases from the harness dashboard and write a detailed report on the results
2. What is coulomb counting? Refer to the above model and explain how BMS implements coulomb counting for SOC estimation?
Hint :(Download the file from the link and go to SOC estimation model-ECU block)
ans)
1) Simulate the 3 test cases from the harness dashboard and write a detailed report on the results:
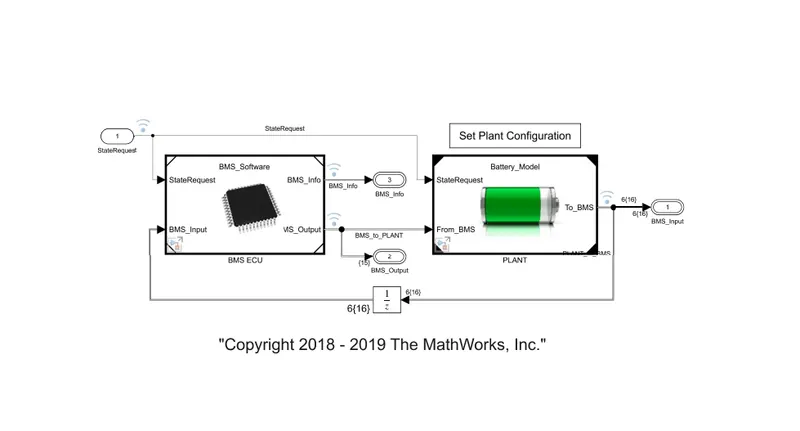
This is how the BMS is implemented in the MATLAB along with the battery pack
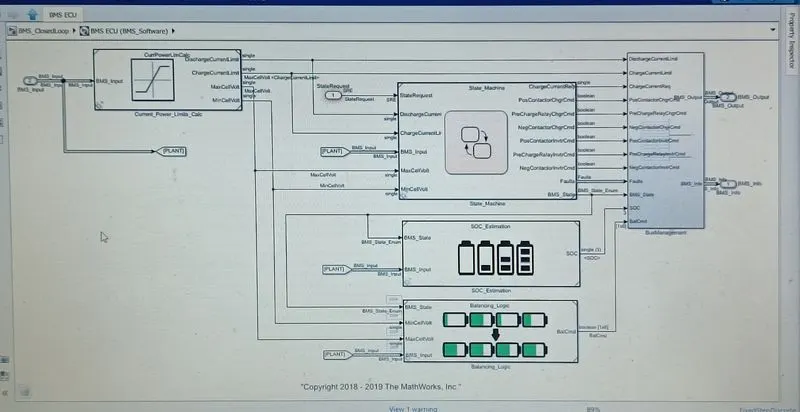
BMS ECU subsystem is shown below.
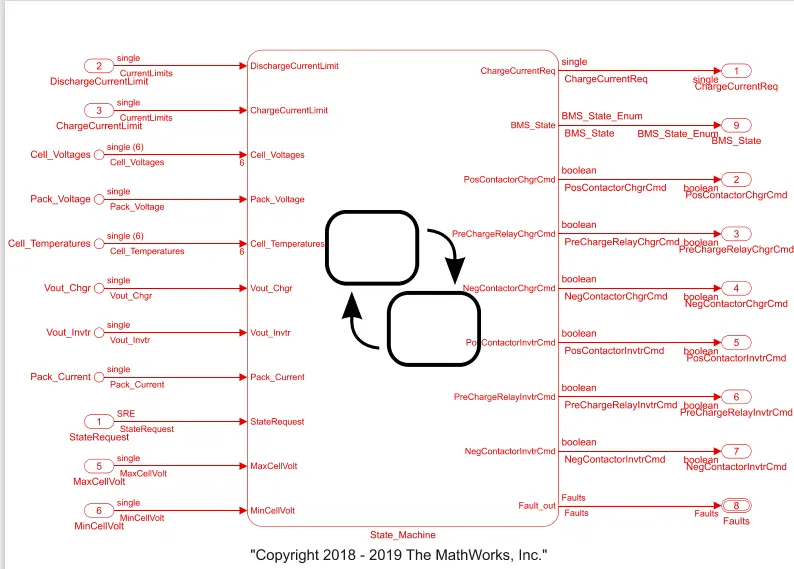
state machine subsystem is shown below.
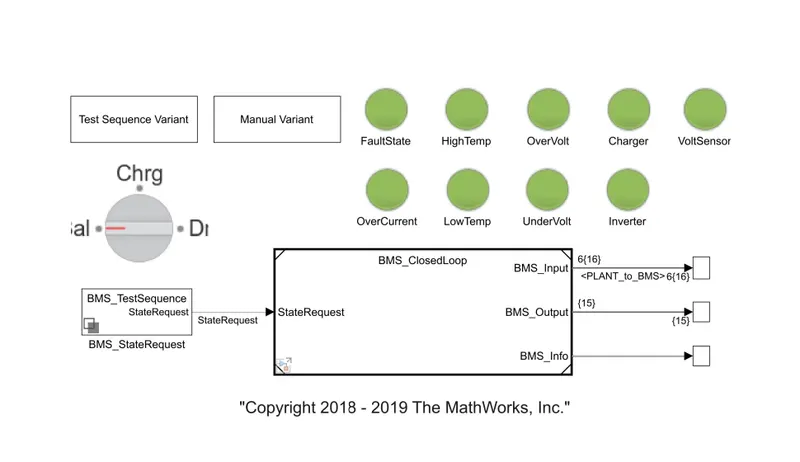
From the above MATLAB model, we are Simulating 3 test cases from the harness dashboard to find out the fault condition in BMS. And the below image shows the dashboard where we can get information related to the faults like over voltage, under voltage, high temperature, over current and inverter-related faults. If there is any fault condition the indicators will turn to red color otherwise it shows the green indication means there is no fault and the system is safe.
we can also know the information like the battery pack is in which condition at present moment like the mode of operation called Balancing mode, Charging mode and Discharging mode.
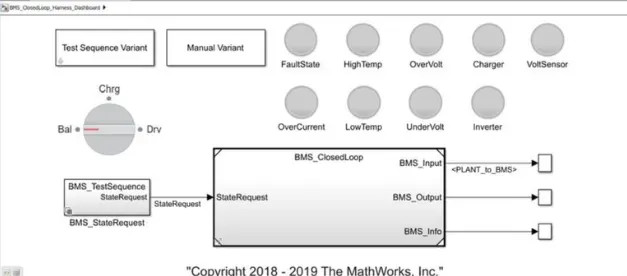
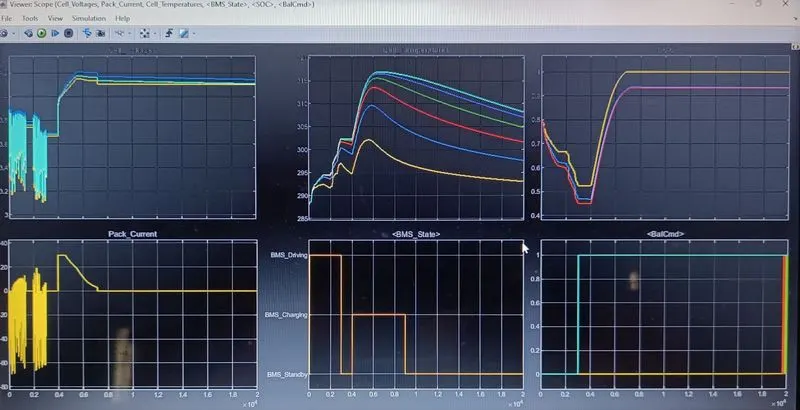
Test case 1: Discharging, Charging, and Balancing / At BMS Level Test Condition For Both Driving & Charging
we can observe the constant current (CC) and constant voltage (CV) characteristics of a battery pack. Initially, the cell voltage is around 3.8V and the cell current is zero when the battery is fully discharged. At a time instant of 0.4sec the cell voltage is gradually increased from 3.8 to 4.2V at this same instant of time the peak current of the cell increases from 0 to 30A and it is constant till 0.5sec this phase of the cell is called a CC Mode and then it gradually reduces to zero at 0.7secAt time 0.5sec the cell voltages are increased to 4.2V and then became constant from 0.7sec till the end of simulation time or till is completely charged this phase is called constant voltage CV Mode. usually, the CV mode takes a longer time period than the CC mode.
Generally, cell manufacturers design the CC Mode till the cell reaches 80% of its full capacity and from there the remaining 20% will be considered as CV Mode.
Result of SOC:
As we can observe the SOC is estimated using different methods like
1)Coulomb counting: From the result, the yellow graph shows this method where the SOC reached 100% at a time of 0.7sec
2)UKF Kalman Filter: SOC Estimation from this method is 93%
3)EKF Kalman Filter: SOC Estimation from this method is 93%
Both the Kalman Filter methods are overlapping each other and give the output result of SOC Estimation the same as 93%.
Hence there is no fault observed from the dashboard where all the indication is green.
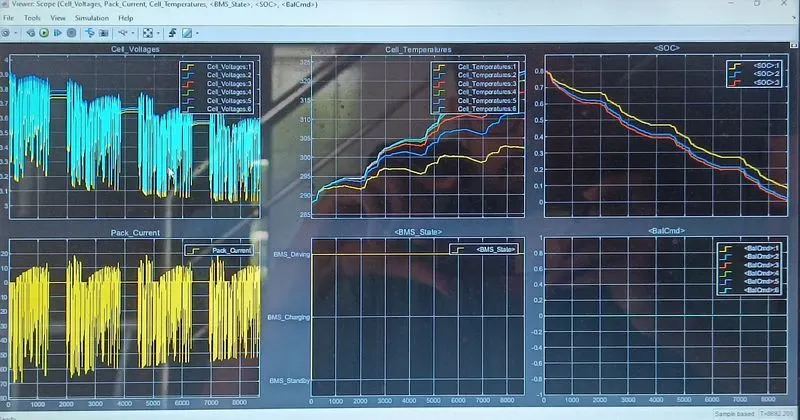
Test case 2: Discharging and No Balancing / At BMS Level Test Condition For Driving:
Result of SOC:
Cell voltages reduced from the initial 4v. Pack current reduced to 0. SOC is initially 80% and reduced to 0%. Cell temperatures increased from an initial 289.15 to a maximum recorded as 323k and the difference in increase is 33k this increase is different and comparatively less than the maximum recorded as 323k for other output graphs. Cell Balancing is idle in this time period. Hence there is no fault observed from the dashboard where all the indication is green.
Test case 3: Charging and Balancing / At BMS Level Test Condition For Charging:
Result of SOC:
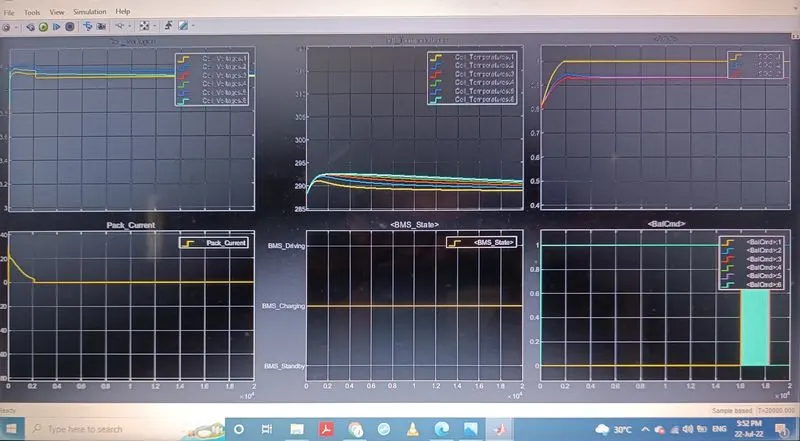
we can observe the constant current (CC) and constant voltage (CV) characteristics of a battery pack. From Initially time period of 0 sec the cell current increased to 30A and the cell voltages also gradually reached 4.2V this phase of operation is called constant current or CC Mode. At the time instant of 0.2sec, the cell voltages gradually become constant till the end of the full charging voltage capacity of the battery pack and at this time instant, the current is gradually reduced to 0. So, this mode of operation is called constant voltage or CV Mode of operation. Generally, cell manufacturers design the CC Mode till the cell reaches 80% of its full capacity and from there the remaining 20% will be considered as CV Mode. SOC is initially of 80% at a time instant of 0.2 sec this is increased to 100% or 1 to its full capacity with variation in different SOC Estimation methods.
As we can observe the SOC is estimated using different methods like
1)Coulomb counting: From the result, the yellow graph shows this method where the SOC reached 100% at a time of 0.2sec
2)UKF Kalman Filter: SOC Estimation from this method is 93%
3)EKF Kalman Filter: SOC Estimation from this method is 93%
Both the Kalman Filter methods are overlapping each other and give the output result of SOC Estimation the same as 93%.
Cell temperatures increased from an initial 288 to a maximum recorded as 292.5 with the difference in temperature rise recorded with other cells' temperature estimation graphs. Cell Balancing is operating in this time period to ensure the maximum capacity reached by all the cells while charging in the equal mode of operation and at the time period of 1.8 sec, the cell balancing is cutoff.
CONCLUSION:
As per the objectives, the BMS Model is tested with 3 cases and the results are analyzed in detail also the coulomb counting is implemented and designed using MATLAB blocks which are used to estimate the SOC.
2) What is coulomb counting? Refer to the above model and explain how BMS implements coulomb counting for SOC estimation?
Coulomb counting is a technique used to track the State of Charge of a battery pack. It works by integrating the active flowing current (measured in amps) over time to derive the total sum of energy entering or leaving the battery pack. This produces a capacity that is typically measured in Amp-hours.
The state of charge of a battery describes the difference between a fully charged battery and the same battery in use. It is associated with the remaining quantity of electricity available in the cell.
It is defined as the ratio of the remaining charge in the battery, divided by the maximum charge that can be delivered by the battery. It is expressed as a percentage as below.
- If the battery is new:
Q m a x = C r Q 0 = 0.5 Q m a x C r
- If the battery is fully charged:
Q 0 = Q m a x S o C 0 = 100 % ">SoC0=100%SoC0=100%.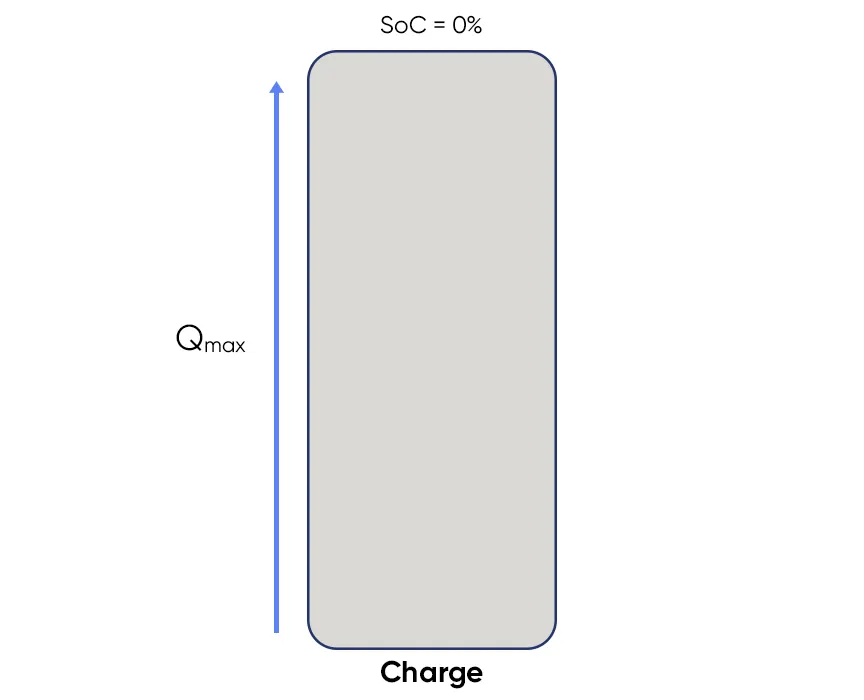
Figure 1: Evolution of the
S 0 C 0 The state of charge may also be considered the other way around and it is called the Depth of Discharge
( D o D ) (2) D o D / % = 100 − S o C / %