Week 7 State of charge estimation
# AIM
1) Simulate the 3 test cases from the harness dashboard and write a detailed report on the results
2) What is coulomb counting? Refer to the model and explain how BMS implements coulomb counting for SOC estimation?
# THEORY
Lithium-ion battery packs are predominant energy storage systems in aircraft, electric vehicles, portable devices, and other equipment requiring a reliable, high-energy-density, low-weight power source. The battery management system (BMS) is responsible for safe operation, performance, and battery life under diverse charge-discharge and environmental conditions. When designing a BMS, engineers develop feedback and supervisory control that:
- Monitors cell voltage and temperature
- Estimates state-of-charge and state-of-health
- Limits power input and output for thermal and overcharge protection
- Controls the charging profile
- Balances the state of charge of individual cells
- Isolates the battery pack from the load when necessary
Simulink modeling and simulation capabilities enable BMS development, including single-cell-equivalent circuit formulation and parameterization, electronic circuit design, control logic, automatic code generation, and verification and validation. With Simulink, engineers can design and simulate the battery management systems by:
- Modeling battery packs using electrical networks whose topology mirrors that of the actual system and scales with the number of cells
- Parameterizing equivalent circuit elements using test data for an accurate representation of cell chemistry
- Designing the power electronics circuit that connects the pack with the controls
- Developing closed-loop control algorithms for supervisory and fault detection logic
- Designing state observers for state-of-charge and state-of-health online estimation
Using Simulink, engineers exercise the battery management system over a range of operating and fault conditions before committing to hardware testing. We can generate C code from Simulink models to deploy your control algorithms for rapid prototyping of systems or microcontrollers. Simulink generates code from the battery and electronic component models, letting you perform real-time simulation for HIL testing to validate your BMS before hardware implementation.
* BMS System
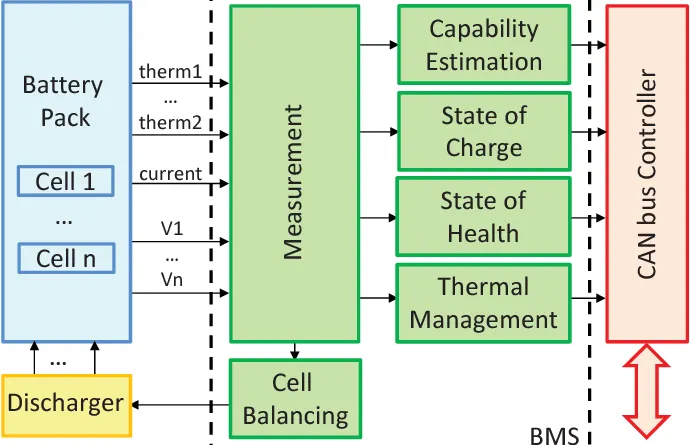
Battery pack of lithium-ion cells is akin to a small explosive. Keeping a close eye on parameters like voltage, charge, and temperature becomes highly important. Unchecked thermal runaway can cause explosion or fire which can be fatal for the vehicle occupants.
Following are the usual functions that a regular Electric Vehicle BMS performs.
- Cell Monitoring: When charging or discharging, battery cells need to be monitored at all times. Any out-of-spec situation must be identified and reported along with the triggering of the safety mechanism. There are integrated circuits equipped with cell monitoring algorithms that perform this function. There is a chain of command where the cell monitoring circuit records the cell voltage and temperature and passes on the data to a cell management controller.
At this stage, some algorithms run to calculate the state of charge (SOC) and state of health (SOH).
- SOC is determined to ensure that the battery is never over or undercharged. SOC can also be seen as a fuel indicator of an electric vehicle as it indicates the energy remaining in battery. Using this information additional algorithms can be run to determine the distance the EV would cover before the battery needs a recharge.
- The SOH is an indicator of overall health of the battery and gives an insight into the operating conditions of the battery. Based on this information, battery lifespan and maintenance schedule can be projected.
Diagnostics is another important dimension to cell monitoring. UDS based diagnostics software help the EV BMS to identify and report the error codes and diagnostic info. - Power Optimization: Direct outcome of cell monitoring is the optimization of battery power. While the cell monitoring functionality determines SOC and SOH, the EV battery management system’s job is to keep the SOC and SOH parameters within the specified values. When the battery is charging, the EV battery management system determines how much current can be allowed in the individual cells. During the EV operation when the EV is discharging, the BMS ensures that the voltage level does not get too low. It communicates with the motor controller to ensure that.
- Safety of Electric Vehicle: Safety is the primary concern when EV power supply and battery management system is in the picture. Undetected thermal runaway can cause major mishap. As mentioned earlier, the BMS captures data such as voltage, temperature and current to optimize the power. Similar set of data is also utilized for ensuring safety. Standards like ISO 26262 have certain requirements that must be fulfilled to ensure that the BMS is developed as a fail-safe system. Another aspect of safety is the insulation of vehicle body/chassis from the battery pack to avoid electric shock to vehicle occupants.
- Battery Charging Optimization: Battery cells deteriorate over time. An intelligent EV BMS factors in this deterioration that results in change on battery parameters such voltage, current, etc. For instance, a battery cell gets slightly damaged by heat and starts getting charged at a lower voltage than the rest of the cells. Battery management system is responsible for identifying this fault and optimizing the charging process so that all cells are charged at the lower voltage. This reduces the stress on the overall battery pack and enhances its life. Of course, the BMS diagnostics will also store this issue as a trouble code so that it is fixed at a later stage. Moreover, oxidation in the battery terminals may lead to reduction in voltage and the BMS adapts to these changes to extract best performance from the battery.
* Common Algorithms
Battery parameters such as voltage, current and temperature are actionable data points that need to be processed in order to derive certain metrics. For instance, battery voltage can used to compute the distance an electric vehicle can cover before the battery gets exhausted.
A battery management system does several such calculations for which algorithms are written. Let’s understand two of these:
- Cell Balancing Algorithm: We discussed about how different cells in a battery pack can develop different capacities with time. A battery cell might reach a maximum of 3.7 volts compared to others that reach up to 4.2 volts. That cell will also be the first to discharge. As the result, the pack cannot be used at its max potential. The cell balancing algorithm comes to rescue in such circumstances. Two kinds of cell balancing technique are deployed- active and passive cell balancing. In the active balancing technique, the stronger cells are used to charge the weaker cells so that their potential is equalized. Passive balancing works by discharging the excess voltage of the stronger cells by connecting them with a load.
- Communication Algorithms: Different ECUs in an electric vehicle require battery parameters in order to work efficiently. For instance, the BMS communicates with the EV motor control to ensure that it is drawing current in an optimized manner. Similarly, the BMS communicates with an external charging device to pass on the required current and output voltage information. It also controls when the charging starts and stops. If there is any out-of-spec issue, BMS cuts off the connection and stops the charging.
# SIMULINK MODEL
After downloading the zip file, First we have to extract the zip file to a folder and then choose Battery_System_R2020a again to extract to a a folder.
Then to get access for the Close Loop BMS harness dashboard, we have to check for the following model Test>System>BMS_ClosedLoop_Harness_Dashboard model file.
After opening this file Matlab will ask the following question:-
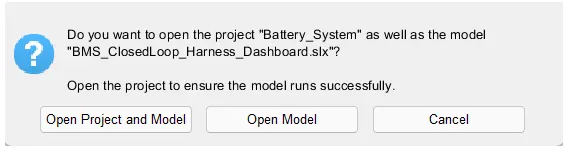
I have selected to Open Project and Model and after that the whole project will be loaded in the Matlab in current folder and workkspace.
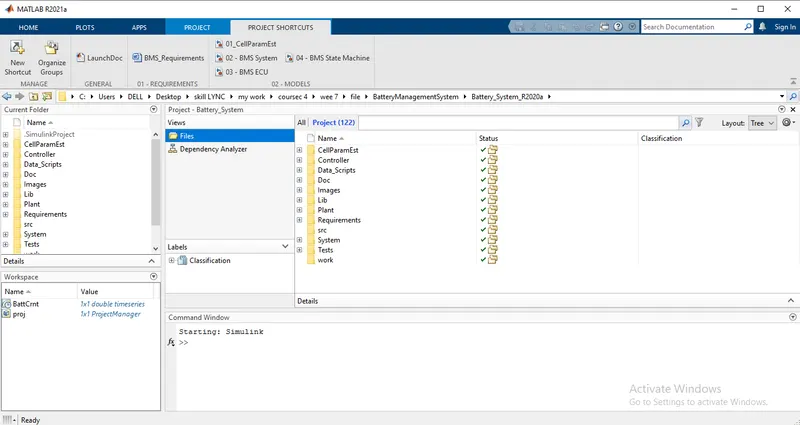
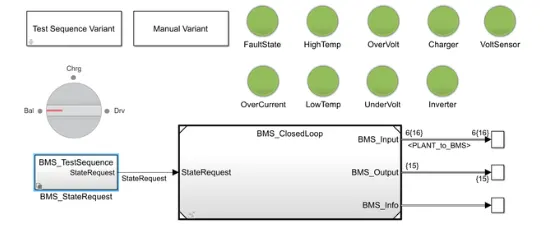
After this the BMS_ClosedLoop_Harness_Dashboard model file is open as:-
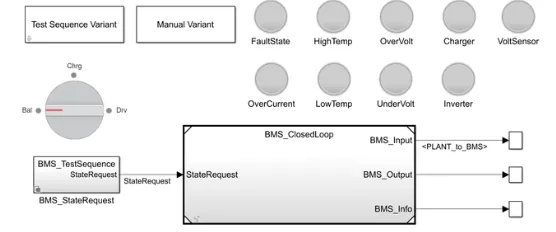
Block of Model
- The Test sequence Variant (it has 3 different test condition)
- The Manual Variant (selection)
- BMS_StateRequest subsytem to provide the state request command.
- Indictaing lamps are there to show fault state, High Temp, Overvoltage, Charger, Voltage Sensor, Overcurrent, Low temp, Under Voltage, Inverter state of a battery. Green light tell us that all states are Ok and battery is good to charge and discharge and red indication will indicate the fault state.
- The Rotating switch for manual variant to change the position during simulation run time
- BMS_Closed Loop: This subsystem contain BMS ECU and Plant as two main subsytem and lets see this block in details:-
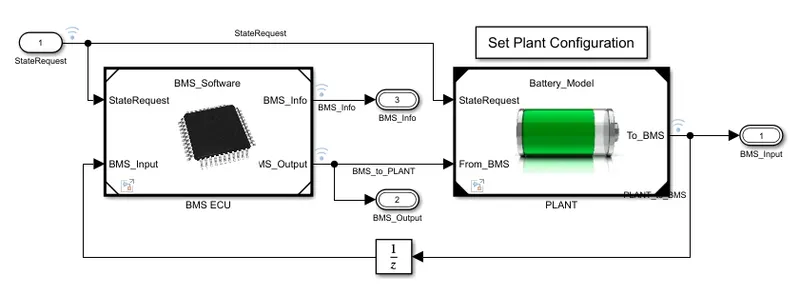
BMS ECU
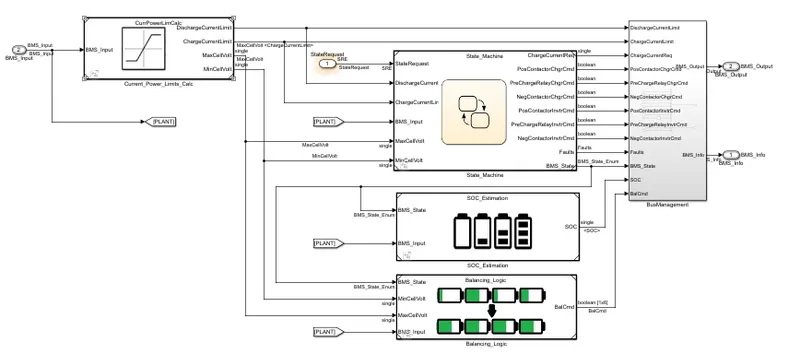
- The BMS ECU get have two input which are BMS_Input which is feedaback from the Plant model and the state Request is coming from the state machine .
- This is generating output as BMS Output and Info which have current power limit calculation in State Machine, SOC estimation and Cell balancing logic as shown below:-
Plant
- Subsytem contain Battery pack, precharge circuit and charger / loads.
- The battery pack there are two configuration which are 1 module (6 cells) and 16 module (96 cells).
- We have selected 1 module for simple calaulation and less simulation time.
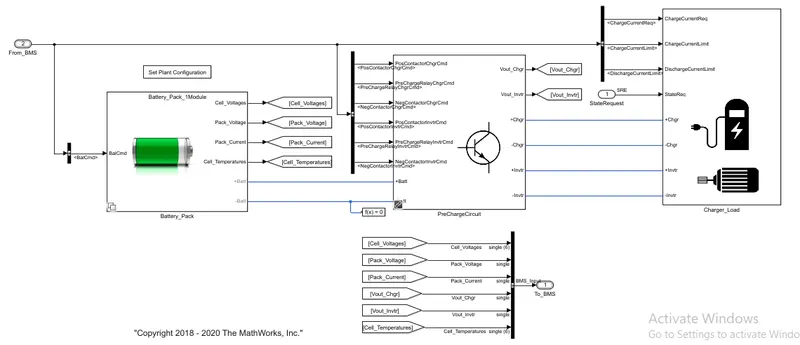
In the scope SOC of module, Cell voltages, Pack current, Cell temperature, BMS state and cell balancing command are seen as output
#EXPLANATION
1) Simulate the 3 test cases from the harness dashboard and write a detailed report on the results
* Test Case 1
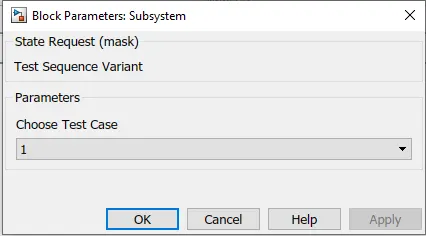
click on Test sequence Variant block
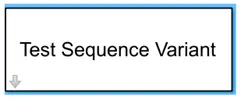
then select test case 1
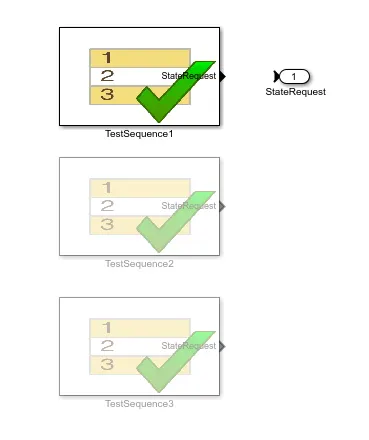
From BMS_StateRequest
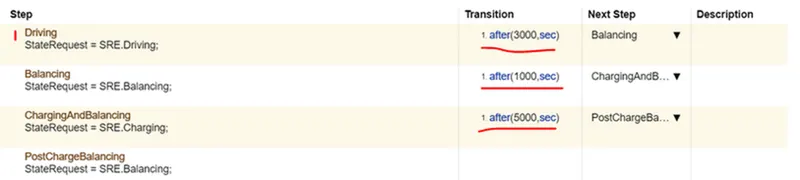
from the above chart, we see that
- Driving is for 3000sec
- Balancing is for 1000sec
- Post Charge Balanceing is for 5000sec
now we are running the simulation
Result
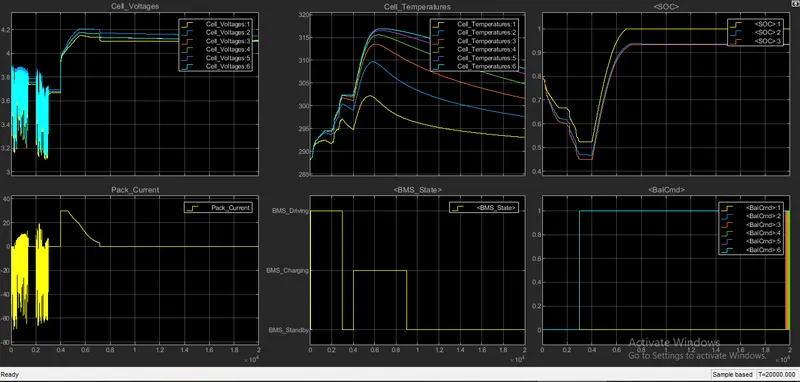
i) Driving (Discharging) mode (0-3000 sec):-
- All the cells for the first 3000 sec are in driving mode so the dicharge of all the cell occurs and its varies in the range of 3.1 to 3.9 V (min and max.).
- Cell temprature increases from 288K to 302 K.
- SOC also reduces from 80 % to 45% for EKF technique.
ii) Balancing mode (3000-4000 sec) :-
- After 3000sec for 1000 sec, cell balancing occur and the Modules are in standby mode and they are having constant voltage near about 3.7V.
- Cell temperature reduces slowly as no current flow through the cells during balancing.
- SOC is also constant during this period i.e. 45% for EKF technique.
iii) Charging and Balancing (4000- 9000 sec):-
- After 4000 sec the charging occurs and the cell voltages increased from 3.7 to nearly about 4.2 V in Constant current mode with current of nearly 30A and then the constant voltage charging starts and current reduces from 30A to 2.6 A Charging and balancing of cells occur till 9000 sec.
- Cell temperature also start to increase exponentially upto constant current region and reduces as current flow reduces in constant voltage mode.
- SOC also increases from 45% to 94% in this mode for EKF technique.
iv) Post charge Balancing (9000- 20000sec):-
- After 9000 sec the post cell balancing starts under standby mode.
- Cell temperature reduces in this mode and tries to reach the ambient temperature.
- SOC remains constant to 94%.
Cell Voltages and Pack Current
- First 3000secs all 6 cells are in drive mode where discharging occurs majorly and in standby mode for lesser duration at approximately 1000 to 2000 secs.
- Voltages varies from 3.1V(min) to 3.9V(max) in this range.
- From 3000 secs to 4000secs cell balancing occurs and this stage the module in standby mode and voltage is constant at nearly 3.7V.
- After 4000secs charging occurs,the voltage raised from 3.7V to 4V. At 4V to 4.2V at constant current as nearly 30 A and after 4.2 V as constant voltage,current reduces from 30A to 2.6A
- At the end of the charging and cell balancing occurs upto 9000Secs.
- After 9000 secs post charge cell balancing starts and all cell voltages are balancing to a voltage with respect to cell 1 to 4.1 V as shown below,in this stage the pack is in stand by mode.
Cell temperatures
- Initially for 3000Secs temperature range of cells increases gradually from ambient temperature 288K to 302K.
- Temperature of cell 1 is lesser and cell 6 has higher temberature for all stages.
- After 3000secs upto 4000secs cell temperatures are reduced slightly as no current flows through cell in standby mode.
- After the 4000Secs temperature starts increases exponentially upto constant current region and start reduces as current flow reduces in constant voltage and cell balancing region upto 9000secs.
- Cell 1 maximum temperature raised upto 302K and cell 6 temperature raised upto 317K.
- After 9000secs temperatures still reduces and remains stable at reaching ambient temperature.
BMS State
- For 3000 secs battery module in drive mode(discharging).
- From 3000 secs to 4000secs the battery module in balancing standby mode
- After 4000 secs upto 9000secs battery module in charging and balancing mode.
- After 9000secs only post charge balancing mode operates upto end of the simulation.
SOC
- Initially state of charge of battery module is in 80%.
- The yellow plot represents SOC estimation done by coulomb counting technique.
- Blue plot represents the SOC estimation using Unscented Kalman filter technique.
- The red plot represents SOC estimation using Extended Kalman filter technique.
- Among three UKF and EKF techniques estimate accurately than the coulomb counting technique.
- Initially for the 3000 secs SOC decreases to nearly 45% during drive mode.
- After 3000secs upto 4000 secs SOC is constant at 45% as cell balancing occurs in standby mode.
- From 4000 secs to 9000secs the module in charging mode.(4000 to 7000=CC mode,7000 to 9000=CV mode).
- After 9000 secs the SOC becomes constant approximately 94%.
Balanceing cells
- Initially upto 3000 secs the balancing was not performing.
- After 3000 secs cell balancing starts with on cell 6 and cell 2 as they rised to 1 since its voltage is higher than all other cell voltages.
- After this stage charging and balancing,the post charge balancing are occurs as Cell 6 and cell 2 remains in 1 state till end of simulation.
- As cell 1(yellow) is lesser voltage than other cells it remains in 0 state through out the simulation.
- At end of the simulation all cell voltages try to balance equally as we seen earlier in single cell voltages plot.
* Test Case 2
We can see the Test sequence in BMS_StateRequest>BMS_TestSequenece and we can see that the test case we have selected is as shown below:
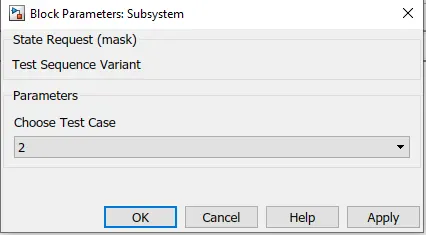
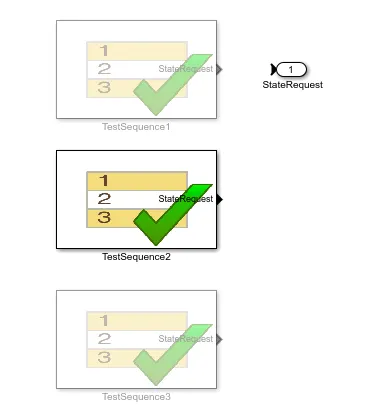

The editor figure tell us about the test sequence and it is as following:-
- Driving is done for first 10000 sec.
- Then Charging is done for next 10000 sec.
Simulation is ran for 20000 sec and the result are as below:-
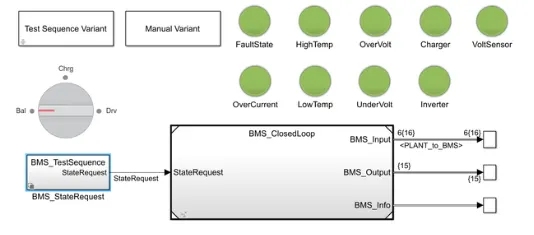
Lamp indication were green for all states which means the model is fault free.
Result
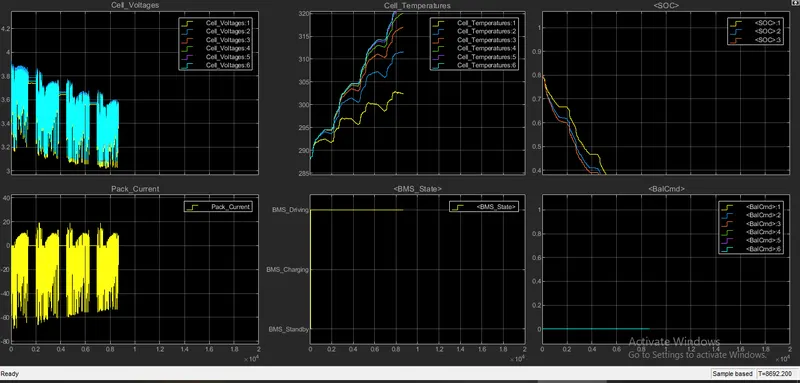
i) Driving Mode (0-10000 sec):-
- The cell voltage varies from 3.9 V to 3.05 volt ehich is cut off voltage of cell and the entire cell is drained upto 8692 sec.
- Cell temperatures varies from 288K to 322.5K.
- SOC reduces from 80% to 0% (cell got fully drained) in the drive mode under 8692 sec
- Cell balancing is not performed here
ii) Charging Mode (10000- 20000 sec):
- The cell got drained earlier before reacching this mode.
Cell Voltages and Pack Current
- Cell voltages varies from maximum 3.9V and reduces to 3.05V as cutoff voltage upto 9000 secs.Entire capacity drained at 9000 secs.
- Pack current discharges upto maximum 70A and slight charging occurs during the overall drive.
- Some stand by mode conditions are in between drive modes.
Cell temperature
- Here cell 1 having lesser temperature variation from 288K to approximately 302.5K.
- The Cell 6 is having higher temperature variation from 288K to approximately 322.5K.
- Cell temperatures are slightly reducing in between the drive modes as these durations are in stand by modes.
Battery module state
- Entire sequence is performing in drive mode.
- Small duration of the standby modes are not plotted in this plot as simulation upto 10000secs command is given as drive mode.
- But in the actual practical situation standby modes are not present present as battery current drains by other small auxilaries of EV's.
SOC of module
- Here SOC reduces from 80% to 0% (as current drained for longer duration) in entire drive mode as shown in above plot.
- At stand by modes in between them the SOC remains constant.
Balancing
- Here the balancing of cells are not performed as shown as balance states are in 0 for entire drive mode.
* Test Case 3
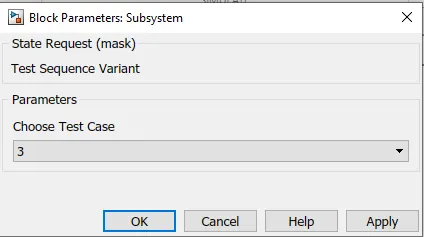
Test case 3 is selected as shown below in the dialog box and click OK to implement it.
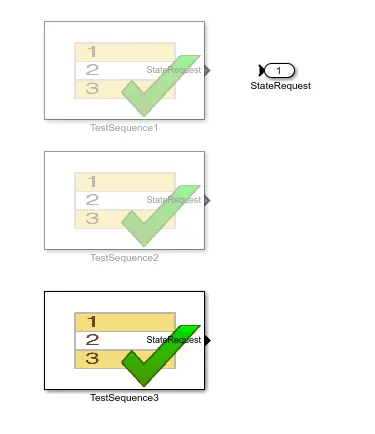

The editor figure tell us about the test sequence and it is as following:-
- Charging is done for entire simulation period i.e. 20000 sec.
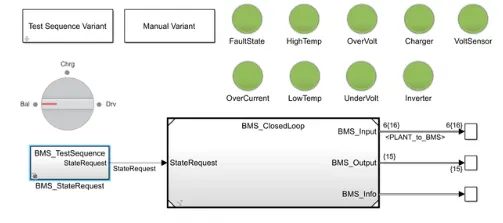
Lamp indication were green for all states which means the model is fault free.
Results
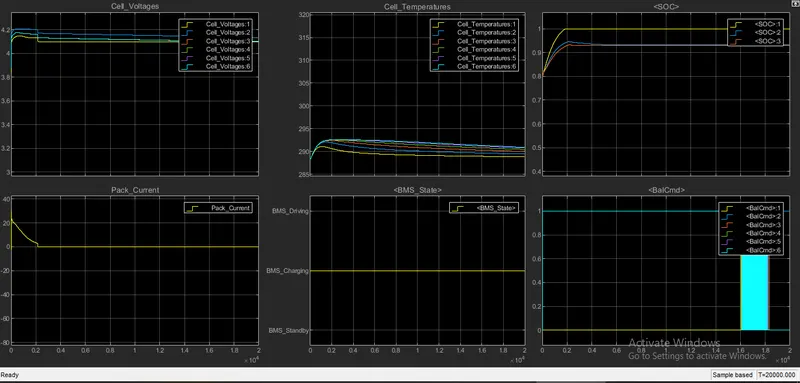
i) Charging (0-20000 sec):
- Cell Voltages increases from there intial values and after 2000 sec they got constant .
- Pack current initally start from 0 to 30A and then start decreasing when the constant voltage mode is there to 2.5 A and got full charged upto 2000 sec.
- SOC was initally 80% and in 2000 sec it got fully charged that is 100%.
- Cell temperature starts to incraeses initally and when battery got fully charged then decrease down to the ambient temperature.
Cell voltages and pack current
- Initially the cell 2 , voltages rises from 3.9V(approx) to maximum 4.2V and stabilised to 4.15V.
- Cell 1 raises from 3.85V to 4.1V and stabilised to 4.08V.
- The battery pack current raising from 0A to 30A and starts reduce to 2.5 A gradually at end of full charging upto 2000 secs.
- At the 2000secs pack is fully charged to 100%.
Cell temperatures
- Cell temperatures continue to increase heat upto full charge and after that the temperatures get started reduces to ambient temperature.
- As shown from plot the temperatures start decreases after full charge(at 2000 secs).
BMS state
- Entire battery pack sequence is operating in charging mode.
SOC
- In this pack SOC gets fully charged at 2000secs and remains at full charge for rest of the sequence as shown above.
- Actual state of charge is around 93% shown as full charge shown by UKF and EKF techniques.
Cell Balancing
- From 0sec the cell 6 and 2 starts to balance with respect to cell 1 and all cells are try to balancing at end of simulation.
2) What is coulomb counting? Refer to the above model and explain how BMS implements coulomb counting for SOC estimation ?
* Coulomb Counting Method
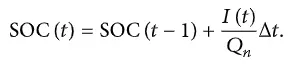
Coulomb counting method measures the discharging current of battery and integrates the discharging current over time in order to estimate SOC. Coulomb counting method is done to estimate the SOC(t) , which is estimated from the discharging current,I(t) , and previously estimated SOC values,SOC(t-1) .
SOC is calculated by the following equation:
But there are several factors that affect accuracy of Coulomb counting method including temperature, battery history, discharge current, and cycle life.
* Modified Coulomb Counting Method
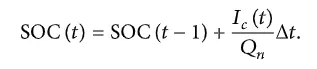
To improve the Coulomb counting method, new technique called modified Coulomb counting method is proposed. Modified Coulomb counting method uses the corrected current to improve the accuracy of estimation. Corrected current is the function of discharging current. There is a quadratic relationship between corrected current and discharging current of battery. By practice of experimental data, corrected current is calculated by the following form:

where k2 , k1 and k0 are constant values obtained from practice experimental data.
Modified Coulomb counting method, SOC is calculated by the following equation:
* SOC estimation in Battery model
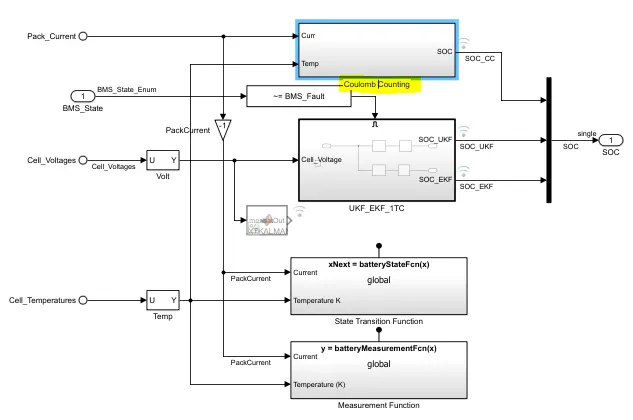
To observe coulomb counting method we need to open the BMS_ClosedLoop>BMS ECU and then on SOC_ Estimation block
Here we see that there are three method for calculation of SOC estimation and these are:
i) Coulomb counting
ii) Unscented Kalman filter
iii) Extended laman filter.
In coulomb counting block
- Accepts two input signals: current and temperature, with the current signal going to the gain block and the temperature signal going to the battery time and current lookup tables.
- Both blocks are linked to the split block, and these signals are sent to discrete-time integrator to track the charge, which then aids in the calculation of the state of charge.
- The positives of this is its simplicity and cheap capital cost, while the disadvantages include a buildup of current sensor error and its inability to recover from the erroneous start condition. due to a lack of voltage measurement feedback.
- Opening the coulomb counting method we get to see the gain, 1-D look Up table, Product and Discrete Time Integrator block
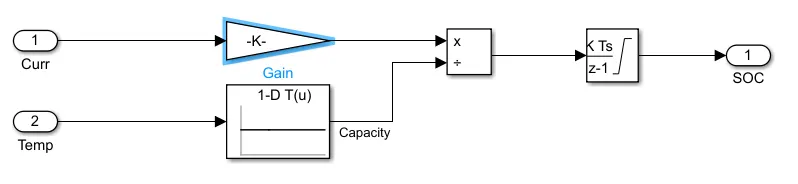
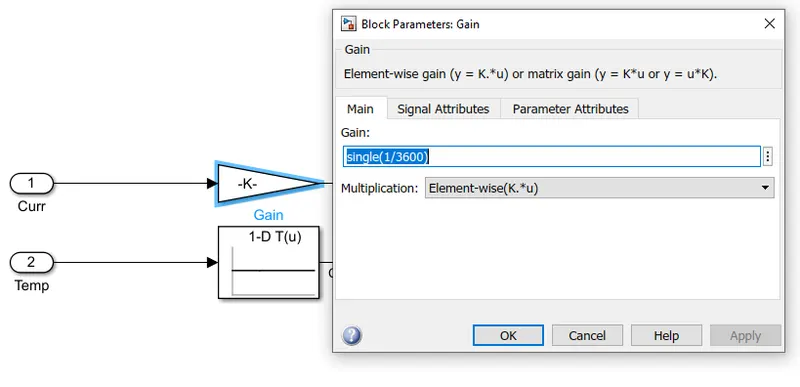
The discharge current from the battery given to a gain having value of 1/3600 to convert A to Ah.
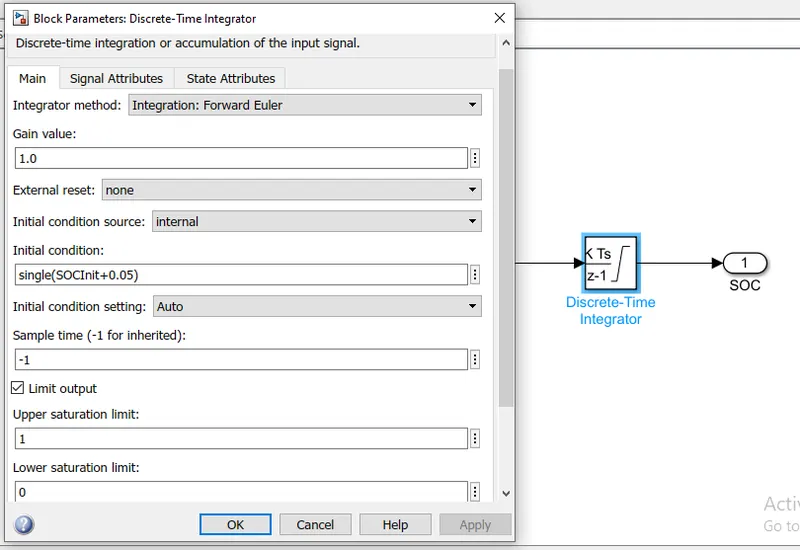
- Current is divided by the capacity due to temperature change and then intregrated with the gain value of -1 wo=ith sample time of -1 as discrete type integrator is used here.
- The saturation limits are given which are 1 to 0. So that we get SOC value from 0 to 1 multiplied with 100 to get percentage of SOC.
- Coulomb Counting methos is simple and it require less computational compared to other two methods.
# CONCLUSION
Tested 3 test conditions using harness dashboard ,Studied about coulomb counting and how BMS implements coulomb counting for SOC estimation.