Week 7 State of charge estimation
STUDENT OF ONLINE EV BATCH 16
ONLY QUESTION NO. ONE WAS TOLD TO COMPLETE.
ANS 1 :
1.Simulate the 3 test cases from harness dashboard and write a detailed report on the results.
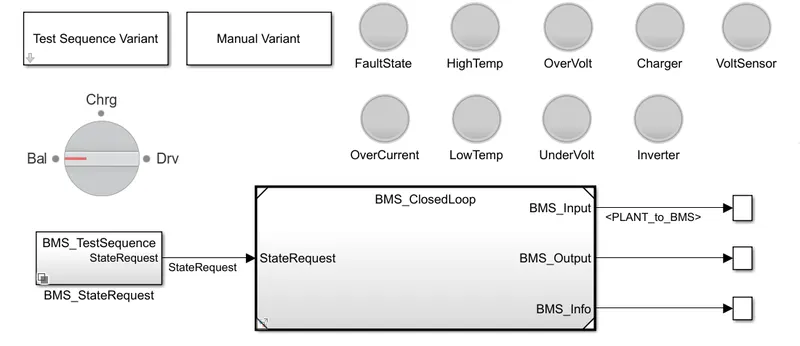
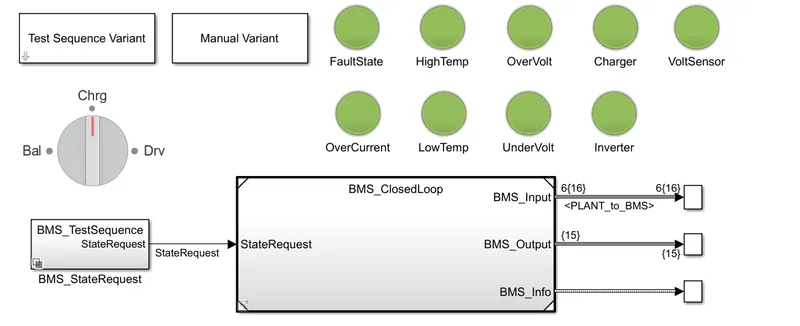
HARNESS MODEL :
PROCESS :
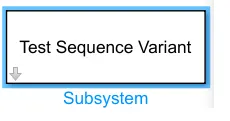
- From this block, you are going to simulate all three cases.
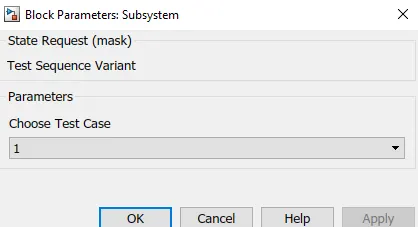
- Test Sequence Select 1 for case 1.
- Test Sequence Select 2 for case 2.
- Test Sequence Select 3 for case 3.
- Get the desired simulation results.
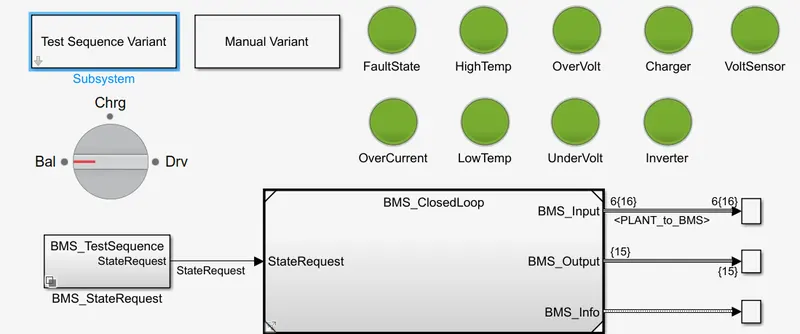
CASE 1 :
SIMULATION RESULTS :
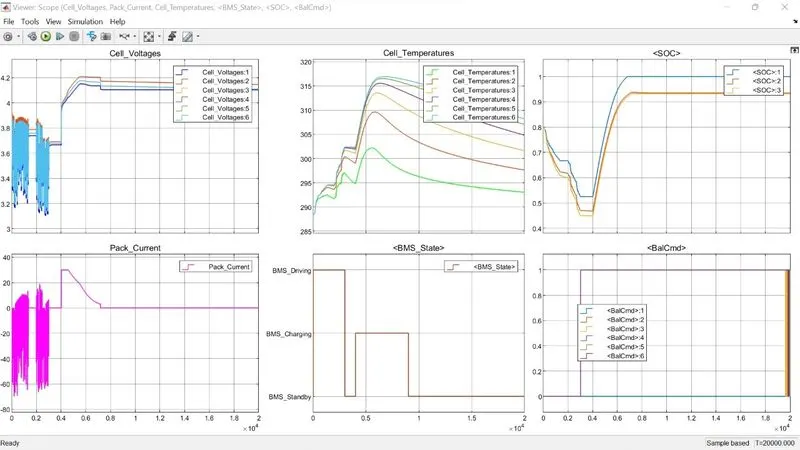
- The Ist plot represents the cell voltage.
- Cell Voltage fluctuates from the 3.2 to 3.8.
- Nominal Voltage of each cell is 3.8 V and it decreases to 3.1V.
- The 2nd graph represents the Cell temprature.
- The cell temprature increases in driving cycle as of vehicle, and reduces and then start charging.
- The temprature increases suddenly then later at charging and post charging , the cell is representing the decrease in nature.
- The 3rd graph represents the SOC.
- During Driving state , the SOC reduces from 80% to 45%.
- During balancing state, SOC remains constant at 45%.
- Then increases to 100%
- The 4th graph shows the Peak current.
- As the current decrease while charging the current is -60 A from 0 to 3000 s.
- Then becomse constant at 4000s and decrease for 4000s to 8000s.
- Then remains constant for till 20000s.
- The 5th graph shows the BMS state.
- During the 0 to 3000s it shows that the vehicle is in driving mode from 3000 s to 4000 s.
- We have standly mode from 4000 s to 8000 s, there is charging.
- Then after 8000s it becomes constant till 20000s.
CASE 2 :
SIMULATION RESULTS :
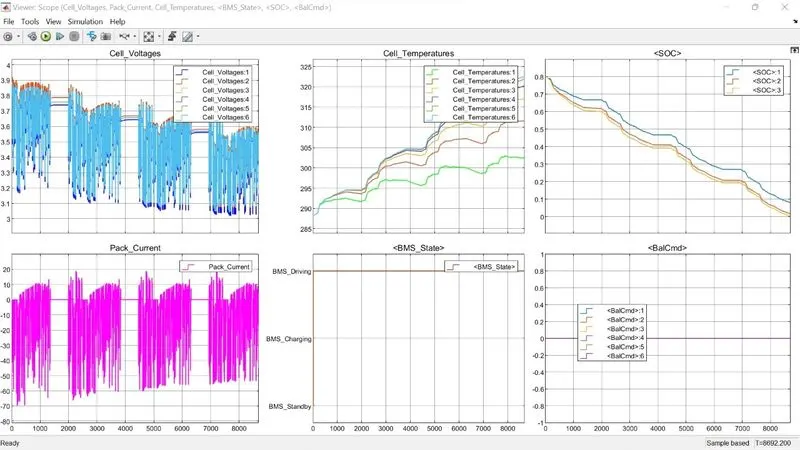
- Cell Voltage Fluctuates from 3.9 V to 3.2 V rapidly.
- Battery peak current fluctuates from 0 to -60 A and then rises to 10 A rapidly.
- Cell tempreature increases as there is driving cycle stage from 0 to 10000 s.
- BMS graph shows the BMS driving from 0 to 10000 s.
- SOC continues to decrease from 80% to 0%.
CASE 3 :
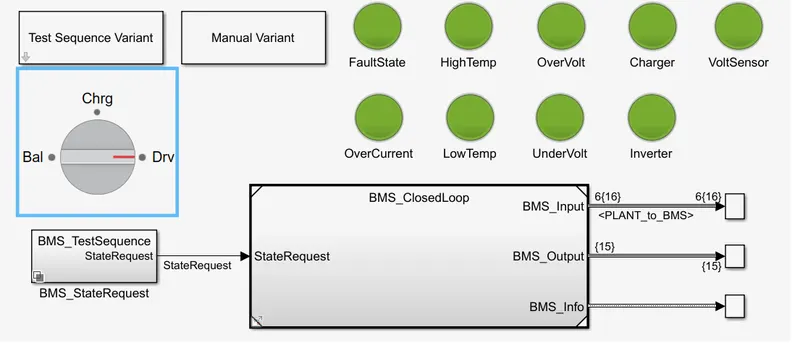
SIMULINK RESULTS :
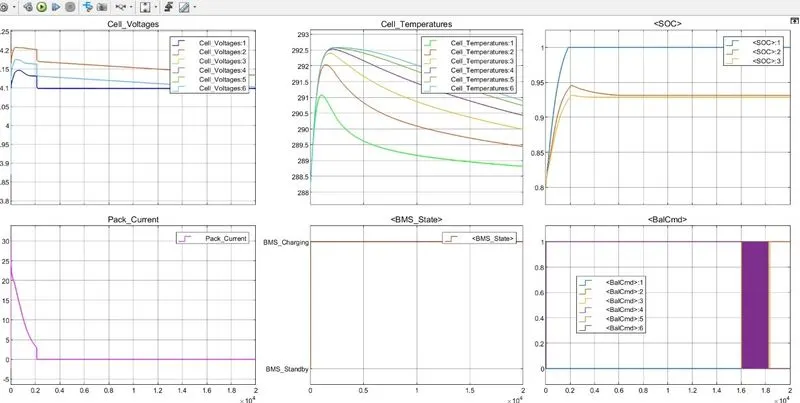
- Cell voltage varies till 2000s and then remain constant.
- At starting peak current increases to 20 A and then reduces to 0A at 2000s and then remain constant.
- Cell temprature varies as in graph.
- BMS graph shows BMS charging as there is charging stage.
- As only Charging occurs the SOC was 80% and now increases for 100% in 2000s then it remains same.