Week 7 State of charge estimation
1.Simulate the 3 test cases from harness dashboard and write a detailed report on the results
2.What is coulomb counting? Refer to the above model and explain how BMS implements coulomb counting for SOC estimation ?
An overview of new and current developments in state of charge (SOC) estimating methods for battery is given where the focus lies upon mathematical principles and practical implementations. As the battery SOC is an important parameter, which reflects the battery performance, so accurate estimation of SOC cannot only protect battery, prevent overcharge or discharge, and improve the battery life, but also let the application make rationally control strategies to achieve the purpose of saving energy. This paper gives a literature survey on the categories and mathematical methods of SOC estimation. Based on the assessment of SOC estimation methods, the future development direction of SOC estimation is proposed.
Objective:
A)To run three test cases from harness dashboard of closed loop BMS control.
B)To explain coulomb counting for finding the SOC estimation in BMS.
Downloading and open closedloop BMS harness dashboard model:
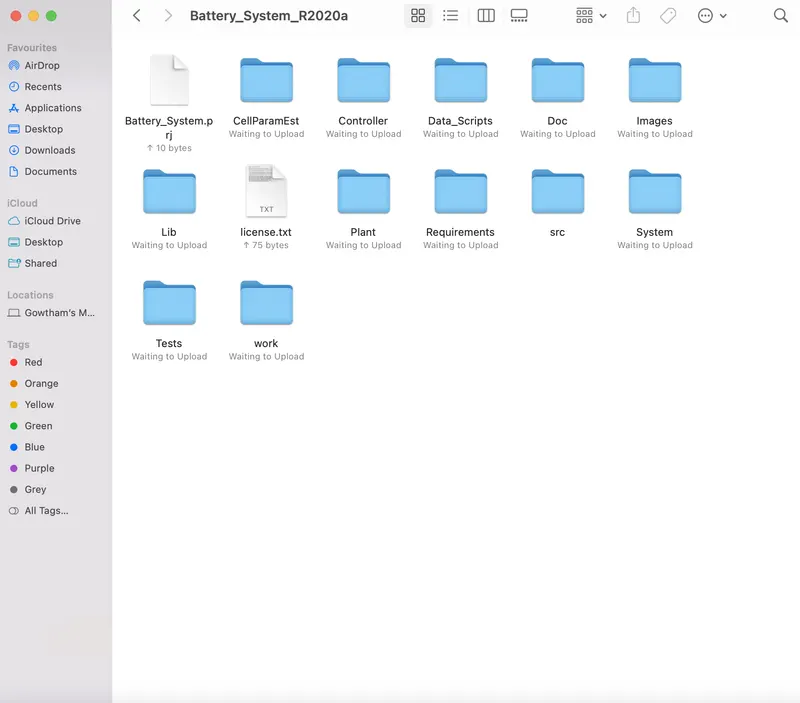
In file exchange open the document of 'Design and Test Li-ion Battery Management Algorithm'. Download the Zip file and extract to a folder. The folder consist of these files as shown below,
Open the Matlab software and simulate then open model file of BMS harness dashboard in to Matlab window and opening model in Simulink.
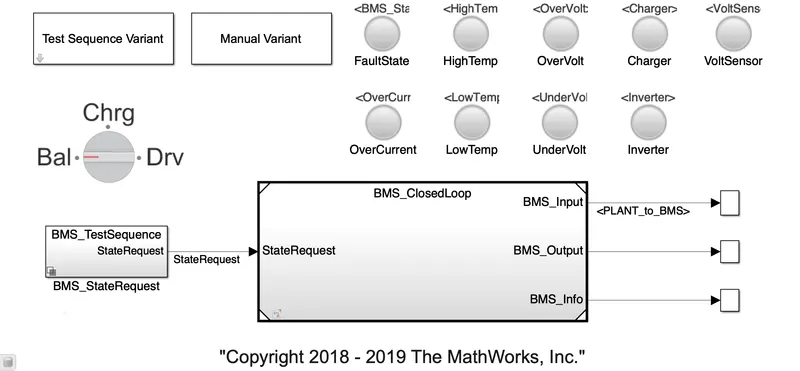
The model file opens and shown below
Block in model
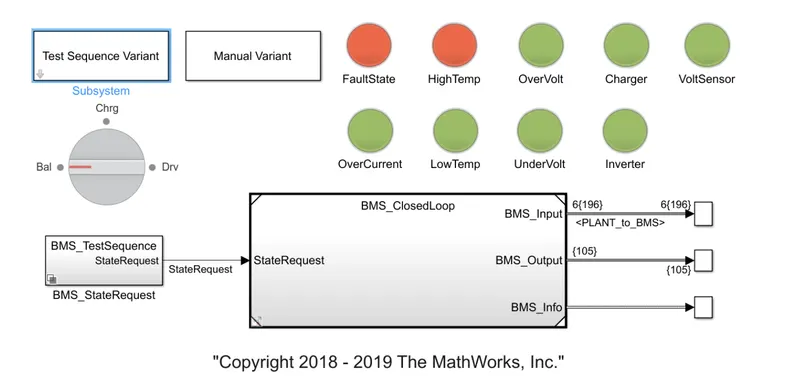
Test Sequence Varient(Selector). Manual Varient(Selector). BMS_Testsequence state request(Subsystem) to provide state request commands. Lamps to indicate Fault state,High temperature,Over voltage,Over current,charging ,voltage sensor operation,inverter operation,low temperature,Under voltage.If any fualt in these red indication will intimate us and all in good conditions indicated by green indication. Rotating switch for manual Varient changes while running simulation. In scope results the SOC of module,Module current,Individual cell voltages,Individual cell temperature,Battery state,Cell balancing states are seen as outputs.
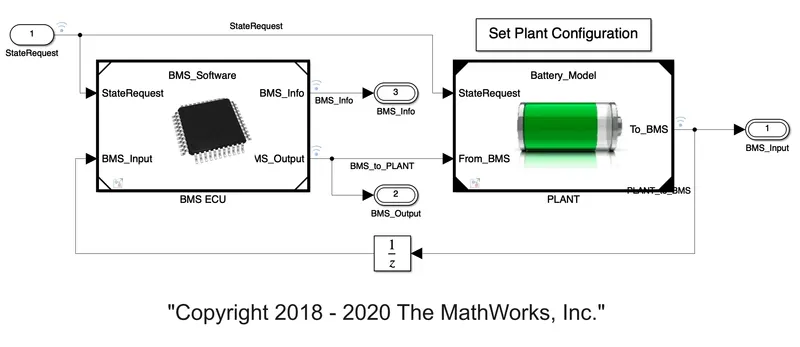
In this model BMS and ECU unit is connected in the power limit to calculating the state machine block, soc estimations, and cell balancing logics as shown in this model.
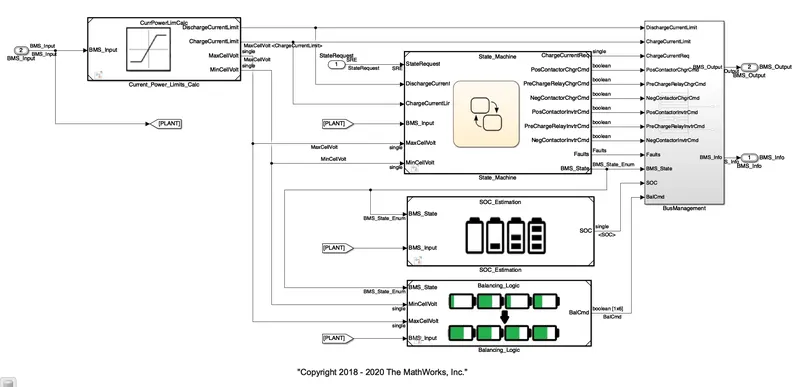
In Plant unit,the battery pack unit,Pre charge unit,charger/load units are created. In battery packs there are two types of configurations as 1 module(6 cells) and 16 modules(96 cells). Here we are chossing 1 module for lesser simulation running time.
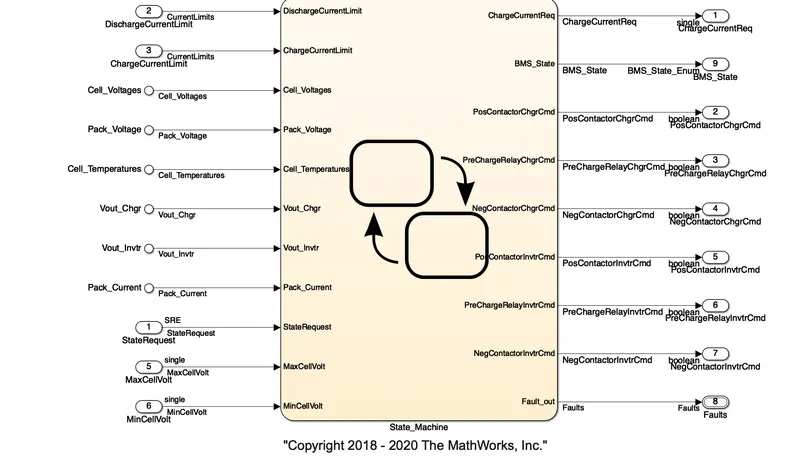
State machine chart has been shown in this pic
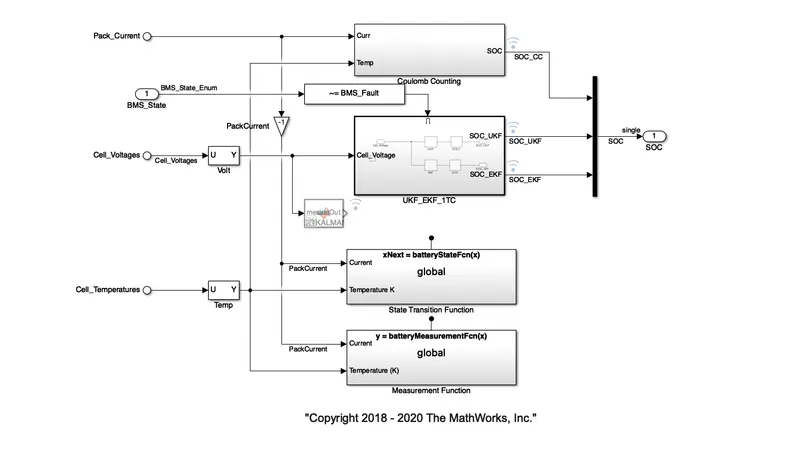
Soc estimation is shown I used to calculate cel voltage and cell temperature and battery current flow.
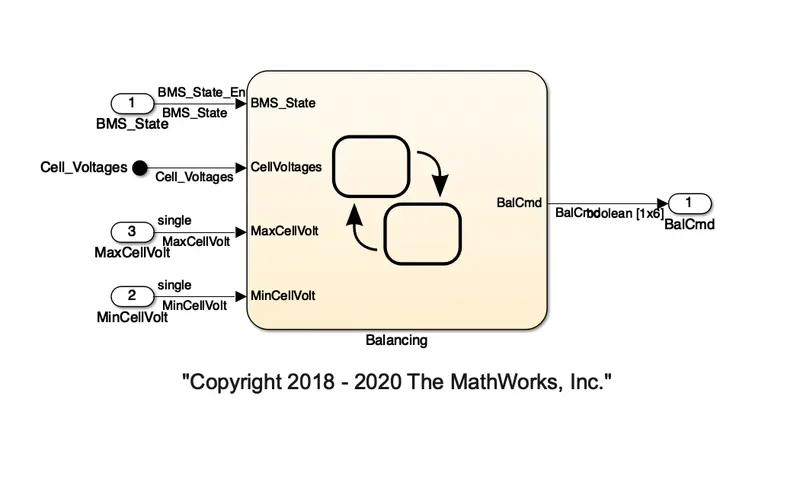
Cell balancing chart is show in this chart it takes cell voltage and BMS state of charge and output as cell balancing.
This plant battery model shows the battery pack current and pack voltage and cell temp from the reference
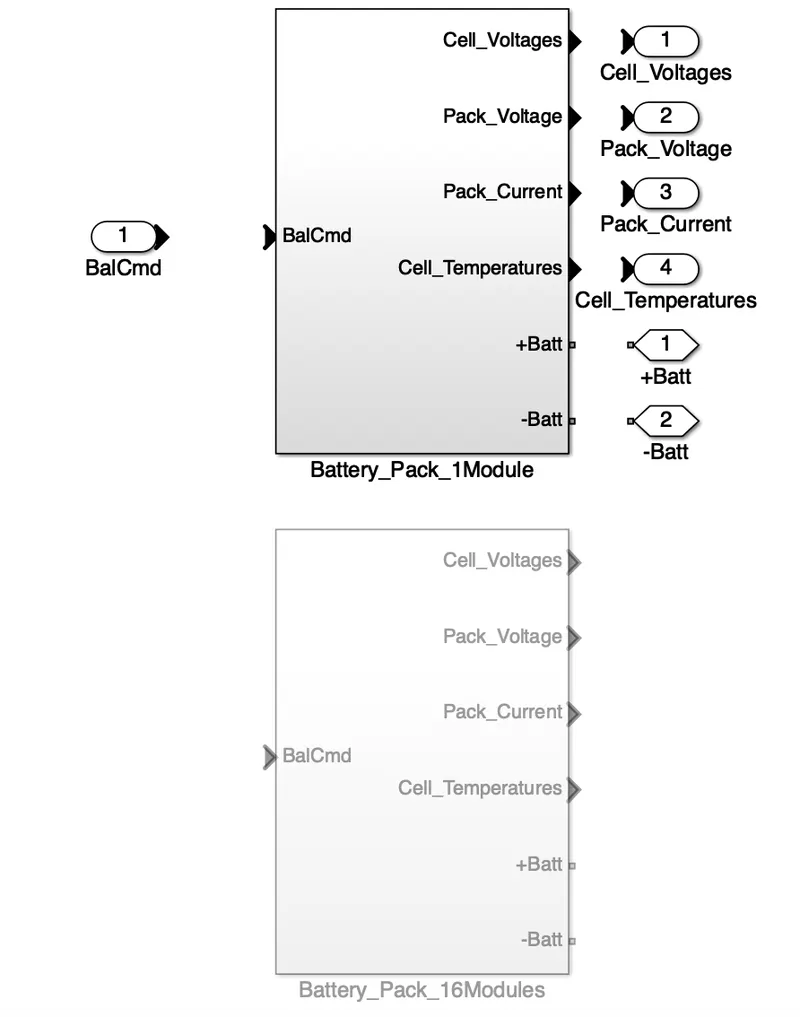
In this two subsystem we can see the single battery model and another one is battery pack 16 model single module is declare as faulted cell and 16 pack module is consider as normal pack.
In this condition how the faulty cell takes control the total battery pack.
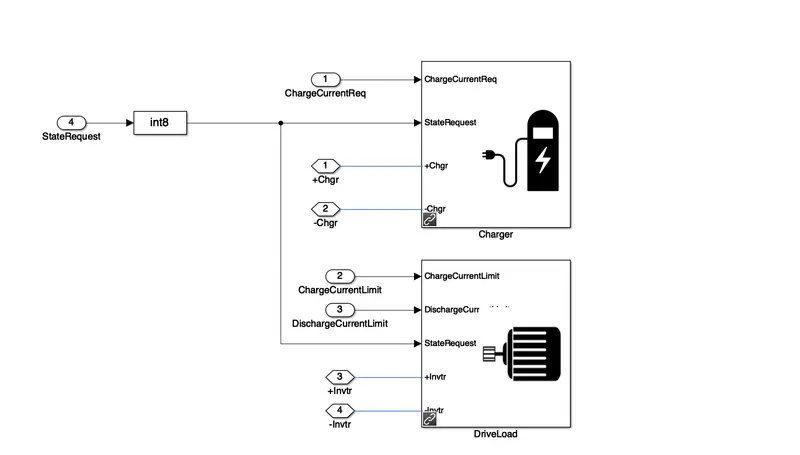
In-plant model there is a subsystem called charger load in that charger load it consist of two subsystem connected with state request signal it controls the charging and drive load
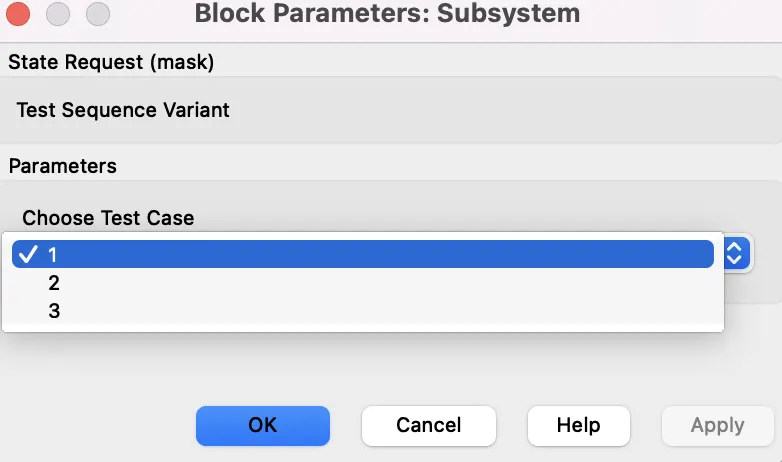
In this test sequence variant block it consists of three test cases each case consist of suppurate condition and it show the error in the dashboard as signal.
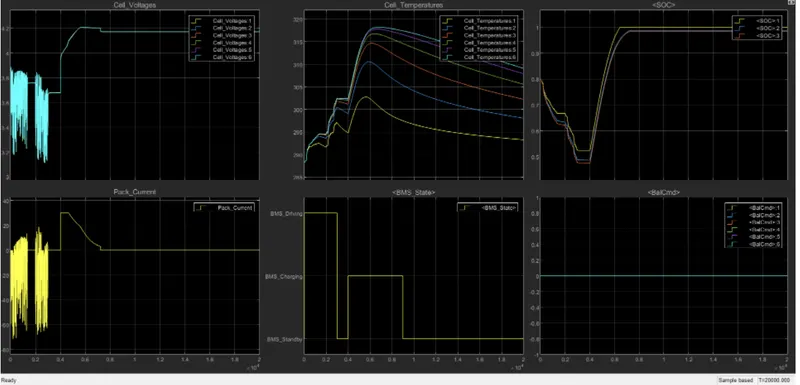
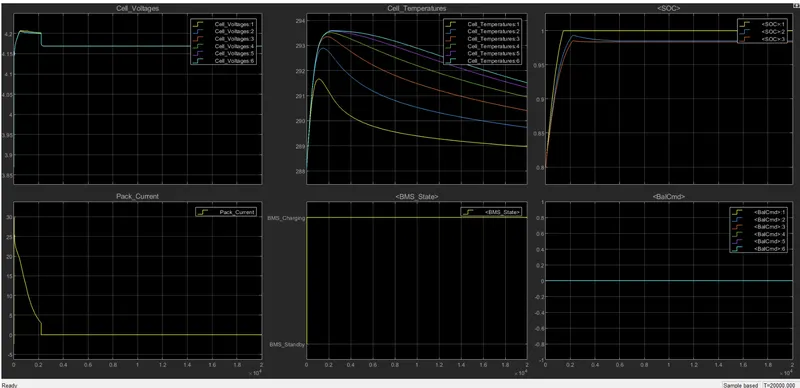
Case 1 results are shown in this graph.
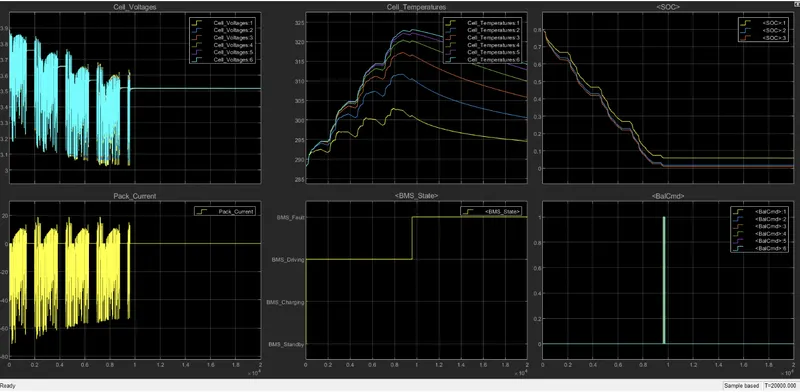
After the compilation is a successful view of the scope. The scope consists of the measurements of cell voltage and pack current pack voltage and BMS state.
Then we have to run the system for the given simulation time. The result shows that there is a fault condition in the vehicle. The dashboard on the model depicts the same with a red colour indication.
The scope shows the various parameters for the BMS model under second test case. After 10,000 sec when the driving cycle is over, the fault condition occurs and so the SOC does not increase even for the charging phase.
In case 3
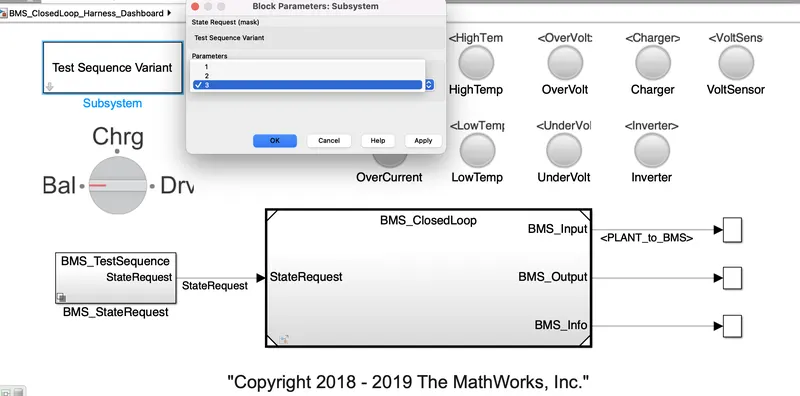
After applying the selection test case we have to run the simulation. The dashboard shows there now error by indicating green light.