Week 7 State of charge estimation
SOLUTION 1 : Simulate the 3 test cases from harness dashboard and write a detailed report on the results .
Here, we have to simulate 3 test cases from harness dashboard. We need to select the harness dashboard from the Project file downloaded with the reference :
The BMS Closed Loop Harness dashboard is represented below :
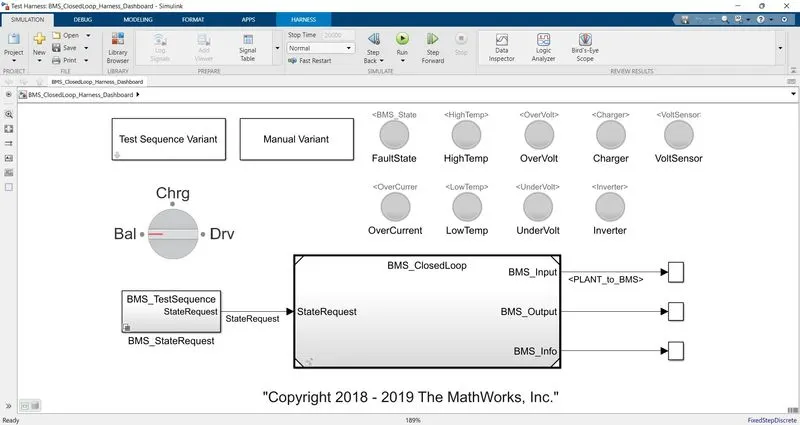
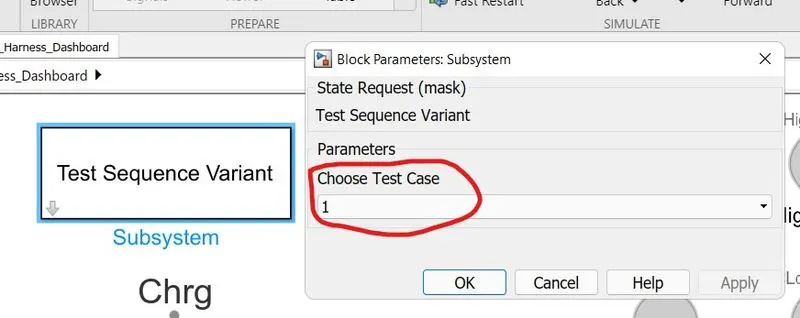
1. Click on the Test Sequence Variant block and select Test Case 1.
Now clicking on the BMS sequence block we get the chart,
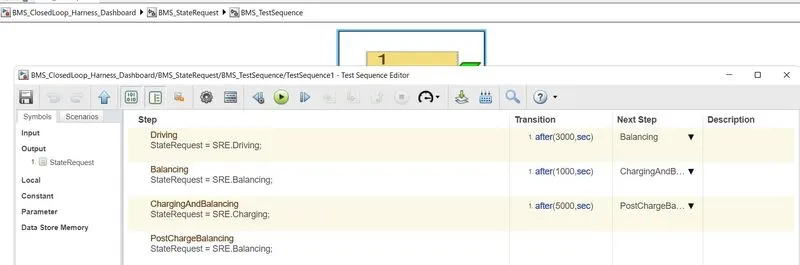
When the Simulation starts, the model is in Driving condition. After 3000 secs, it will be in Standby mode and balancing will occur.After 1000 secs, it will be in charging mode and after 5000 secs, it will be again in balancing mode.
Now, by running the simulation
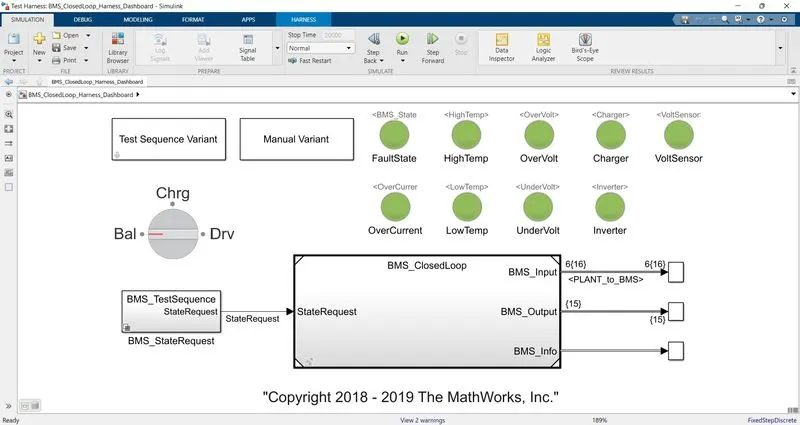
Results :-
Here all are in green plot. So, we can not see any fault and as shown in the figure below.
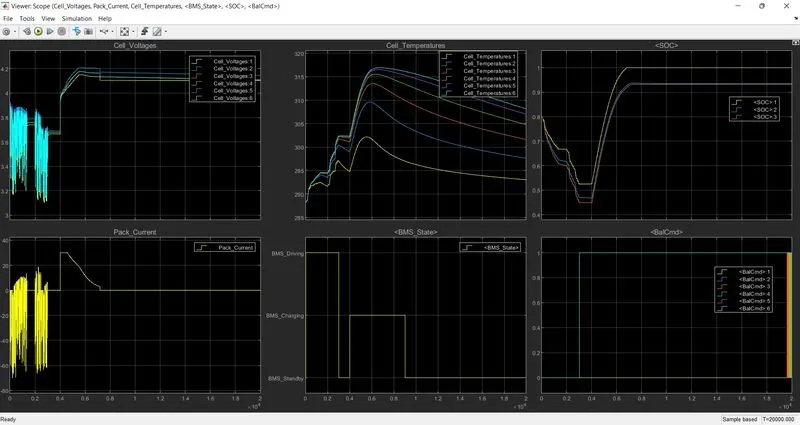
- The above plot consider the vehicle as the driving state so that the charging was filled upto 90%
- After charging is finished, the state approaches to below standby mode.
- It can be observed in the BMS status plot.
- The battery temperature increases during driving and charging so then it has increased the voltage upto 4.2V during charging.
- We have seen that the current plot shows the value indicates of current supplied during driving.
- SOC decreases as half during driving state condition and it is recovered during the increase of charging state.
- During the charging period the pack current is not constant instead first it remains constant and then decreases.
- During the constant current charging, the cell voltage increases
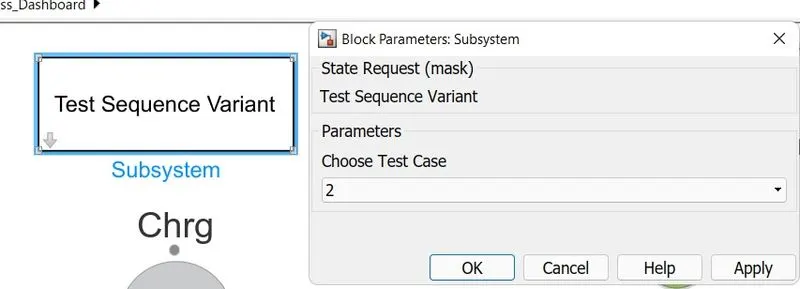
2. Now, changing the Test sequence variant to case 2 :
Now, by clicking at the BMS state request block:
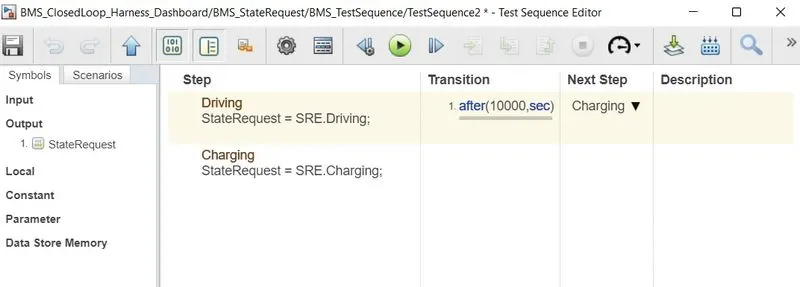
The Model is in driving state for 0 to 10000 secs. After that charging state occur.
Results :-
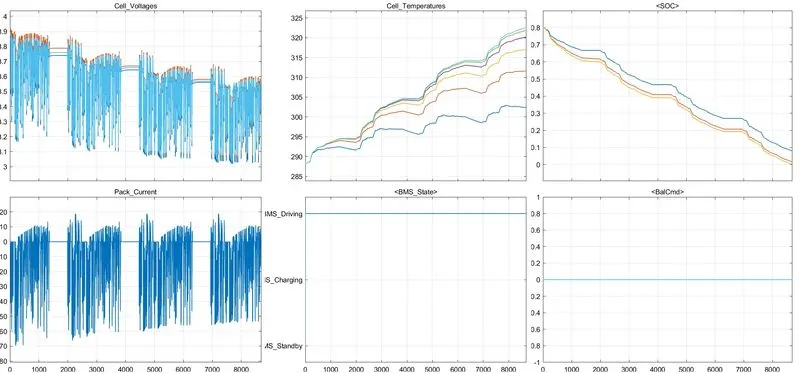
- From the above results, it can be concluded that the fault occurs during this Test.
- After the Driving state has been started, the battery SOC continously falls and there is no rise in the plot as in the previous case.
- The balancing command is zero as all the cells are balanced and no cell voltage exceeds the critical value.
3. Now, by changing the test sequence value to 3: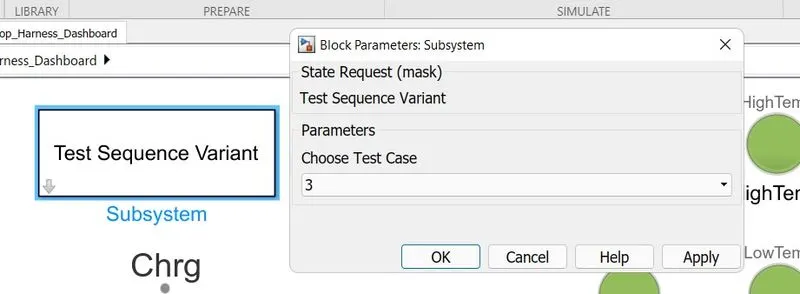

Here, the state is only charging for 20,000 secs.
Results :
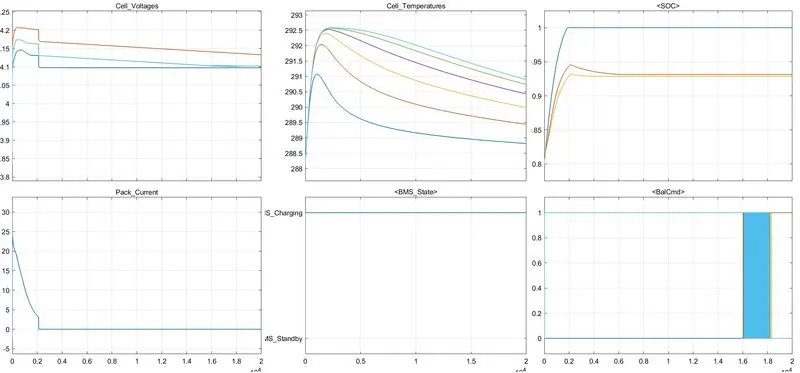
- As it can be seen from the BMS state plot that the model is in only charging state. SO, the SOC reaches to 100% and then remains at the steady state.
- When the standby state is reached the Cell Temperature also decreases.
- The pack current plot shows a sharp decrease in current value from 0 to 0.2 secs and after that the current becomes zero because the battery disconnect the cell from the circuit.
- The balance command is also set to 1 in this case as there may be an imbalance in the cell voltage.
Solution 2 : What is coulomb counting? Refer to the above model and explain how BMS implements coulomb counting for SOC estimation ?
Coulomb counting method is a convenient and straightforward approach for estimating the state-of-charge (SOC) of lithium-ion batteries. Without interrupting the power supply, the remaining capacities of them in an electric vehicle (EV) can be calculated by integrating the current leaving and entering the batteries.
Battery capacity varies with the working condition. For example, extra energy can be extracted from a battery depleted
at low temperature when it warms up; an exhausted battery discharged at high rates still has extractable capacity at low
rates.The present work assumes that a fully charged battery always holds a constant capacity regardless of the working condition, whereas the specific condition influences the action effect of the current. Accordingly, a concept of effective current is proposed, and the SoC variation is calculated as
`Delta SOC=((I.Cn)*Deltat)/(Ca)=Ieff*Deltat`
where I=Actual current; Ieff=corresponding effective current of I; (Delta)t=sampling interval; Ca=actual capacity; Cn=nominal capacity;
The coulomb counting method, also known as ampere hour counting and current integration, is the most common technique for calculating the SOC. This method employs battery current readings mathematically integrated over the usage period to calculate SOC values given by
`SOC=SOC(t(o))+(1/(Crated))*int(Ib-Iloss)*dt`
where SOC(t0) is the initial SOC, Crated is the rated capacity, Ib is the battery current, and Iloss is the current consumed by the loss reactions. The coulomb counting method then calculates the remaining capacity simply by accumulating the charge transferred in or out of the battery.The accuracy of this method resorts primarily to a precise measurement of the battery current and accurate estimation of the initial SOC. With a preknown capacity, which might be memorized or initially estimated by the operating conditions, the SOC of a battery can be calculated by integrating the charging and discharging currents over the operating periods. However, the releasable charge is always less than the stored charge in the charging and discharging cycle. In other words, there are losses during charging and discharging. These losses, in addition with the self discharging, cause accumulating errors. For more precise SOC estimation, these factors should be taken into account. In addition, the SOC should be recalibrated on a regular basis and the declination of the releasable capacity should be considered for more precise estimation.
Enhanced Coulomb Counting Algorithm :
In order to overcome the shortcomings of the coulomb counting method and to improve its estimation accuracy, an enhanced coulomb counting algorithm has been proposed for estimating the SOC and SOH parameters of Li-ion batteries. The initial SOC is obtained from the loaded voltages (charging and discharging) or the open circuit voltages. The losses are compensated by considering the charging and discharging efficiencies. With dynamic recalibration on the maximum releasable capacity of an
operating battery, the SOH of the battery is evaluated at the same time. This in turn leads to a more precise SOC estimation.
Technical Principle
The releasable capacity (Creleasable), of an operating battery is the released capacity when it is completely discharged. Accordingly, the SOC is defined as the percentage of the releasable capacity relative to the battery rated capacity (Crated), given by the manufacturer
`SOC=((Cused)/(Crated))*100`
A fully charged battery has the maximal releasable capacity (Cmax), which can be different from the rated capacity. In general, Cmax is to some extent different from Crated for a newly used battery and will decline with the used time. It can be used for evaluating the SOH of a battery.
`SOH=(Cmax)/(Crated)*100`
For example , we can look into the Project File downloaded. A BMS system in the File is shown below :
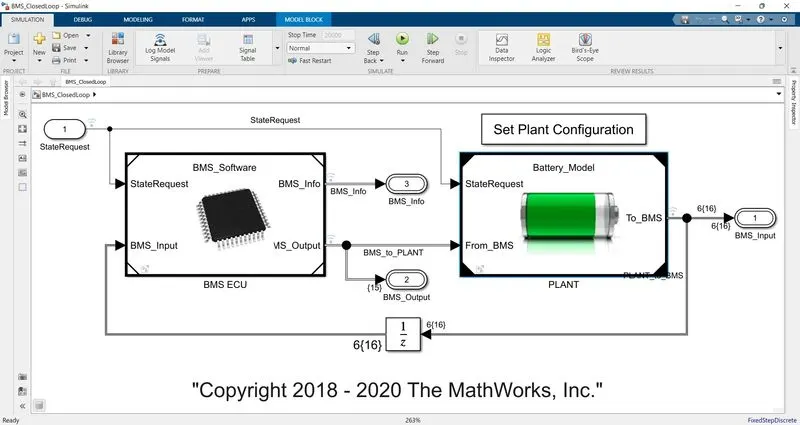
BMS algorithm models, protects, reports the measurement from battery pack
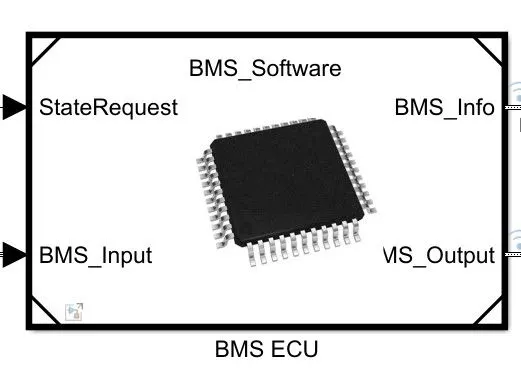
BY clicking at the BMS ECU we get the subsystem,
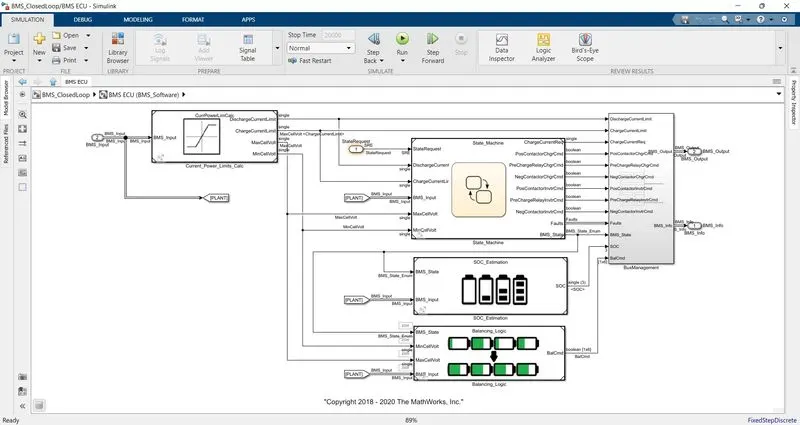
BY clicking on the SOC estimation block we get,
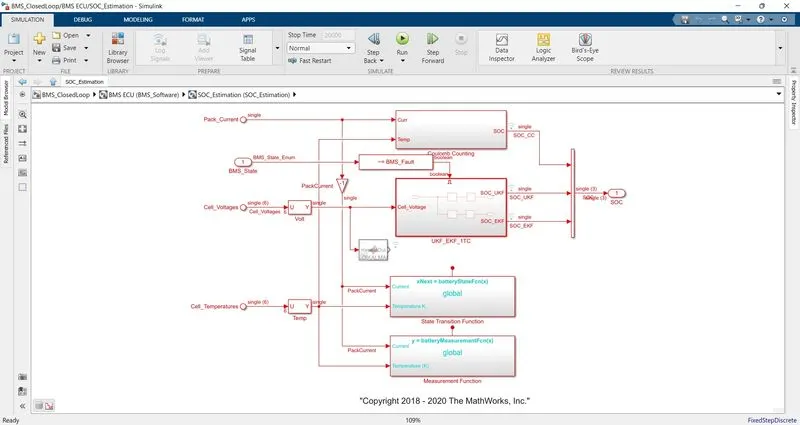
From the above subsytem, we observe the coulomb counting block
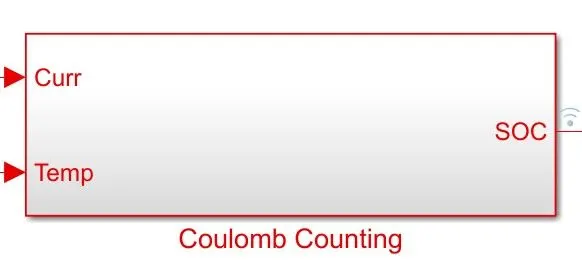
A Subsystem opens when we click on the coulomb counting
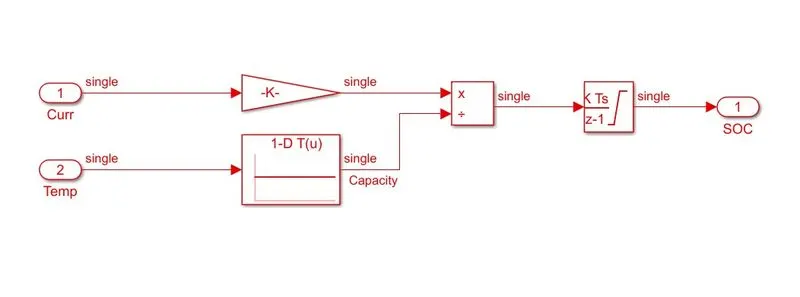
- This system does the estimation couiomb counting equation mentioned above.
- Advantage of coulomb counting method is its simplicity and low computational cost.
- Temperature and current from the battery is given as inputs.
- Current signal is given to a gain block while the temperature is given to Capacity since it varies with temperature.
- These inputs are given for integration where current is integrated with respect to time.
- This output is given to another block where it is divided by capacity.
- Hence the SOC is estimated.