Week-4 Challenge WOT Condition Part-2
Solution 1:- The difference between mapped and dynamic model is as follows:-
Mapped model of Engine,motor/generator:-
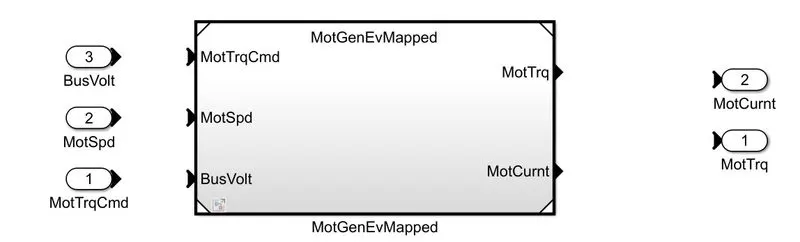
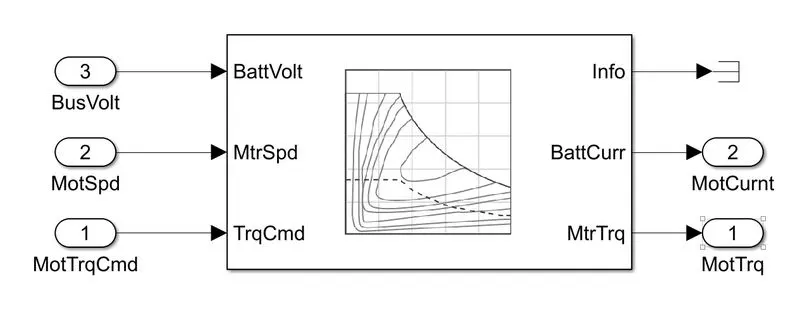
The following are the features of a mapped model-
- In this model, the data points are pre-assigned in lookup tables.
- The engine or motor torque required is sensed and motor or engine block provides the required torque as it is simply without considering the real time motor/engine parameters.
- The output values are stored for the corresponding input values for engine, motor or generator.
- The accuracy of the system is not that high but the simulation time for such model is very less as there are no real time parameters.
An example of the mapped model of 'motor/generator' model of pure electric vehicle is shown below.
Dynamic model of motor/generator or engine:-
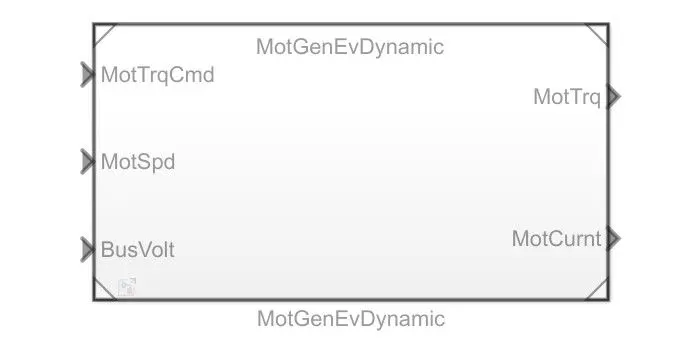
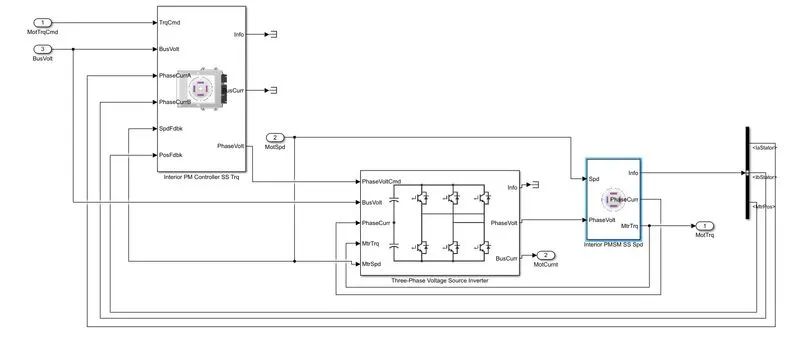
The figure above shows the dynamic model of a Motor/generator from a pure electric vehicle.The following points can be inferred from the above shown images:-
- The dynamic model uses the combination of outputs from various subsystems to generate the output.
- It runs by real time simulation where the required input from the drive cycle is taken and for that individual data real time simulation is performed. Continuing this way, the results of all the subsystems are summed to give the simulation output.
- The inputs which include the Bus voltage, currents, position etc. are taken as feedback according to the Drive cycle requirements so that actual real time simualation can be achieved.
- The accuracy of this system is very high as it uses real time outputs from all the subsystems to generate the output.
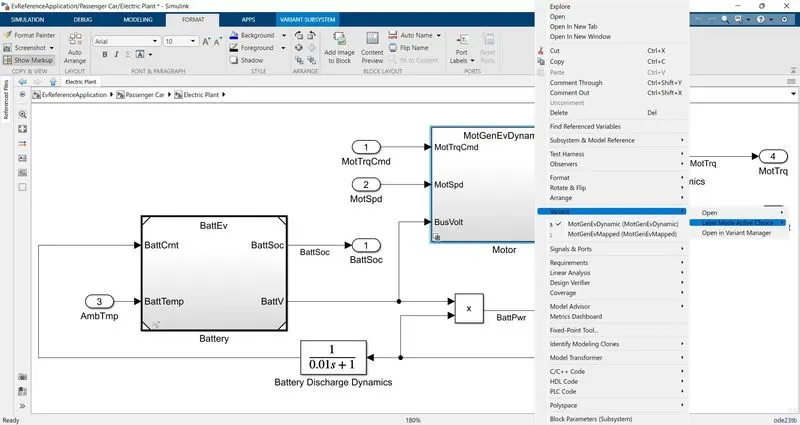
In order to change the model type from mapped to dynamic or vice-versa for the pure electric vehicle we can use the following steps:-
- Firstly select the pure Electric vehicle from the Powertrain blockset module.
- Now, the link to access the simulink model appears which open the corresponding model after the data matrices are stored in the MATLAB workspace.
- The simulink model comprises majorly the following blocks as shown below:-
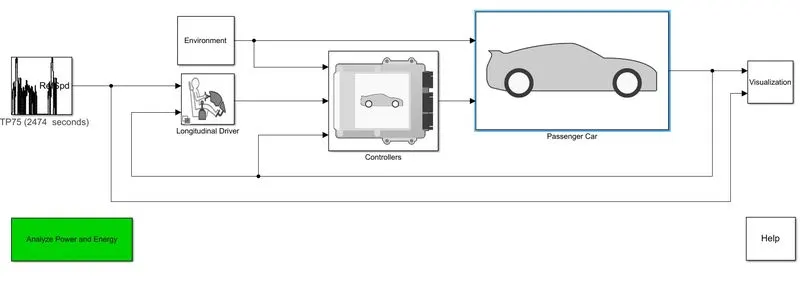
4. Next,we open follow the following steps OPEN-"Passenger Car-Electric train-Motor-Variant-Label mode Active choice-Choose Dynamic/Mapped" The above steps have also been in the image below:-
Solution 2:- Miles per gallon
- Miles per gallon is a fuel economy rating detemined by how far a car can go in a gallon of petrol or diesel for engine powered car.
- In the case of an electric vehicle it tells the amount of energy equivalent to an engine powered car to run a certain distance.
- The amount of fuel energy required by an engine powered car to travel the distance is calculated and then the compared with the equal amount of electrical energy required to move the car through the same distance and is measured in miles per gallon.
- The following model from powertrain blockset calculates the miles per gallon for all kinds of vehicle.
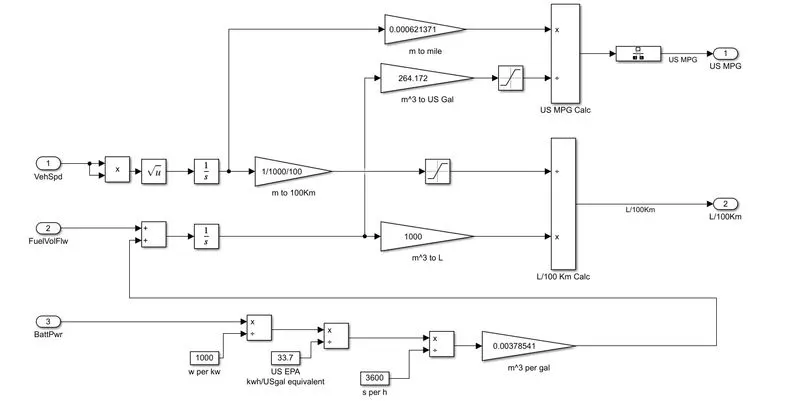
From the above diagram it can be seen that the inputs used in the calculation are- Vehicle speed, volume of fuel used and Battery power equivalent to Engine power.
Since, the above model is for a Hybid electric vehicle so we need to consider both the energy sources namely battery and engine.Further, the steps of conversion can be understood in the following steps:-
- Firstly the power supplied by the battery is converted into the equivalent energy which in turn is conveted to the volume of fuel equivalent by using the US volume to gallon conversion formula.
- Secondly, the fuel volume actually used in the engine and the fuel volume equivalent of the battery obtained from step 1 are added.
- Next the Total fuel volume equivalent obtained from Step2 is converted into US gallon by the relation 264.172US gallons=1000L.
- At last the US fuel economy unit of miles/gallon is obtained using the Step3 and Step4.
Solution 3:- The HEV reference application can be run in WOT DRIVE CYLE MODE by using the following procedure as shown below:-
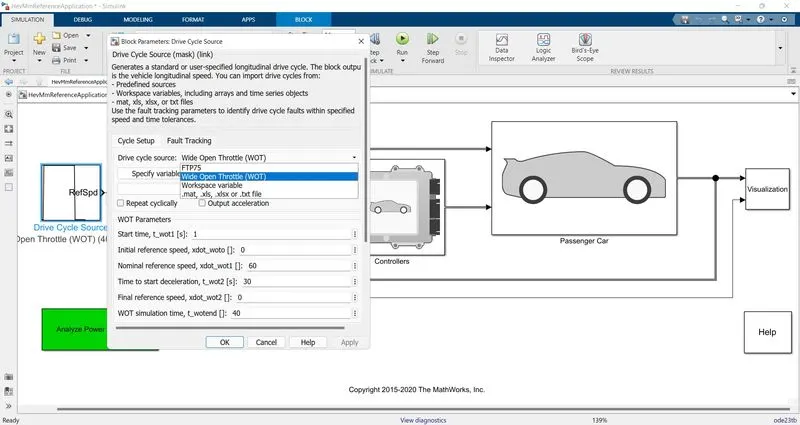
The output of the above Drive cycle keeping all other parameters same is shown below:-
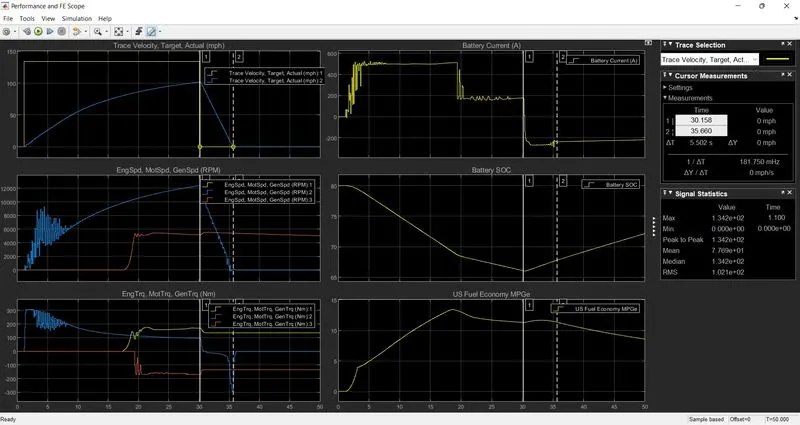
Following are the observations when the Drive Cycle is carried for 50 secs.
- Plot 1(Target velocity,target,Actual):- It can be seen that the desired velocity ranges to about 134 mph while the actual velocity reaches a maximum of 100 mph. Also, the time taken by the actual speed to reach its maximum is considerable and not sudden because of the limited battery capacity used.
- Plot 2(Engine Speed,Motor Speed & Gen Speed(RPM)):- It shows the clear variation of the Engine speed and Motor speed and their contribution in achieving the desired vehicle speed. Even after the vehicle speed becomes zero, the engine runs at speed of around 5700 rpm in which it supplies power to the battery and charges it by 4.36% in around 14 secs.
- Plot 3(Engine Torque,Motor Torque & Gen Torque(Nm)):- It shows the detailed analysis of the Engine, Motor and generator Torque.
- Plot 4 (Battery Current) A:- The plot clearly shows that the battery current is high (about 484A) during the acceleration period and decreases sharply to (about 174A) during the deccelerating period.
- Plot 5(SOC Battery)% :- It shows the SOC charge of the battery during WOT condition. Initially, the battery is charged to 80% and it discharges to around 66% during acceleration period and then it gets charged durong the decceleration period due to regenerative braking.
- Plot 6(US Fuel Economy MPGe) Miles/gallon:- It shows the US fuel economy as US MPGe.Clearly, the economy is high when the vehicle is battery driven and increases from 0 to 13.45 miles/gallon and decreases when the vehicle is engine driven.
Changing the grade & wind velocity:-
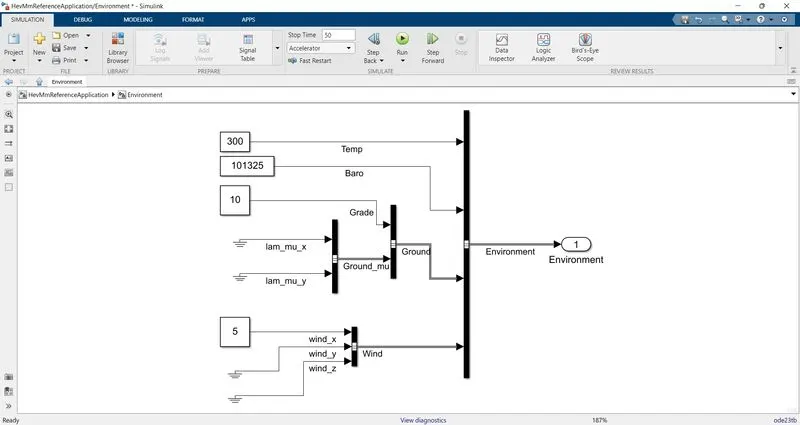
The grade and wind velocity are then changed to 10 degrees and 5 m/s respectively as follows:
Implementing the above modifications and keeping the rest of the parameters constant, we get the following results:-
Explanation:-
- The first plot of the velocity shows that the vehicle is unable to reach the reference speed due to wind resistance and grade available. Also in this case the vehicle speed reaches a maximum of 58.6 mph which is low as compared to the previous case where it achieved the speed of 100 mph.
- The battery SOC(state of charge) shows a deep deviation from the full charge value of 80% to around 66% in both the cases but the value is slightly more in the first case.
- The US Fuel economy is far better (around 13MPGe) in the first case as compared to (around 6MPGe) with the grade and wind velocity.
- The rest of the plot is same as the first case with a little change in the battery current during the cycle.
Solution 4:- Keeping all other parameters same, the simulated results of Hybrid and pure EV powertrain are as shown:-
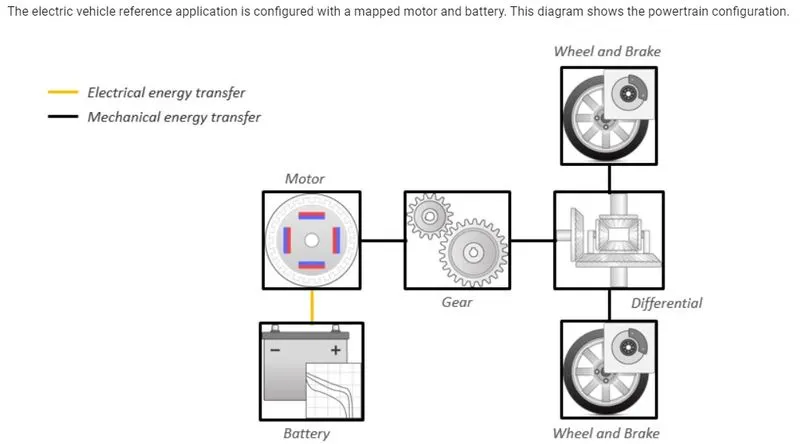
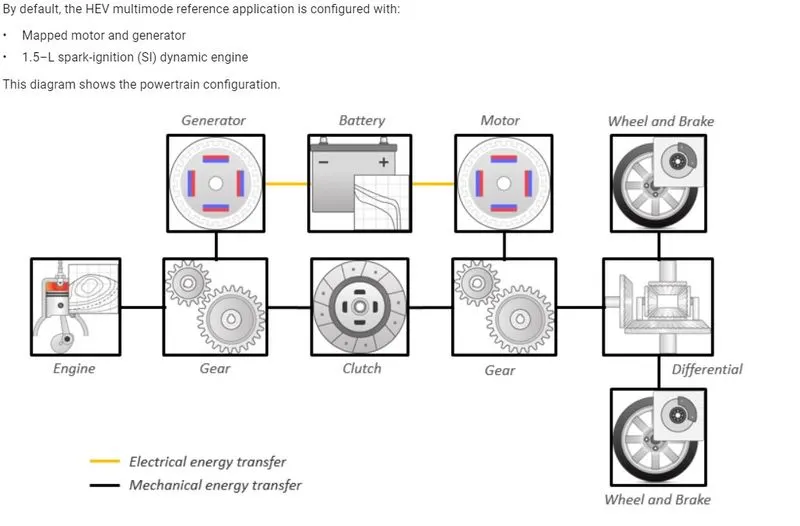
- Pure EV Powertrain:-The pure electric vehicle uses only a battery propulsion system to run the vehicle.The powertrain setup of a pure EV is shown below.
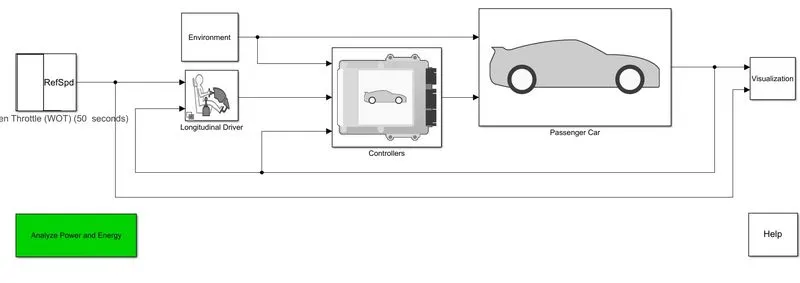
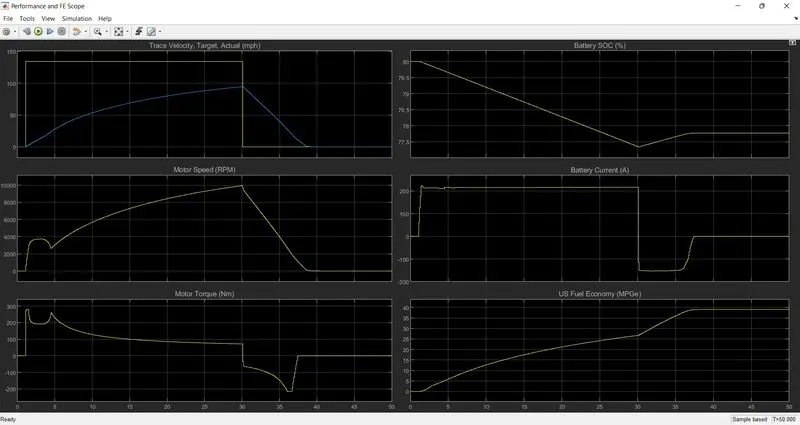
We run the PureEV model with WOT Drive cycle for 50 sec with grade and wind velocity as zero. The simulation results ae as shown below.
2. Hybrid electric Vehicle Powertrain:-
To compare the results of both the vehicle models namely-PureEv and Hybrid EV, we run the Hybrid model with the same conditions i.e,
- Simulation Time=50sec.
- Drive Cycle=WOT Cycle.
- Grade and wind velocity are set to zero.
The Powertrain blockset followed by the summation results for the hybrid vehicle are as shown below.
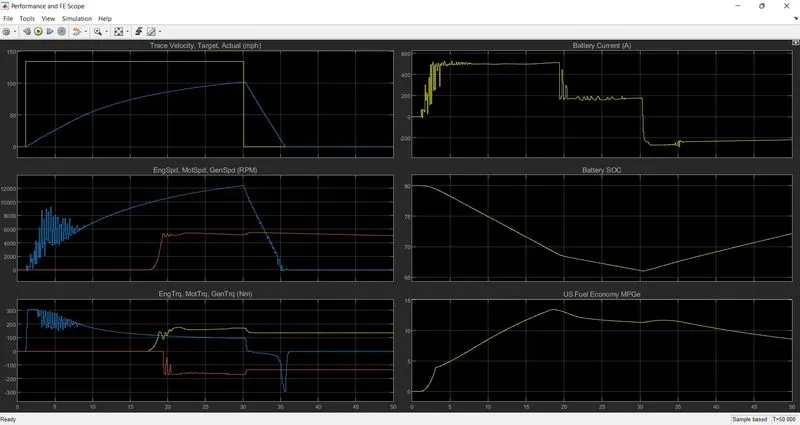
On comparing the above two results we get the following conclusions:-
- Although none of the vehicles are able to reach the reference speed of 134 mph but still the Hybrid vehicle attains the higher speed of 100 mph as compared to that of Pure EV reaching the speed of around 92.27 mph in the same time.
- The second plot of the rpm (motor) shows that the HEV model has a peak value of 5521 rpm as compared to PureEV which has the peak of 9925 rpm being driven only by the battery.
- The Torque plot shows that the motor in EV attains a slightly higher starting Torque (280Nm) as compared to HEV model (175 Nm).
- From the battery SOC plot it can be seen that in both the cases the battery is charged to 80% initially but the % of discharge is very less in Pure EV (ONLY 2.7%) as compared to HEV model where it is 14%.
- For the MPGe, the Pure EV shows a peak of 39 MPG as compared to HEV model where it is only 13.45 MPG.This shows that Pure EV is better in terms of mileage.
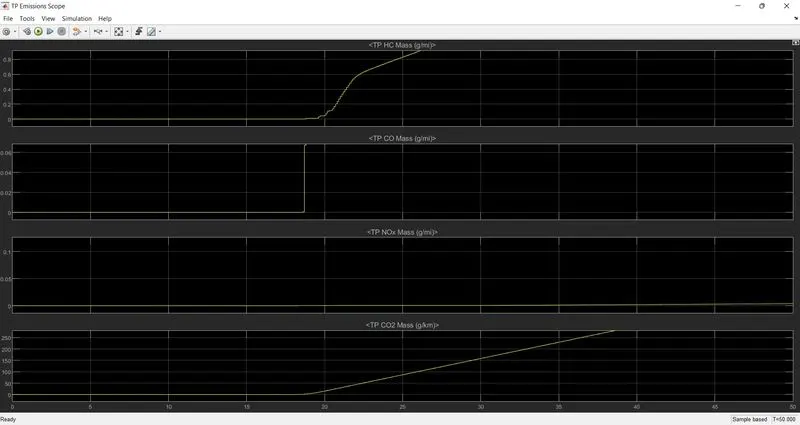
- Moreover, the HEV model has certain considerable amount of emissions as shown below which is not there in an EV model hence making it more environment friendly.
- From the battery current, it can be seen that, the HEV takes somewhat more motor current (around 450A)during the acceleration period of 20 sec and aftee that as the speed becomes constant the current is being suppied by the engine alone upto a lower value of 200 A. On the other hand, in the case of Pure EV the battery solely provides the motor current for the entire drive cycle which is a constant of around 200 A.