Week-3 Challenge: ADVISOR Tool
Solution1:- Selecting the ADVISOR vehicle input as ''EV_defaults_in file" and changing the cargo mass as 500kg, we ge the following interface
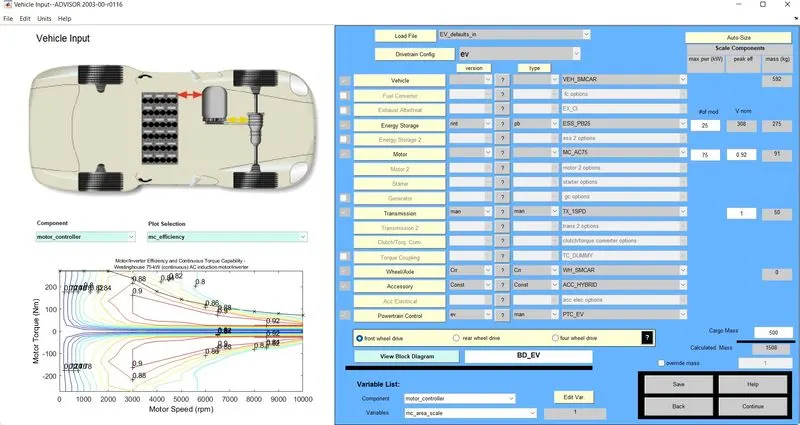
Further, we click on the 'Continue' and then adjust the DUTY CYCLE as 'CYCLE_FTP' which displays the following plot
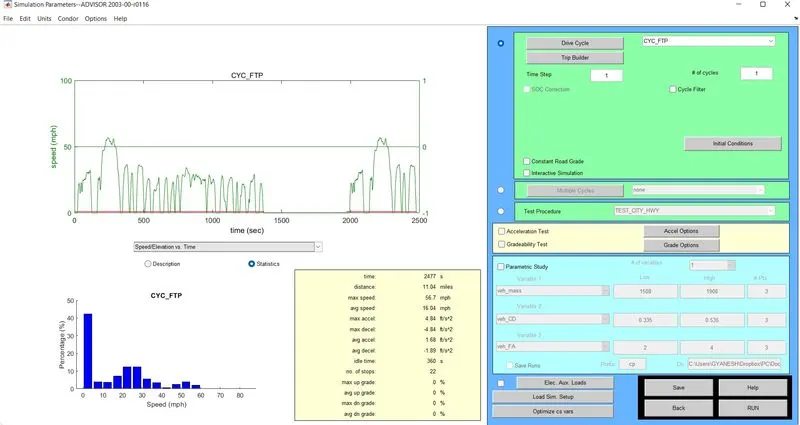
Keeping all other parameters as default we RUN the model and the results are as shown below:-
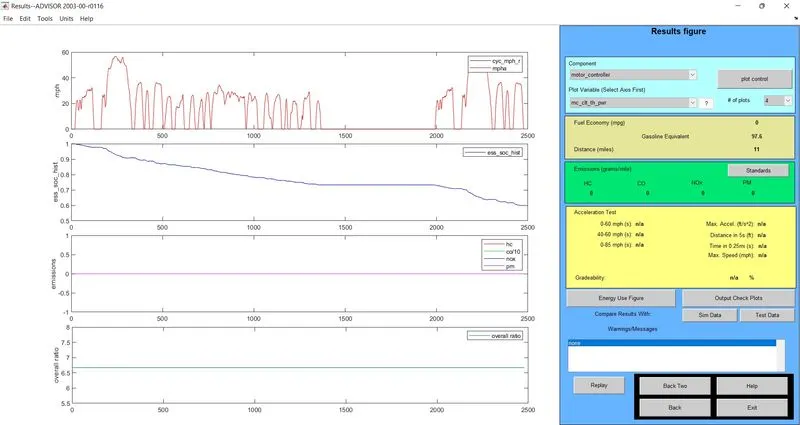
From the above results it can be seen that the distance covered by the vehicle is 11.06 miles or 17.8Km. Also,the State of Charge(SOC) is reduced to 60% at the end of 2500sec.To check whether the vehicle can cover the distance of 45 km in a single recharge, we increase the duty cycle to 2.5. After the alteration,we get the results as displayed below:-
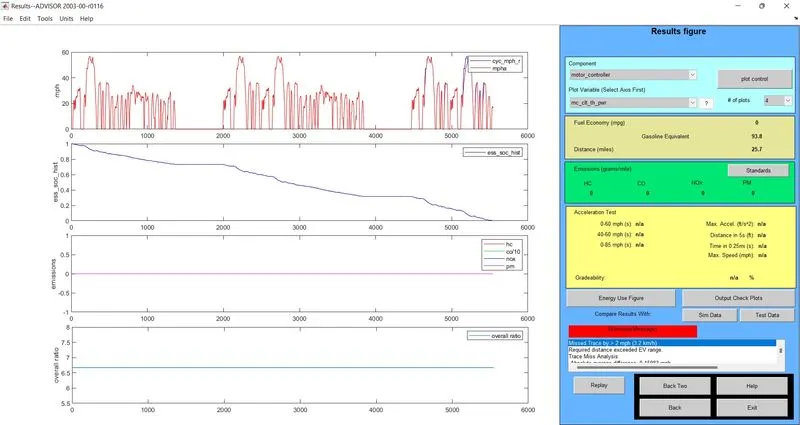
From the above results it can be seen that the vehicle covers distance of 25.7 miles or 41.36km in a single recharge.Also the SOC(state of charge) of bettery becomes zero at around 5500 sec.So, it can't cover 45km.
Since, the vehicle is purely electric, so emissions are zero throughout the Duty cycle in both the cases.
Solution 2:- In this case we change the battery to 'ESS_PB65_FocusEV' and run the simulation with the same number of Drive Cycle as visible in the images below:-
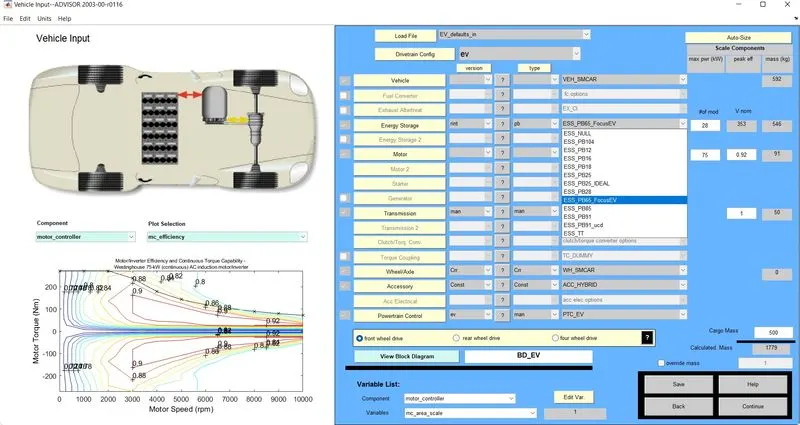
The results obtained in this case are shown below:-
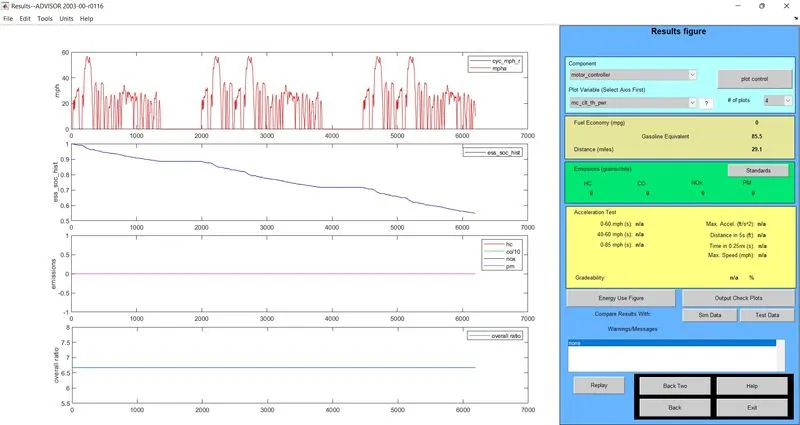
From the above results it is visible that the vehicle covers distance 29.1 miles or 46.83 Km in the same drive cycle number of 2.5 and also the SOC (state of charge) of thr new battery falls only upto 55% at the end of journey.
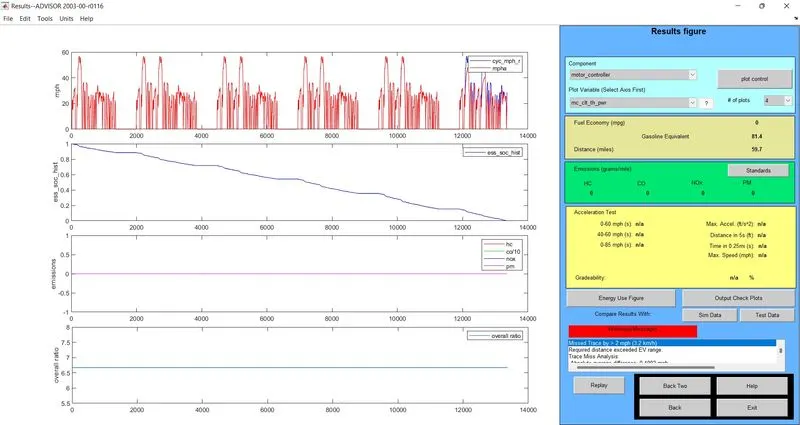
Also, to check the total distance covered by the vehicle in a single recharge with the new battery, we increase the Drive Cycle to 4 and we observe that it covers a total of 59.7 miles or 96Km till the battery is completely discharged at 13000sec as shown below:-
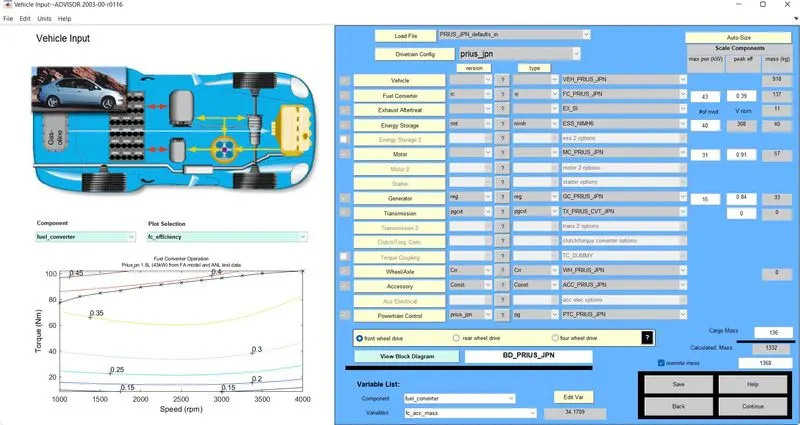
Soution 3:- Here first we change the vehicle input to 'PRIUS_Japan_defaults_in' and the window showing Torque v/s speed plot and basic features is shown below:-
For gradeability test, we check the 'Gradeability test' option from the Advisor window.
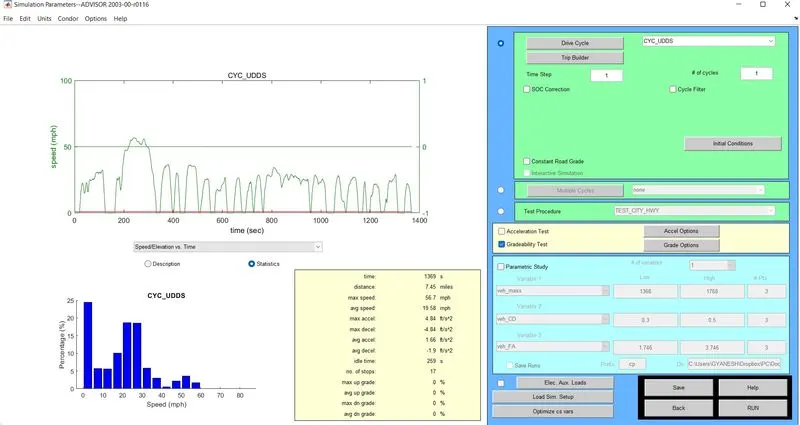
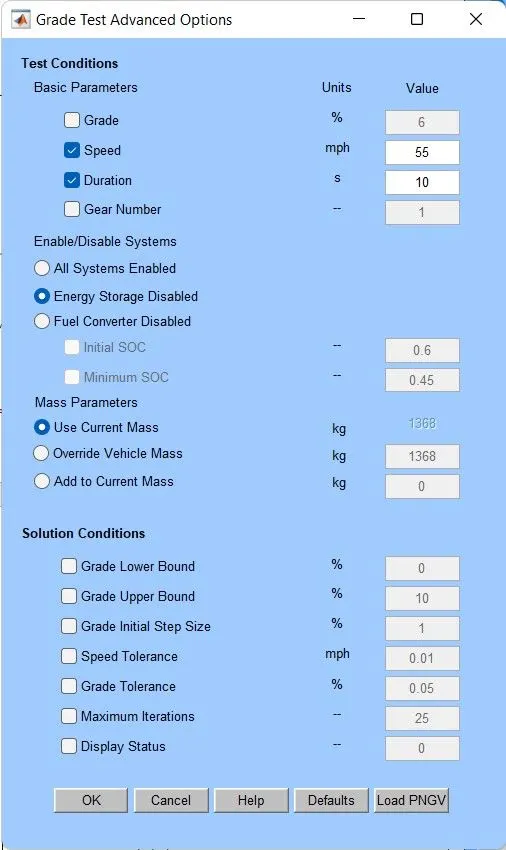
As shown above, firstly we take the speed as 55miles/hr and check the gradeability which comes out to be 1.7%
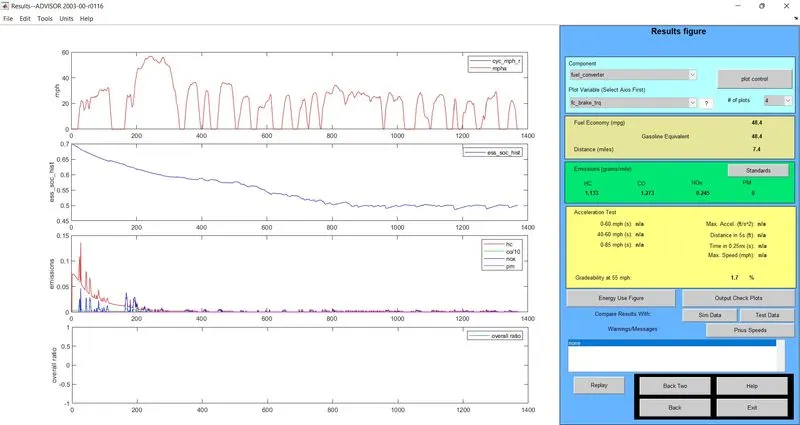
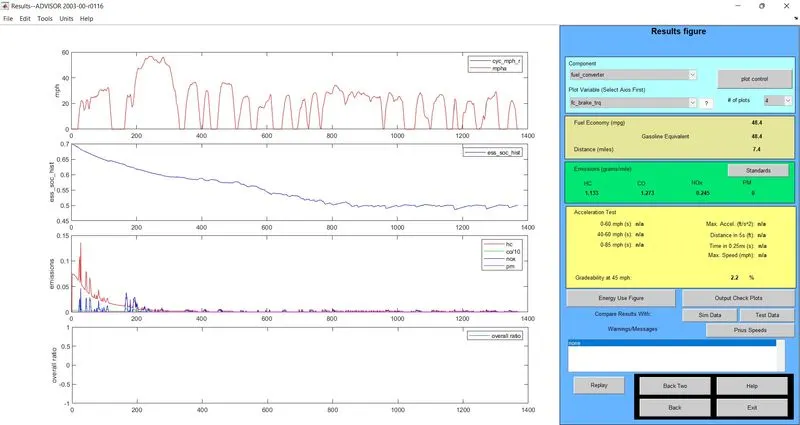
In the second case we change the speed to 45miles/hr and the gradeability comes out to be 2.2% as shown below:-
Further if we change the speed to 35miles/hr we get the gradeability as 2.4% as shown below:-
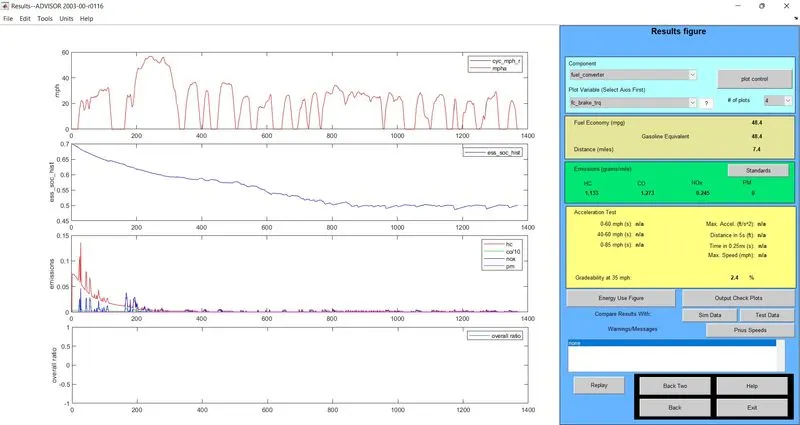
So, we can conclude by saying that as the speed decreases, the gradeability increases. The variation in the above three cases has been shown in the table below:-
| Parameters | Vehicle 1 | Vehicle 2 | Vehicle 3 |
| Speed (miles/hr) | 55 | 45 | 35 |
| Gradeability(%) | 1.7 | 2.2 | 2.4 |