Week 7 State of charge estimation
Aim:
1.Simulate the 3 test cases from harness dashboard and write a detailed report on the results
2.What is coulomb counting? Refer to the above model and explain how BMS implements coulomb counting for SOC estimation ?
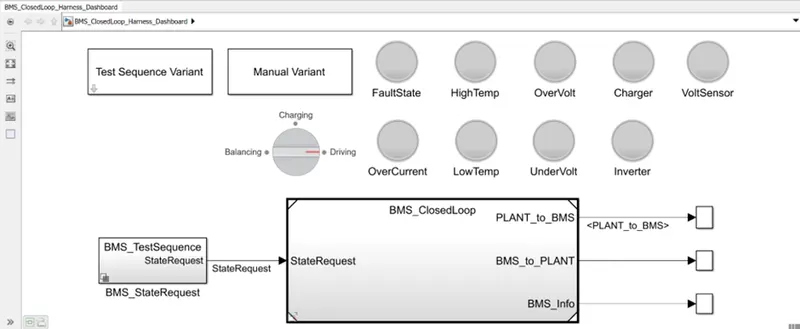
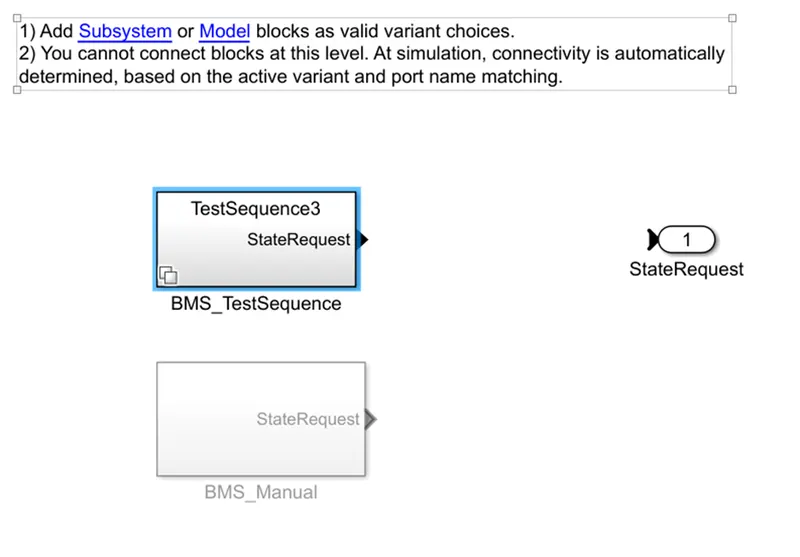
Click on Test sequence Variant:
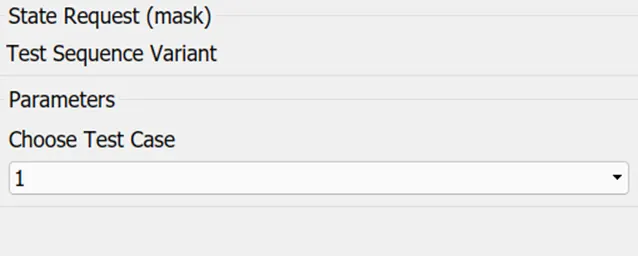
And set it to 1:
Click on BMS_State request:
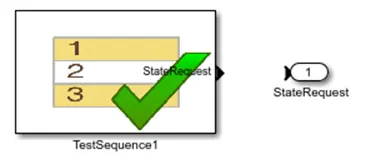
We get chart:
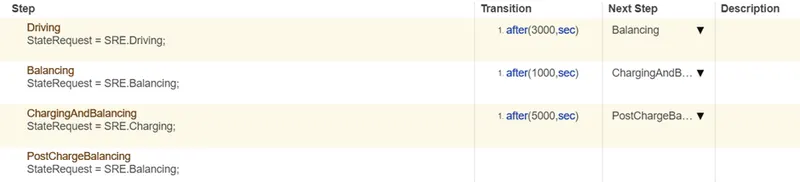
From the above fig we observe that,
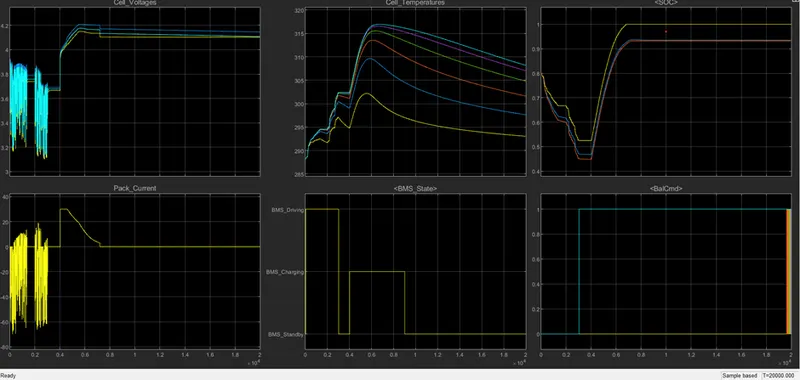
Drive is for 3000 seconds
Then followed by balancing for 1000 seconds
Followed by charging and balancing for 4000 seconds,
Then there is post charge balancing.
- The first plot shows the individual cell voltage between 3.2 and 3.7 volts between 0 to 3000
- The nominal voltage of each cell is 3.7 volts and it decreases to 3.2 volts.
- Fluctuating in cell voltage form 0 to 3000 seconds show that the vehicle is in driving mode.
- Form 3000to 4000 sec, we have balancing mode.
- Thus cell voltage gets balanced to 4 volts till 4000 seconds.
- From 4000 to 8000 seconds, there is charging and balancing state.
- Thus cell voltage rises to 4.3 volts.
Case II:
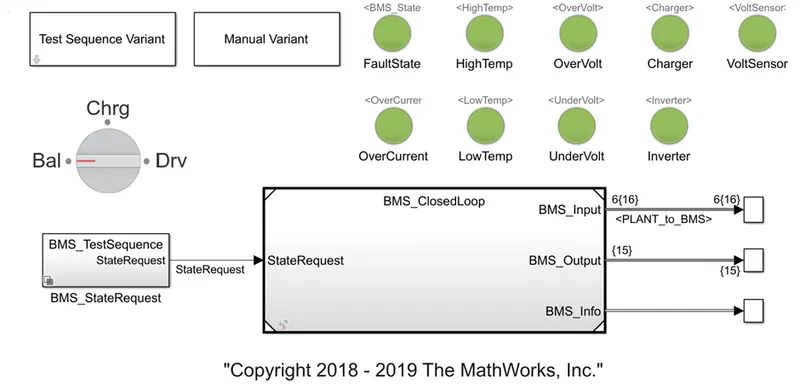
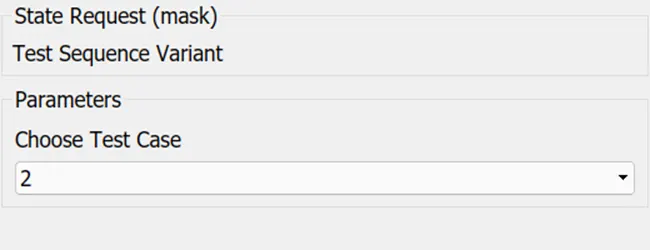
Set state request to : 2
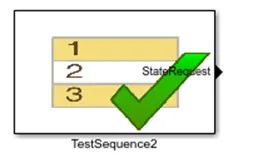
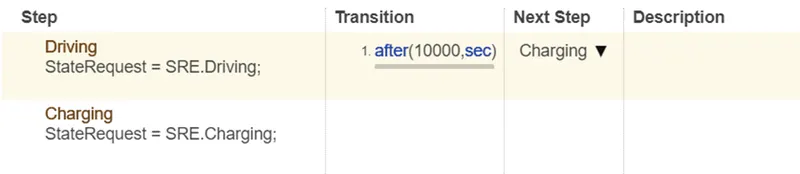
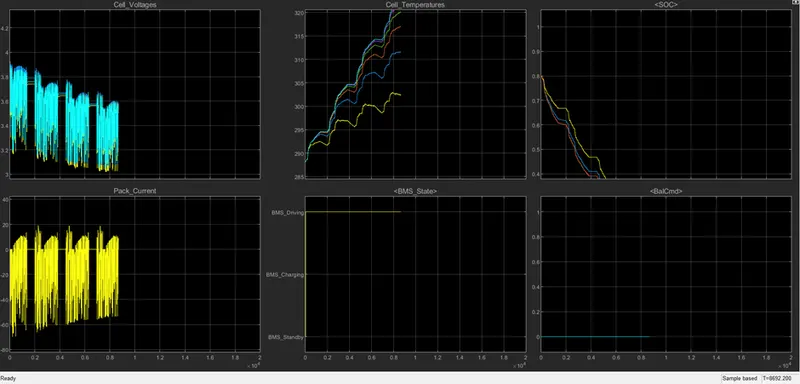
- The cell voltage fluctuates form 3.9 to 3.2 volts repeatedly as seen in graph of cell voltages.
- The battery pack current fluctuates form 0 to -60A and then rises to 10A repetedly as shown.
- The cell temperature increases as there is driving stage from 0 to 10000 seconds.
- As driving stage is there from 0 to 10000 sec, thus BMS graph shows the BMS driving.
- The SOC continue to reduce form 80% to 0% the SOC do not increase because there is no chargin and balancing stage.
Case III:
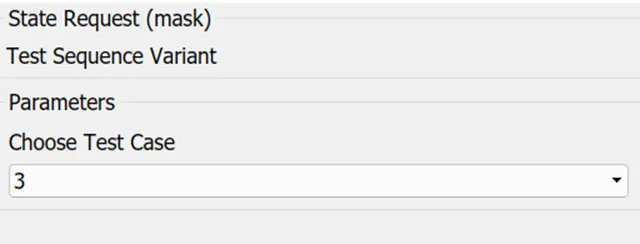
Set the state Request to 3:

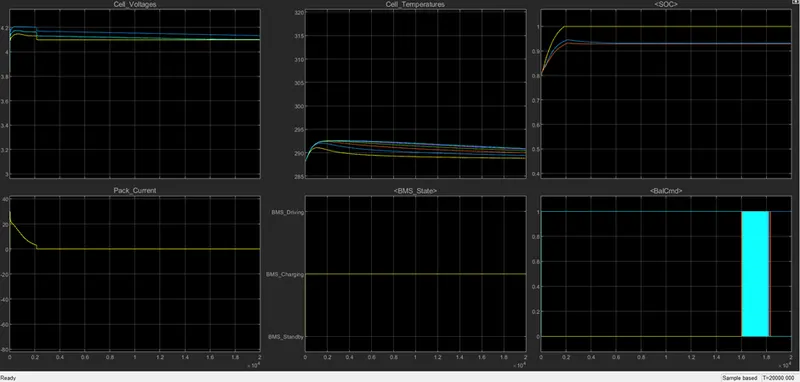
- The cell voltage varies till 20000 sec and then remains constant
- At start the pack current increases to 30A and then reduce to 0A at 2000 seconds and the remains constant at 0A.
- Cell temperature varies as shown in the graph.
- As there is only charging stage, thus BMS graph shows BMS charging.
- As only charging takes place.
- Thus SOC was 80% at first, then Soc increases to 100% in 2000sec then SOC remains constant at 100%.
2) What is coulomb counting? Refer to the above model and explain how BMS implements coulomb counting for SOC estimation ?
Coulomb-counting is based on exploiting the Eq. (1) by quantifying the charge delivered by the battery through sensing its input and output current [7,37]. Yet, there are some inefficiencies when using this method. First of all, the access to the initial SOC is not guaranteed. Secondly, selfdischarge may distort the real SOC value after a long storage period and finally the reference capacity Qrated must be updated in terms of battery ageing. Furthermore an SOC estimation is performed at varying ambient temperature which should be taken into account. The literature shows enhanced Coulomb-counting algorithms which allow the determination of the initial SOC using the SOC-OCV curve, takes into account self-discharge losses and performs a recalibration at fully and empty stages. Figure 2 gives the flowchart of the propopsed algorithm used to manage the battery monitoring by switching from a battery operating mode to another in accordance with transition conditions. The estimation of the SOC of a Li-ion battery by the developed method is based on monitoring the voltage Vbat the current bat I and the temperature T°. The operation mode of the battery is recognized by the direction of the current through the battery system. When the battery is in an open circuit mode, 0 bat I = , a compensation of self-discharge losses will be considered as will be explained in the subsection 3.4. The information needed to perform the monitoring are the measurement of the battery voltage and the current flowing through it. Coulomb counter is used to track the SOC when battery is charging, discharging and selfdischarging. The amount of charges in an operating period is obtained by a temporal integration of a measured charging/discharging current bat I a
Coulomb Counting Method:
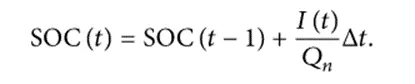
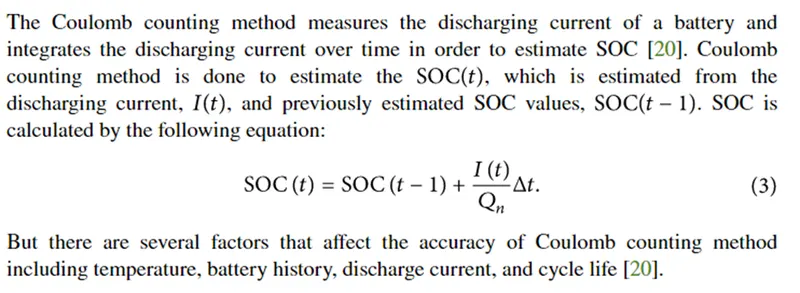
The Coulomb counting method measures the discharging current of a battery and integrates the discharging current over time in order to estimate SOC [20]. Coulomb counting method is done to estimate the , which is estimated from the discharging current, , and previously estimated SOC values, . SOC is calculated by the following equation:
But there are several factors that affect the accuracy of Coulomb counting method including temperature, battery history, discharge current, and cycle life
Modified Coulomb Counting Method:

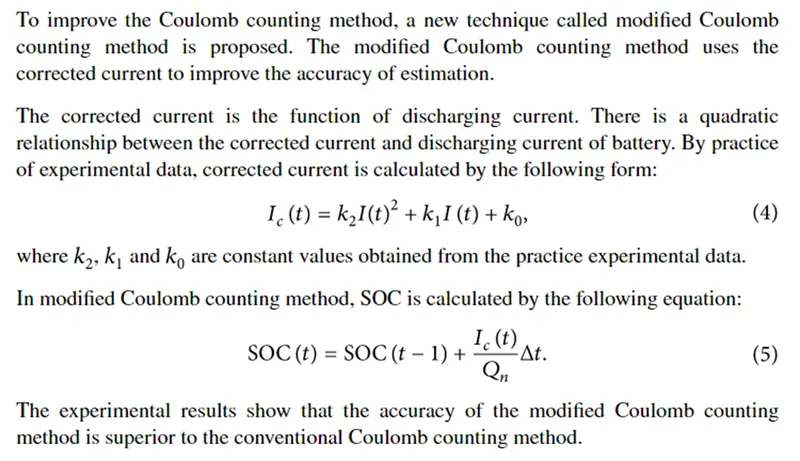
To improve the Coulomb counting method, a new technique called modified Coulomb counting method is proposed. The modified Coulomb counting method uses the corrected current to improve the accuracy of estimation.
The corrected current is the function of discharging current. There is a quadratic relationship between the corrected current and discharging current of battery. By practice of experimental data, corrected current is calculated by the following form:
where , and are constant values obtained from the practice experimental data.
In modified Coulomb counting method, SOC is calculated by the following equation:

2) To Compute SOC of a battery insert a plant block into the model.
BMS algorithm Model:
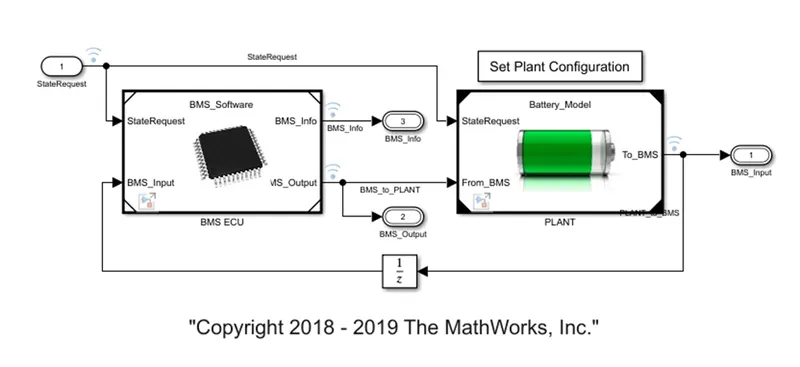
When we click on BMS ECU:
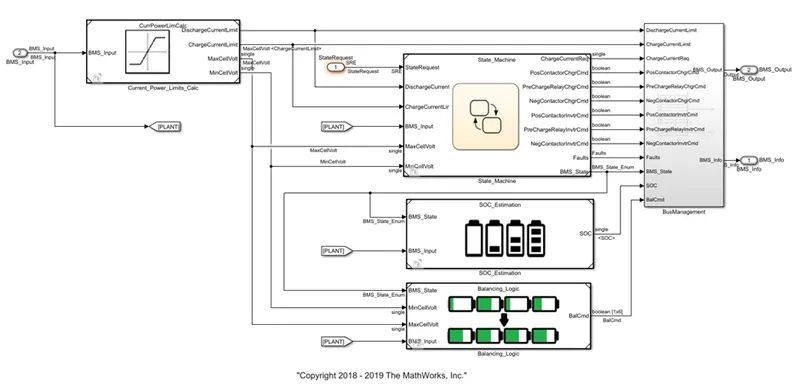
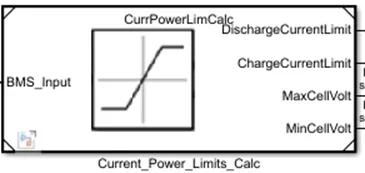
By clicking current power limited calc we get the below diagram:
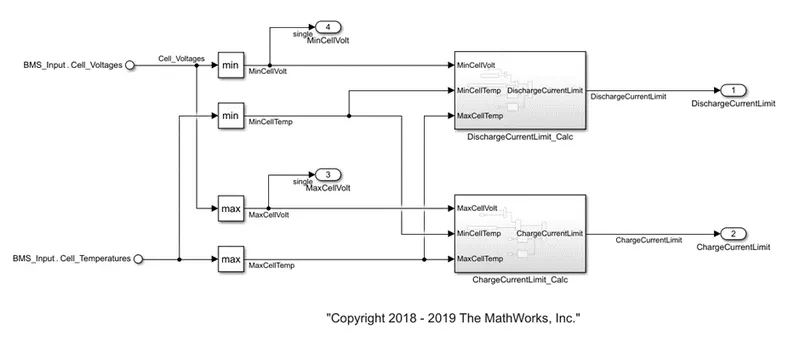
Here the cell voltage and cell temeperature is used to decide maximum allowable charging and discharging current limits.
When cell is at lowest SOC, its voltage is low, and thus it is important to prevent cell from delivering large amount of potential below the cut off voltage specify by the cell manufacture.
By clicking the discharge current limit calc:
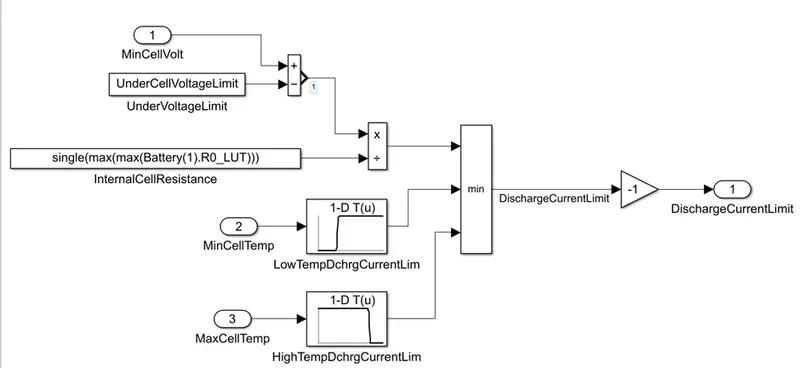
Here by comparing the minimum cell voltage in the module against this lowest threshold voltage and the divide by maximum internal cell resistance value,
We can compute the voltage based threshold.
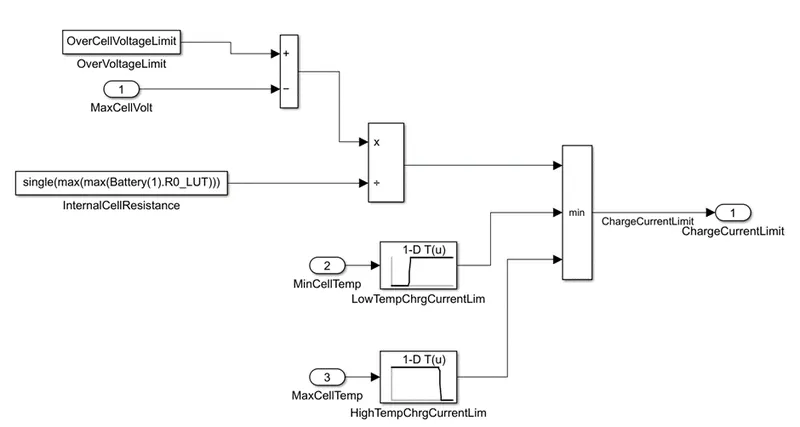
It is also important to limit the current delivery and current intake when temperature is too high to too low. Using the lockup table with rising and falling s shape profile, we can specify current threshold based temperature and thus can modulate allowable current delivery.
It is recommended to avoid low and high temperature during discharging and low temperature during charging.
Now clicking on SOC estimation but coulomb counting is mostly used.
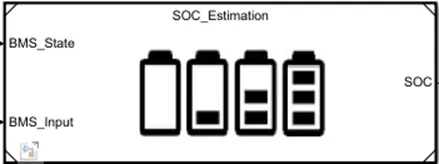
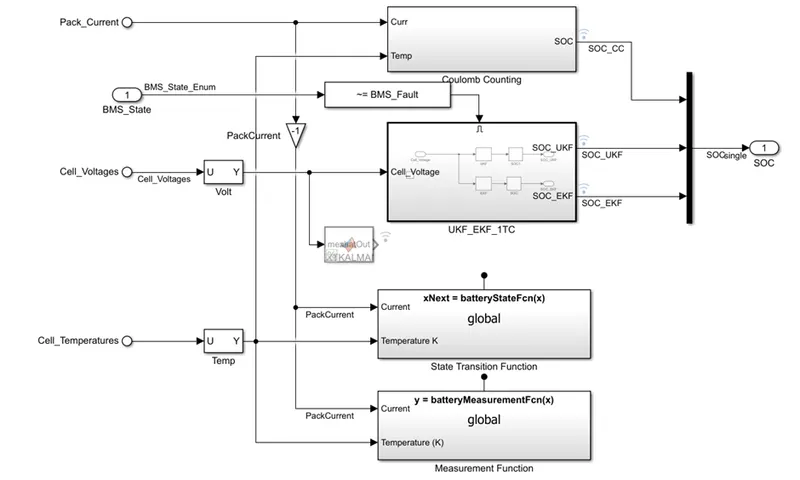
Click on the estimation block:
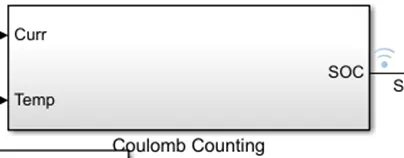
By clicking on coulomb counting block, we get the below block diagram
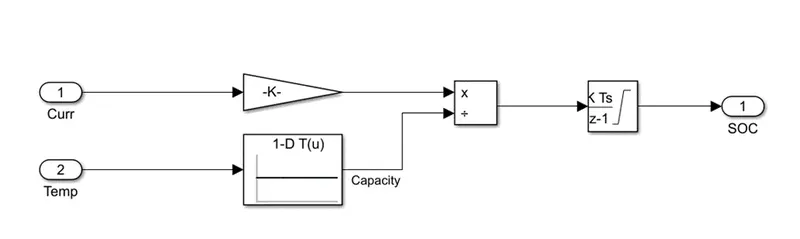
In this coulomb conting method, the entering and leaving currents of the cell are integrated to track the safe chargable time.
Here the wo input signals current and temperature are taken the current signal goes to gain block and the gtemperature signal goes to current look up table.
Then as seen , signals are multiplied an divided as shown as then output is given to discrete time integrator to track the safe chargable time and then SoC is estimated.
Advantage of coulomb counting method is its simplicity and low computational cost.
The drawback of coulomb counting method is accumulation of current sensor error and inability to recover form wrong initial condition because of lack of feedback from voltage measurement.
Reference:
//////////////////////////////////////////////////////////////////////////////////////////////////////////
There is a mistake due to multi tabs opened in my PC. I submitted week 8 assignment in week 12 project work. And I regret it, Thanks for allowing me to submit my project again, and this will never happen again.
WEEK-12
Aim:
For a 10 cell series lithium ion battery model, simulate the thermal effects and compare life cycle performance at various temperatures, charge & discharge rates using MATLAB.
Objective:
For a 10 cell series lithium ion battery model, simulate the thermal effects and compare life cycle performance at various temperatures, charge & discharge rates using MATLAB.
Theory:
Lithium-ion batteries are currently used in most electric vehicles because of their high energy per unit mass relative to other electrical energy storage systems. They also have a high power-to-weight ratio, high energy efficiency, good high-temperature performance, and low self-discharge.
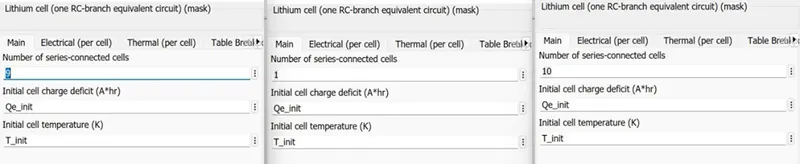
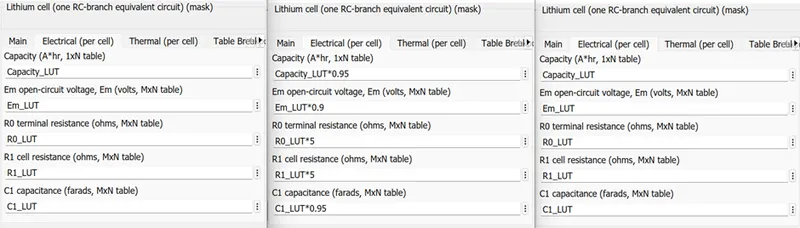
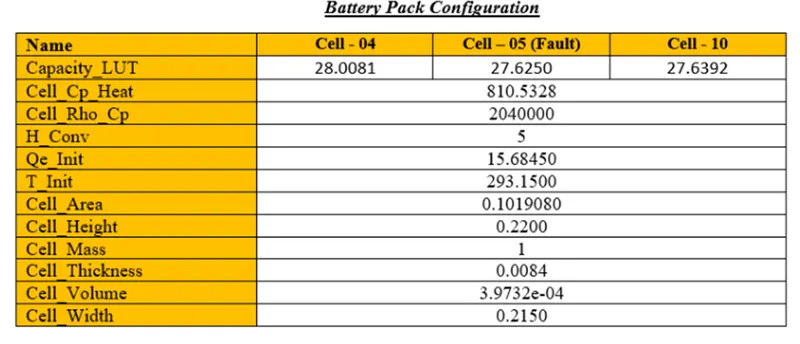
This example shows how to simulate a battery pack consisting of multiple series-connected cells in an efficient manner. It also shows how a fault can be introduced into one of the cells to see the impact on battery performance and cell temperatures. For efficiency, identical series-connected cells are not just simply modeled by connecting cell models in series. Instead a single cell is used, and the terminal voltage scaled up by the number of cells. The fault is represented by changing the parameters for the Cell 10 Fault subsystem, reducing both capacity and open-circuit voltage, and increasing the resistance values.
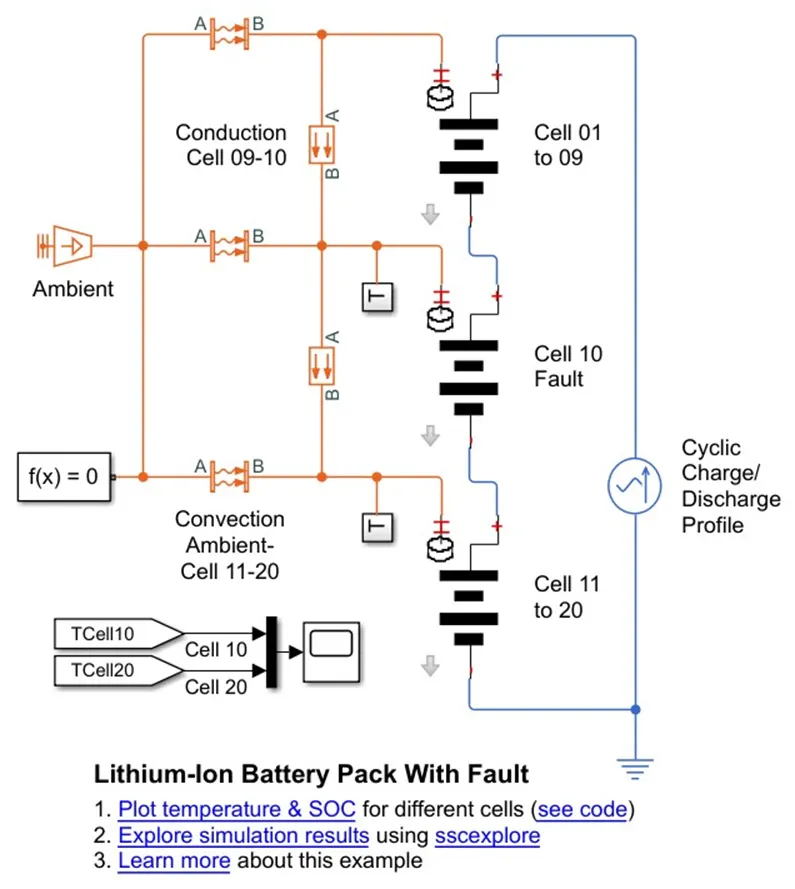
A simple thermal model is used to model battery temperature. It is assumed that cooling is primarily via convection, and that heating is primarily from internal resistance. A battery pack can be modeled by connecting multiple copies of the battery cell block in series.
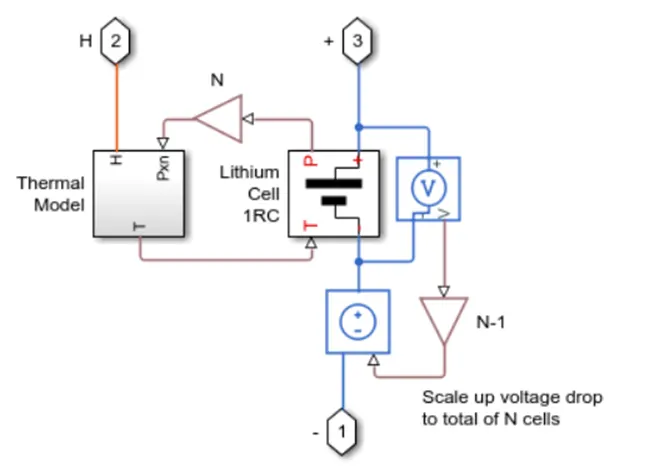
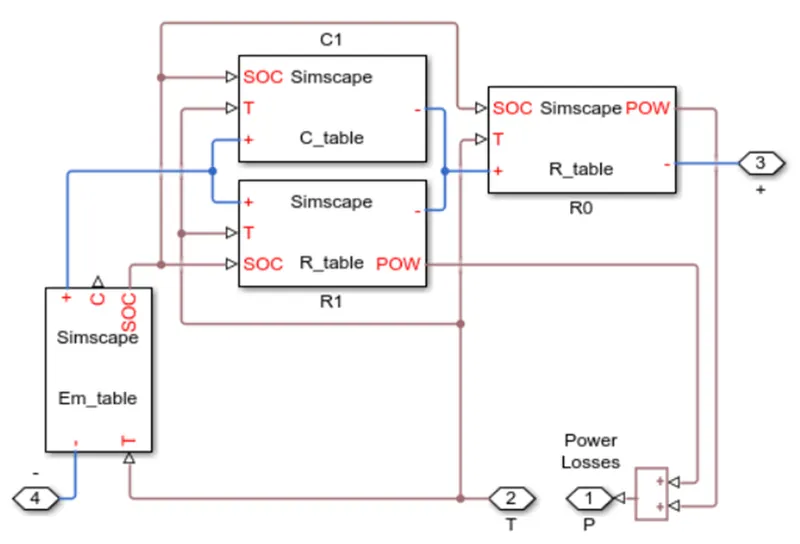
Cell subsystem basically consist of a Thermal Model and Lithium Cell 1RC block which calculate the temperature and thermal effect for cells and overall calculate for the battery pack.
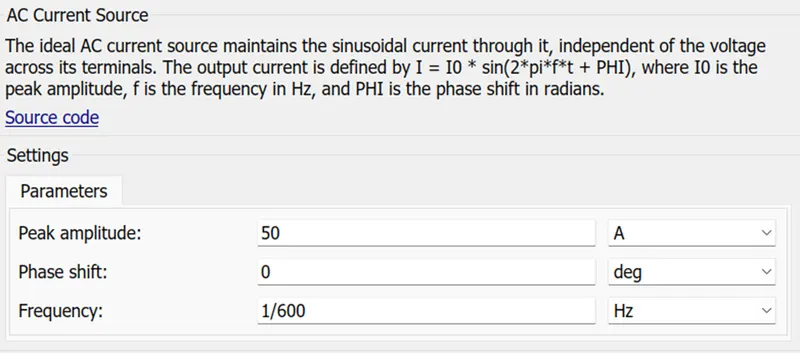
The block are inside the cell subsystem are PS Gain block which multiplies the input physical signal by a constant i.e y=u.* gain . Another block are voltage sensor an current voltafe sensor and current source.
The voltage sensor block represents an ideal voltage sensor, that is , a device that coverts voltage measured between any electrical connection into a physical signal proportional to the voltage,
Current voltage source represents an ideal voltage source that is powerful enough to maintain the specified voltage at it’s output regardless of the current passing through it. The output voltage is V = Vs where Vs is the numerical value presented at the physical signal port.
Cell 01 to 04 subsystem:
Lithium cell 1RC subsystem:
Temperature sensor block:
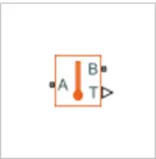
The Temperature Sensor block represents an ideal temperature sensor, that is, a device that determines the temperature differential measured between two points without drawing any heat.
Connections A and B are thermal conserving ports that connect to the two points where temperature is being monitored. Port T is a physical signal port that outputs the temperature differential value.
The block positive direction is from port A to port B. The measured temperature is determined as T = TA – TB.
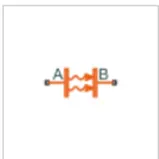
The Convective Heat Transfer block represents a heat transfer by convection between two bodies by means of fluid motion. The transfer is governed by the Newton law of cooling:
Q=k⋅A⋅(TA−TB),
where:
- Qis heat flow.
- kis convection heat transfer coefficient.
- Ais surface area.
- Dis distance between layers (that is, thickness of material).
- TAand TB are temperatures of the two bodies.
Connections A and B are thermal conserving ports associated with the points between which the heat transfer by convection takes place. The block positive direction is from port A to port B. This means that the heat flow is positive if it flows from A to B.
- Direct measurement: this method uses physical battery properties, such as the voltage and impedance of the battery.
- Book-keeping estimation: this method uses discharging current as the input and integrates the discharging current over time to calculate the SOC.
- Adaptive systems: the adaptive systems are self-designing and can automatically adjust the SOC for different discharging conditions. Various new adaptive systems for SOC estimation have been developed.
- Hybrid methods: the hybrid models benefit from the advantages of each SOC estimation method and allow a globally optimal estimation performance. The literature shows that the hybrid methods generally produce good estimation of SOC, compared to individual methods.
Coulomb Counting Method:
Modified Coulomb Counting Method:
Battery configuration:
Case I :
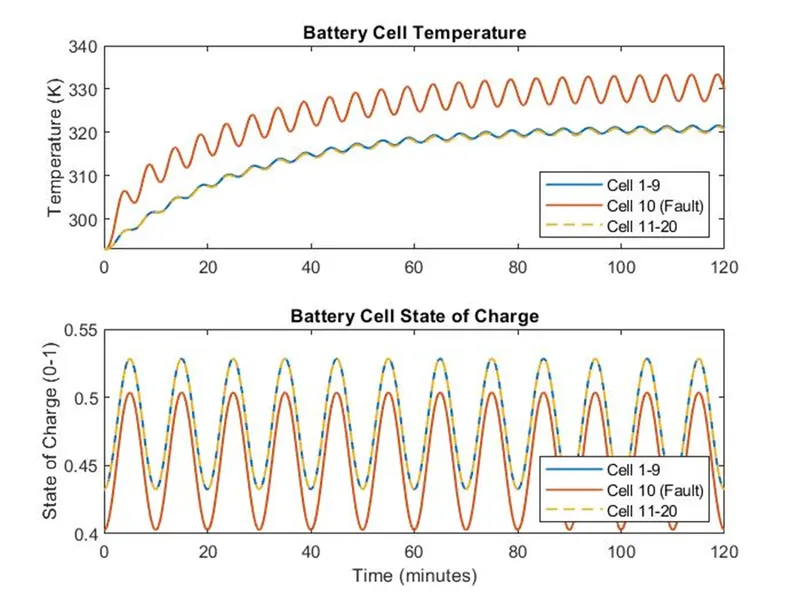
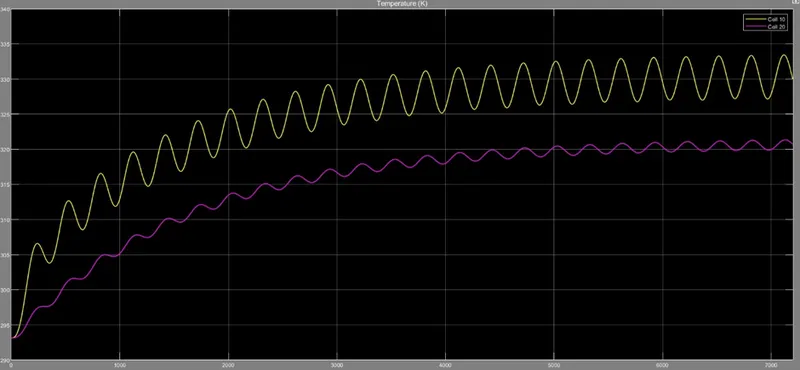
Normal running the simulation:
Case II:
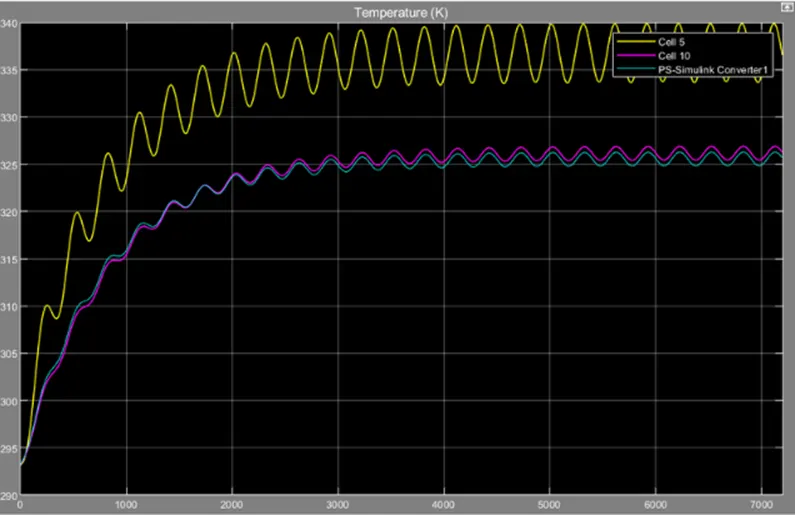
310K ie 35.85degrees
Case III:
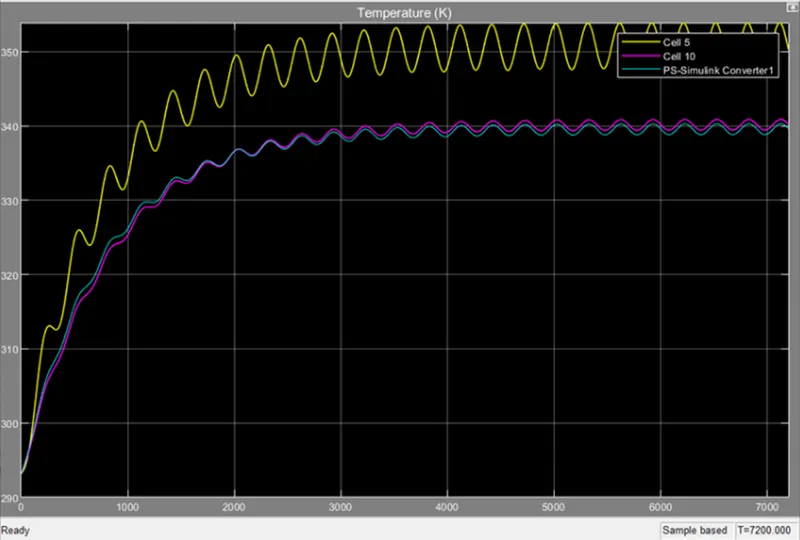
324K ie 50.85degrees
Result Explanation:
- For a 10 cell series lithium ion battery model we simulate the thermal effects and compare life cycle performance at various temperature, charge & discharge rates using Matlab results
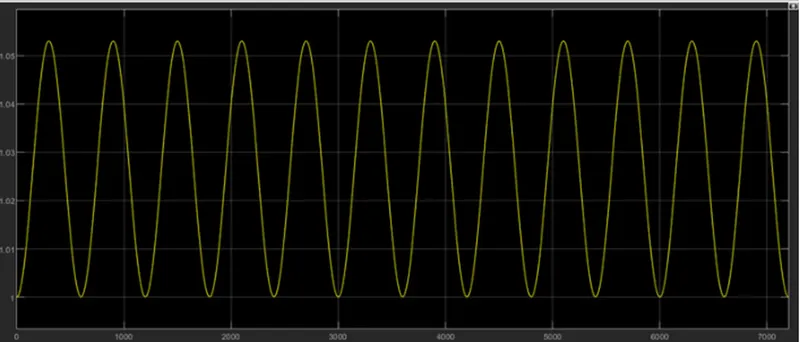
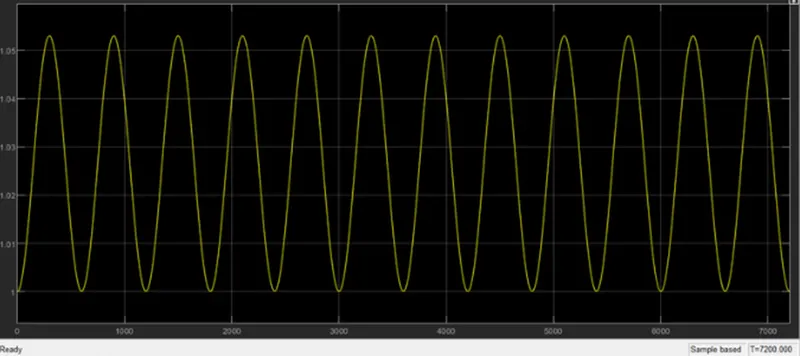
- 1-4 cells are normal cells 5th cell is faulty 6-10 cell is normal cells as we are simulating thermal effect on we give Cyclic Charge /Discharge Profile to circuit the wave form you can see the above results.
- So as we give temp for results at 300K ie 26.85 degrees the 1-4 and 6-10 cell temp is near to 316K but 5th faulty cell temp goes to 330K .
- Similarly in condition 310K the 1-4 and 6-10 cell temp is near to 340K but 5th faulty cell temp goes to 340K and the drive cycle is discharge .
- Similarly for 324K the 1-4 and 6-10 cells temp is near 340K and 5th faulty cell temp is 354K and the drive cycle charge/ Discharge drive cycle.
Conclusion:
We simulated the thermal effect and compared at various temperature faulty cell temp rise more them normal cell charge and discharge cycle given and due to temp rise it can damage the cell and reduce the performance of the battery.