Week 7 State of charge estimation
1. Analysis of BMS working
With the help of "BMS closed loop harness dashboard" MATLAB model the working of BMS can be analysed. The model consist of 3 test by ehich working of BMS can be analysed. The 3 test includes
- Charging
- Discharging
- Cell balancing
The harness model consist of many indicators as shown below
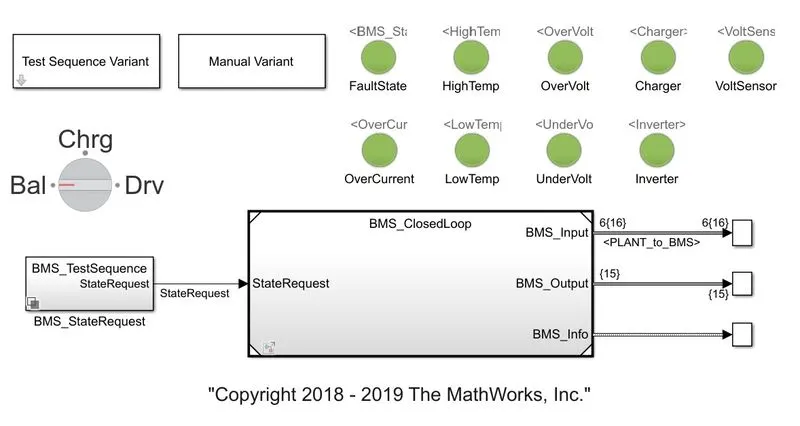
The model consist of indicators which turns Red when the fault happens, not operating within limits, modes, etc. The model also consist of a subsytem consisting of battery pack and BMS ECU.
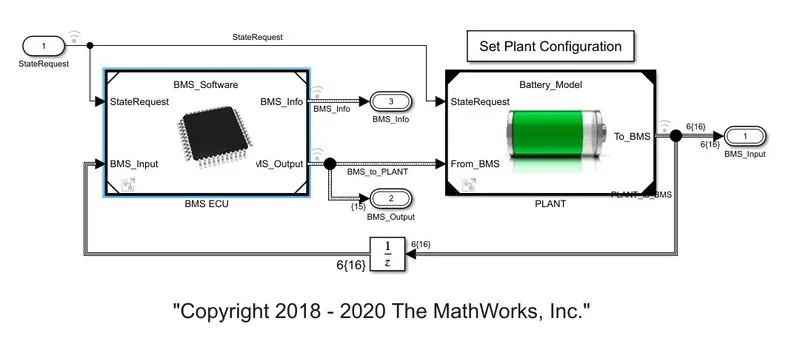
The BMS ECU (Battery Management System Electronic Control Unit), controls the battery pack voltage, current and power output with sensing the load requirement and battery state parameters (like SoC, SoH, individual cell voltage, current, temperature, etc.).
The BMS consist of set of algorithm and control unit, for controlling the battery pack. The BMS model is as shown below
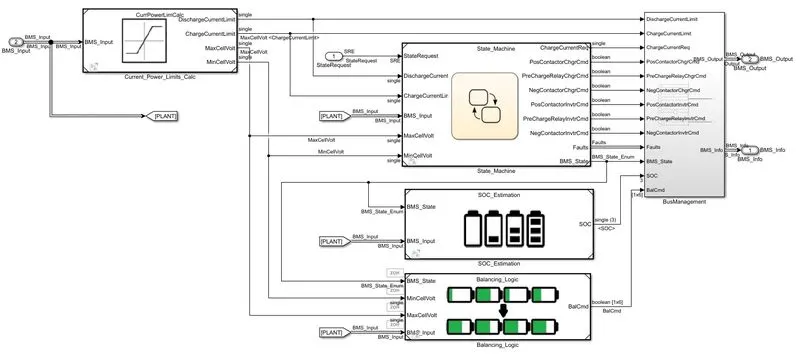
The BMS subsystem consist of
- Current Power limiter: Which sets the charge and discharge limits and also the min and max cell voltage based on the inputs like SoC, Voltage, Current and temperature.
- State machine: This consist of set of algorithm which produces control signals to the battery pack or the plant.
- SoC estimation: This block consist of Coulomb counter, UKF and EKF which helps in estimating the SoC of the battery pack.
- Balancing logic: This block works when th battery pack is charging or while standby for balancing the cells in the battery pack.
The PLANT substem includes the battery pack, charger and motor driving unit. These are the hardware model part. The PLANT works based on the control signlas recieved from the BMS.
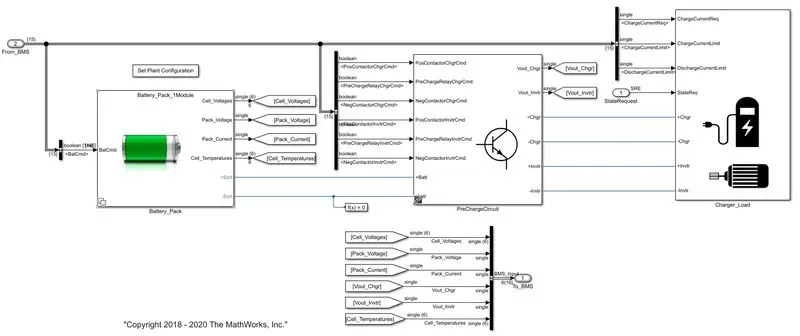
The PLANT consist of
- Battery pack: These is the mathematical model of the battery pack. It consist of battery pack and internal cell balancing circuit.
- Pre Charge circuit: This circuit helps in connecting the battery pack with charger or load, it helps in reducing high current and sparks while connecting and disconnecting.
- Charger/Load: This subsytem consist of charger and load.
For the analysing we have three test inbuilt with this model. For selecting the test double click on the "Test Sequence variant", from the option select 1, 2 or 3 from the choose test case for analysis.
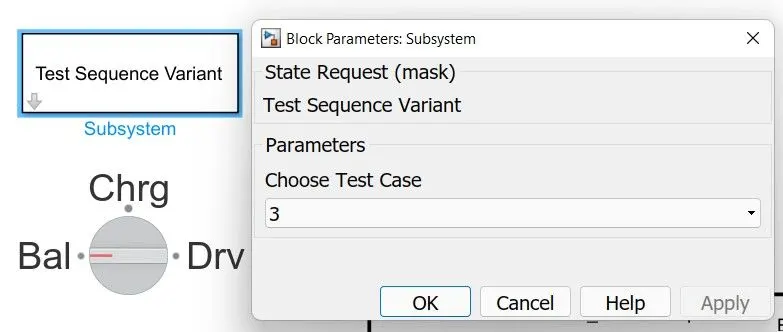
Test 1:
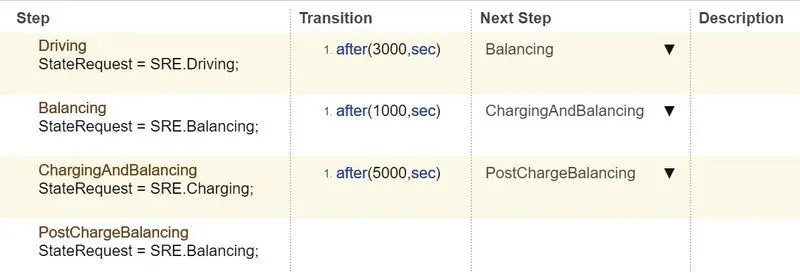
Running the simulation for test case 1. The following state condition are given in this test
following results are obtained
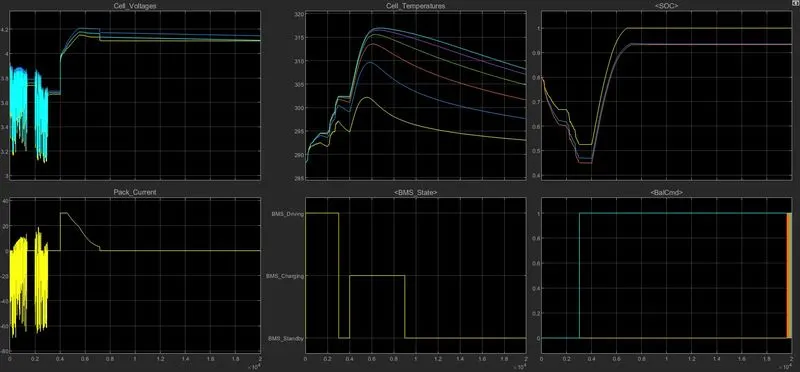
From the result the following observations can be made:
- Upto 3000s, the Plant takes charge from the battery. During this based on the drive cycle the energy is drawn from the battery pack while accelerating and energy is stored in battery pack during decceleration by regenerative braking.
- The +ve current shows the flow towards battery pack and -ve current shows current flowing outside battery pack.
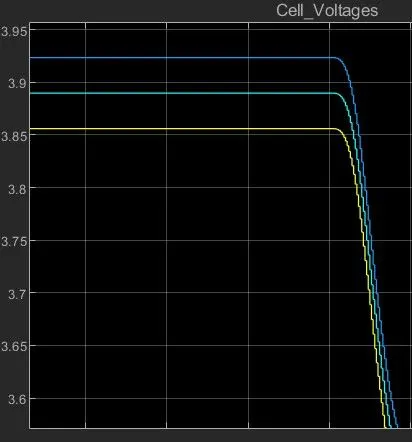
- The initial cell voltage of cell 1 is 3.85V, cell 2-5 is 3.88V and cell 6 is 3.925V. So the cells are unbalanced at initial condition.
- The cell goes on standby at 3000s. During this time the BMS initiate cell balancing command for cell 2-6. Because these cells have higher voltage than cell1.
- During 3000-4000s, we can see the voltage of cell 2-6 reduces and cell 1 voltage remains same. This is due to cell balancing at that time.
- From 4000s to 9000s the battery pack is charged from external charger, during this the cell balancing commamnd prevails.
- The charging is done in 3 modes
- CC charging, at first constant current charging is done, till it reaches nearly 80% SoC of cell6 (cell having highest initail SoC).
- CP charging, later for a while constant power charging is done till SoC reaches 93% SoC of cell6.
- CV charging, constant voltage charging is done for afterwards till the SoC reaches 100% of cell6.
- The SoC data from Coulomb counting reaches 100% first than SoC estimated with Klaman filters (UKF and EKF).
- At end of charging at 9000s, the cell 6 is completly charged, while other cells doesn't charged completly.
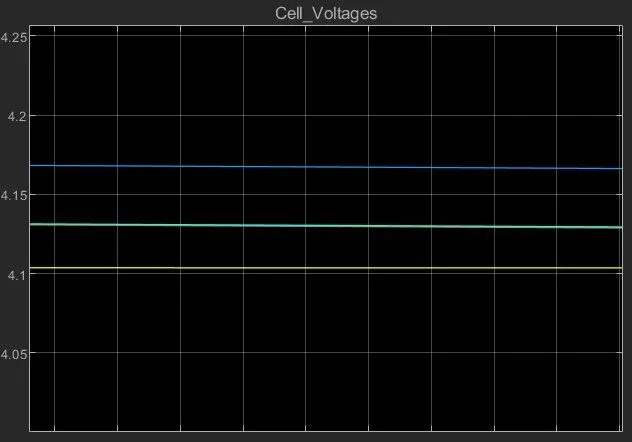
- This uneven charging is due to unbalance between the cells, the voltage difference between the cell 1 and cell 6 is 0.06V and cell 2-5 and cell 1 is 0.03V.
- The cell balancing is done afterwards by the BMS, during this cell 2-6 is participated in the cell balancing and the energy is reduced by `I^2R` loss through cell balancing resistance. Thus voltage of cell 2-6 reduces afterwards. At the end of 20000s, the cell voltages are
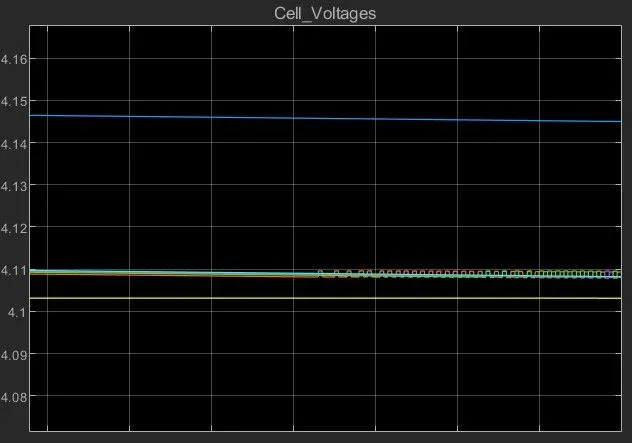
- Now the voltage difference between the cell 6 and cell 1 is reduced to 0.04V and cell 2-5 and cell 1 is reduced to 0.006V.
- Thus working of cell balancing in analysed from the above test. The cell balancing in this model is done by discharging the higher cell voltage battery by lossing its energy in the form of `I^2R` loss through cell balancing resistance.
- The energy is wasted during this process.
Test 2:
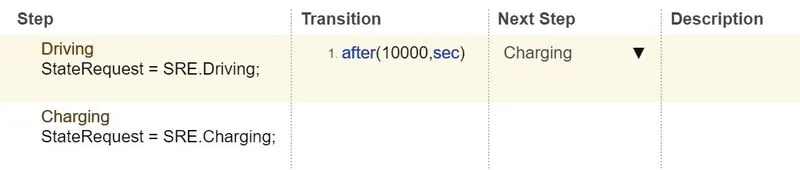
Running the simulation for test case 1. The following state condition are given in this test
following results are obtained
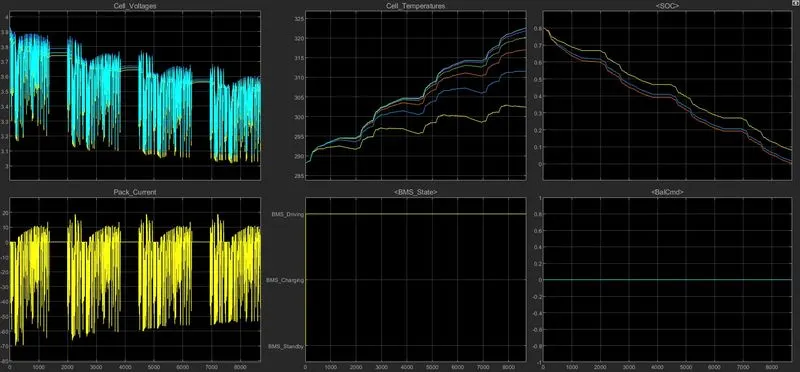
From the result the following observations can be made:
- The system runs in driving mode, ie., the battery is discharged no charging and cell balancing is done.
- The temperature rise of the cell1 and cell 6 is comparetly lower than the cell2-5, because these cells are located at the end side of the battery pack.
- The battery pack SoC reaches to 0% at 9000s, the SoC estimated with EKF reaches 0% first, and the SoC estimated with Coulomb counting has reached only 9%. This shows the difference in the SoC estimation.
- The cell1 voltage at the end is 3.1V, which is near to cut-off voltage.
- The cell volatge difference is similar at starting to ending, because no cell balancing is done during this simulation.
Test 3:
Running the simulation for test case 1. The following state condition are given in this test

following results are obtained
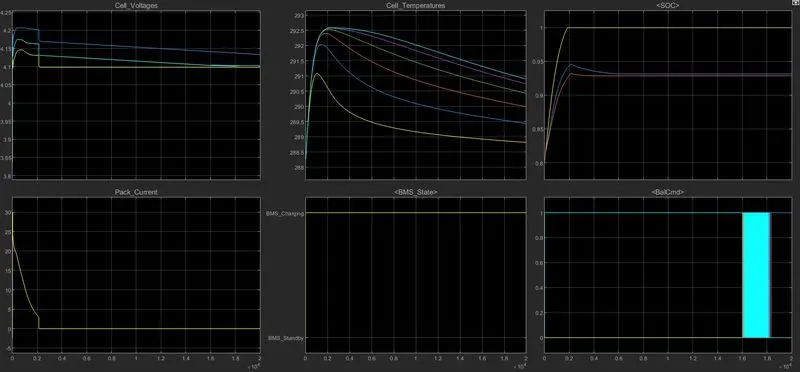
From the result the following observations can be made:
- During charging, the cell blancing is also turned ON.
- In this the battery pack is charged from the begining.
- Upto 2110s, the cell is charged by CC, CP and CV charging modes.
- The cell voltage at the end of charging is
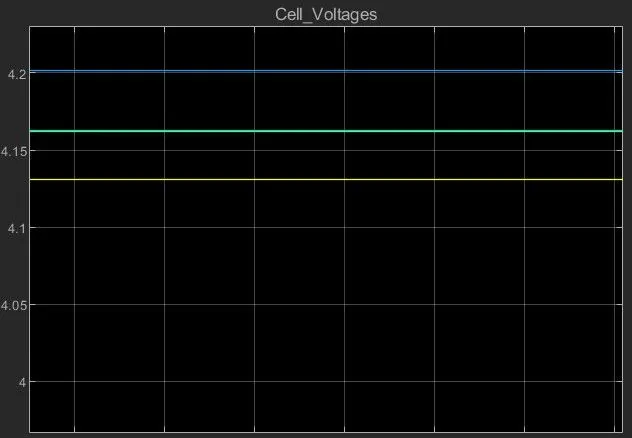
- The difference between cell6 and cell1 voltage is 0.07V and cell2-5 and cell1 is 0.03V.
- At the end of simulation ie at 20000s, the cell voltages are
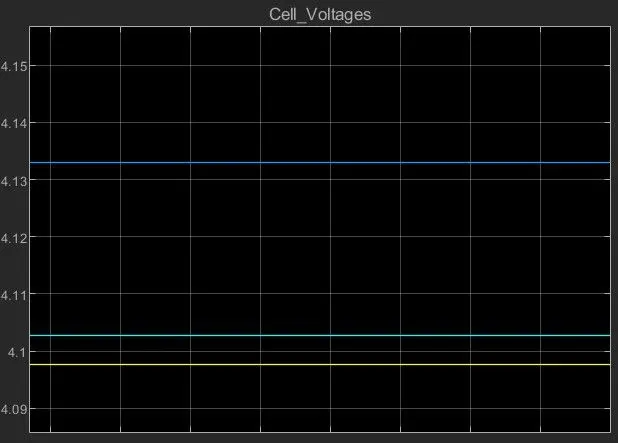
- The difference between cell6 and cell1 voltage is 0.036V and cell2-5 and cell1 is 0.007V.
- The difference between the cell voltages of cell1-6 is reduced after cell balnacing.
- Thus working of cell balancing in analysed from the above test. The cell balancing in this model is done by discharging the higher cell voltage battery by lossing its energy in the form of `I^2R` loss through cell balancing resistance.
CONCLUSION:
- The model simulates in three working mode: Charging, Discharging and Cell balancing
- During Discharging mode, Cell balancing is not done by BMS.
- During charging and standby the cell balancing is done by BMS.
- The cell balancing in this model is done by discharging the higher cell voltage battery by lossing its energy in the form of `I^2R` loss through cell balancing resistance.
- The cell balacing is done at slower pace, and thus heat loss is not much becuase few mA flows through the resistance.
- The working of BMS is analysed with the help of "BMS closed loop harness dashboard" model.
2. Coulomb Counting
Coulomb counting is a technique used to track the State of Charge of a battery pack. It works by integrating the active flowing current (measured in amps) over time to derive the total sum of energy entering or leaving the battery pack. This produces a capacity that is typically measured in Amp-hours.
The Coulomb counting method measures the discharging current of a battery and integrates the discharging current over time in order to estimate SOC. Coulomb counting method is done to estimate the SOC(t) , which is estimated from the discharging current, I(t), and previously estimated SOC values, SOC(t-1).
SOC is calculated by the following equation:
`SOC(t) = SOC(t-1)+ frac(I(t))(Q_n)Deltat`
But there are several factors that affect the accuracy of Coulomb counting method including temperature, battery history, discharge current, and cycle life.
In the above model, the SOC is estimated with Coulomb counting
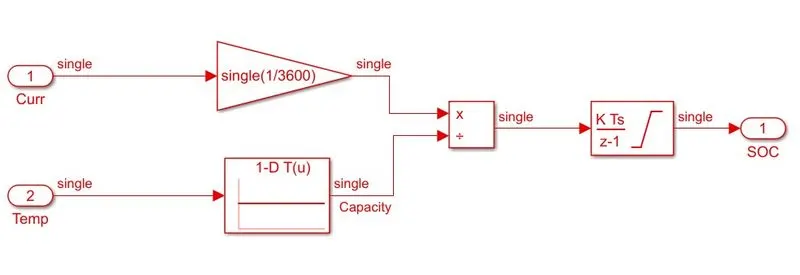
The BMS consist of a SOC estimator by using Coulomb counting and Kalman filters. In this coulomb counting is less complex one and less costlier compared to Kalman filter. The Coulomb counting method consist of two continous inputs pack current and pack temperature. The SoC is estimated by BMS by following steps.
- The pack current is multilpied with the gain 1/3600, to convert into hour format when integrated.
- The capacity changes with respect to temperature inorder to counteract this problem, the temperature input is given through a look up table (it is a pre-defined set of variables) and is divided with the pack current. So the temperature effect is also taken for more efficient estimation of SOC.
- Then the resultant signal is integrated over period of time to give the charge consumed or conserved during the period of time in Ah.
- This is then divided with the capacity of the battery pack to give the estimated SOC output.
The efficiency of SOC estimation is less compared to Kalman filter, due to its simple algorithm and low cost, it is widely used in most of the applications where SOC estimation is not much highly priority one.