Week-4 Challenge WOT Condition Part-2
1. Mapped and Dynamic Model
Powertrain blockset provides two types of combustion engine models
a) Mapped model
- Mapped engines represent macro engine behaviour as a set of lookup tables (brake torque, fuel flow, air mass flow, exhaust temperature, efficiency, and emissions) as functions of commanded load and measured engine speed.
- Model uses a set of steady-state lookup tables to characterize engine performance.
- The tables provide overall engine characteristics, including actual torque, fuel flow rate, BSFC, and engine-out exhaust emissions.
- Simulation is very fast with less efficiency.
- The data or operating points are pre-selected.
When to use
- Mapped engine models are suitable for analysis and design activities that do not require engine subsystem dynamic characteristics, for example, in engine and transmission powertrain matching analysis for fuel economy, emissions, and performance trade-offs.
- For quasi steady-state engine simulations.
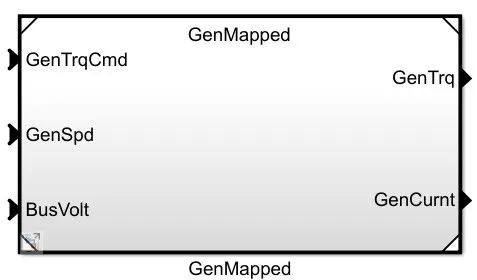
Generator Mapped subsytem model
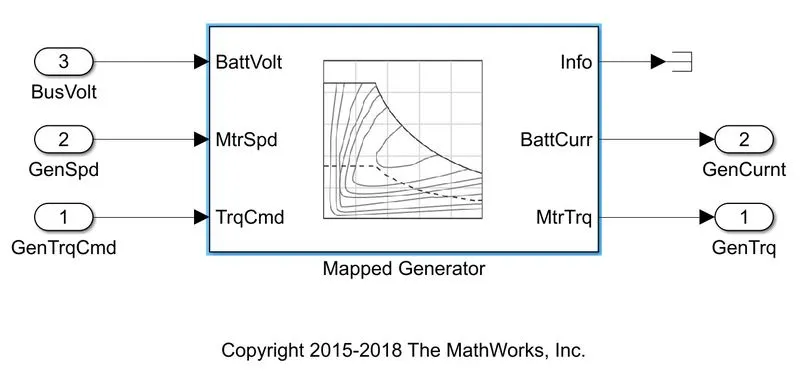
Inside of the genmapped subsytem. In this it can see that the battery current and motor torque generated is based on comparing the pre set operating point and inputs.
b) Dynamic Model
- Dynamic engines decompose engine behaviour into individual component models that account for engine dynamics, most notably intake airflow and turbocharger dynamics.
- Model decomposes the engine behaviour into engine characteristics that are separated into lower-level components. By combining components in this way, the models capture the dynamic effects.
- Real time simulation, each input is calculated in real time for generating output signals or commands.
- The simulation is slower as it consists of real time calculation. The output is more accurate compared to mapped model.
- Component level performance can be analysed.
When to use
- Dynamic engine models are suitable for designing control, estimator, and diagnostic algorithms that depend on dynamic subsystem states, for example, in closed-loop AFR control algorithm development.
- If you need a more detailed dynamic model and have component-level data.
- To analyse the impact of individual engine components on the overall performance.
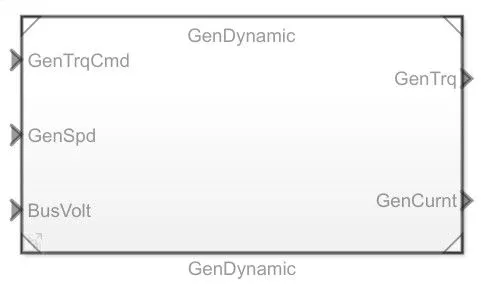
Generator dynamic model
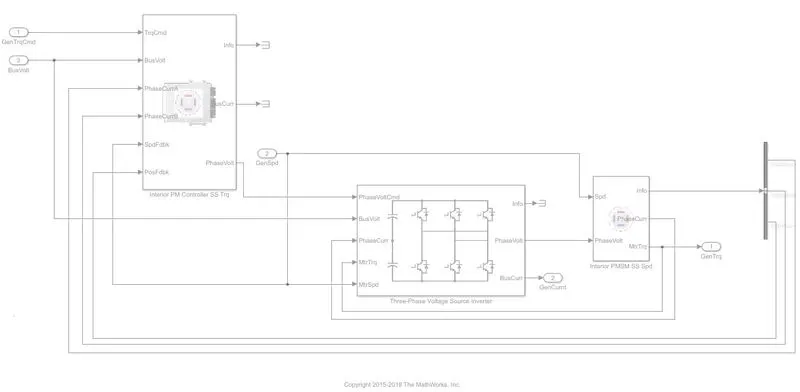
Inside of gendynamic model subsytem, in this it can see that the output battery current and gen torque is generated at real time withot any pre-set value given to the system.
Steps to select the required model
1. Open the power train blockset
2. In that select EV, HEV, PHEV or ICE vehicle model based on your need.
3. A new matlab simulink window will open which contains vehicle model.
4. In that follow the path shown below

5. A generator subsytem will open as shown below
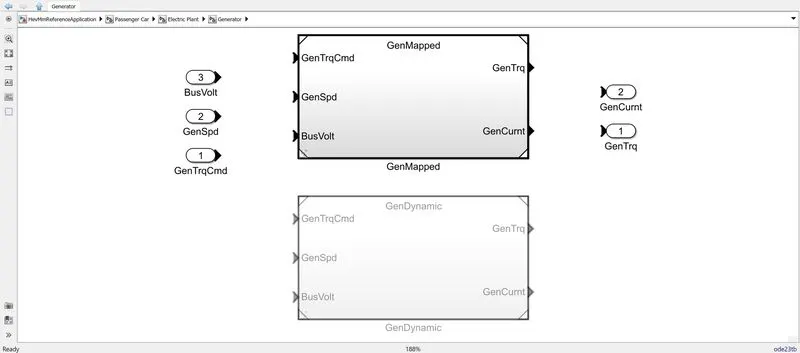
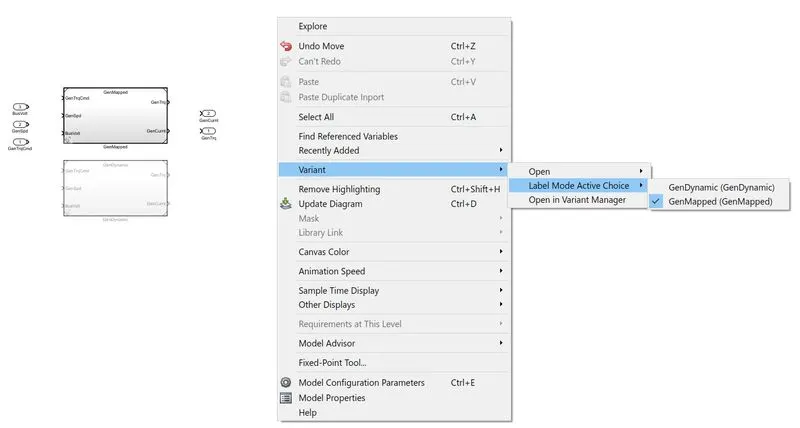
6. Right click on this window, in variant select the required model, dynamic or mapped model.
2. Miles per Gallon
In order to calculate the mpg (miles per gallon), it need the following data
- How much distance (in miles) travelled by vehicle in a duration/instance.
- How much fuel (in gallon) is utilised by the vehicle in the above duration/instance.
In the vehicle model, open the "performance calculation" subsytem. The path of this subsystem is shown below

In the substem we can see the model which calculate the mpg
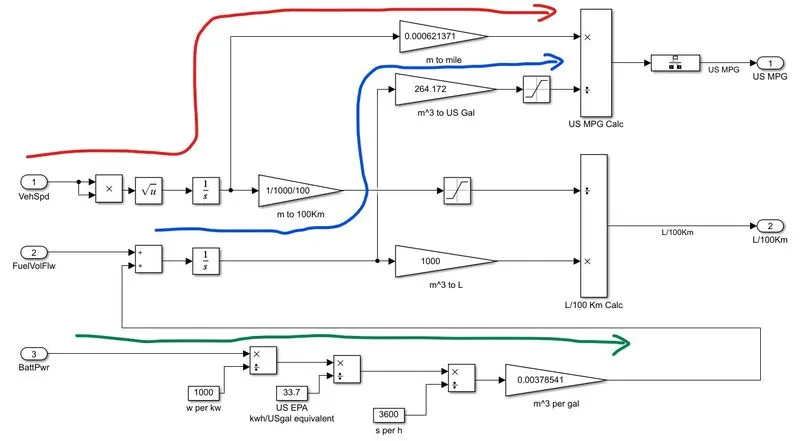
In this
- The red line indicates the calculation of distance travelled by the vehicle. The "VehSpd" is in meter per hour, on integrating we get distance in meter. Then meter is converted to miles by multiplying with a constant of 0.000621371.
- The green line indicates the calculation of fuel required for charging the battery, first power is converted into kW and then energy required for this power is calculated based on US EPA standards, finally the fuel required is calculated in gallon/h and then it is converted into m3/h (gph/264.172) to match the same onit of "FuelVolFlw".
- The blue line indivates the calcultion of fuel required by the vehicle, first the total fuel required is calculated by adding the ICE fuel requirement and battery power fuel requirement, the output of this is in m3/s. Then it is integrated to get fuel required in m3, then it is converted gallon by multiplying with a constant 264.172. Thus the fuel consumed (in gallons) by the vehicle in the duration/instance will get.
- Calculating mpg (miles per gallon) is by dividing the miles travelled by vehicle by gallons of fuel consumed by the vehicle in a duration/instance.
Factors considered for modelling fuel flow
- Commanded Torque(Nm)
- Engine Speed (rpm)
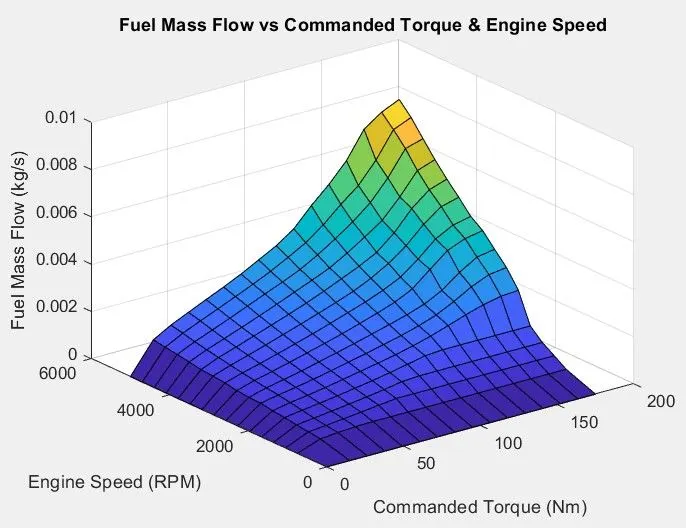
It's a 3-D plot for finding the fuel flow rate for a particular engine speed and commanded torque.
3. HEV with WOT(Wide Open Throttle) Test
To test the HEV in WOT test cycle follow the steps
1. Open the HEV model
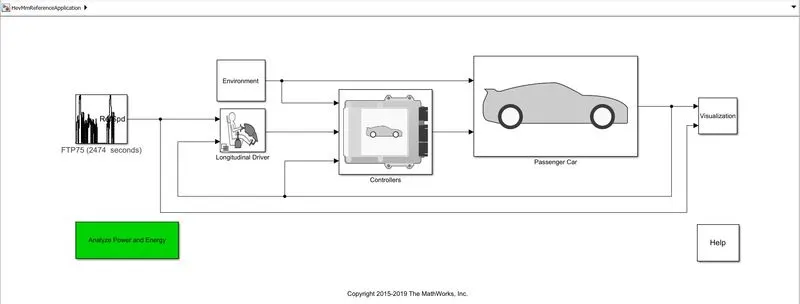
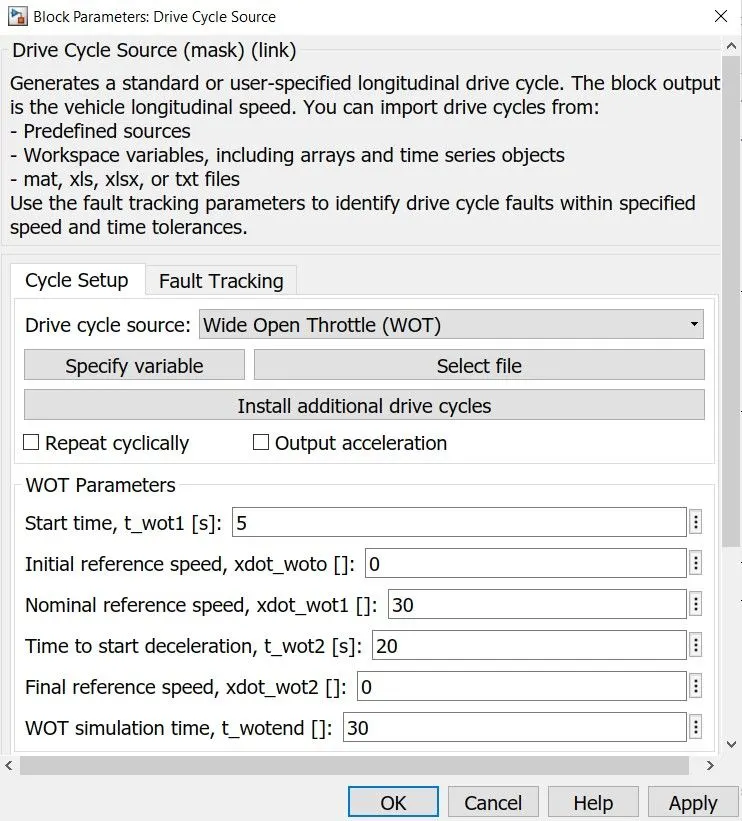
2. In drive cycle change it to WOT drive cycle, parameter chosen as default condition.
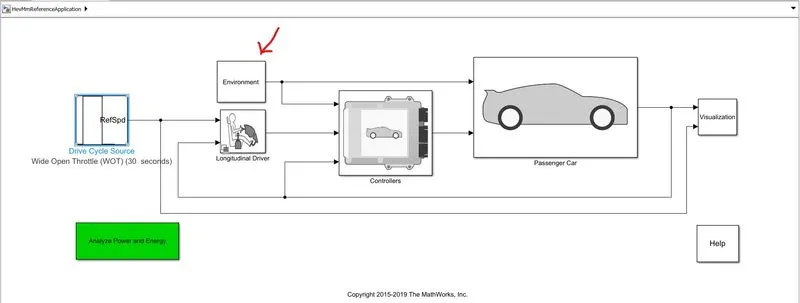
3. Now for considering the case study for HEV under hill climb and external wind forces, open the environment block in the model
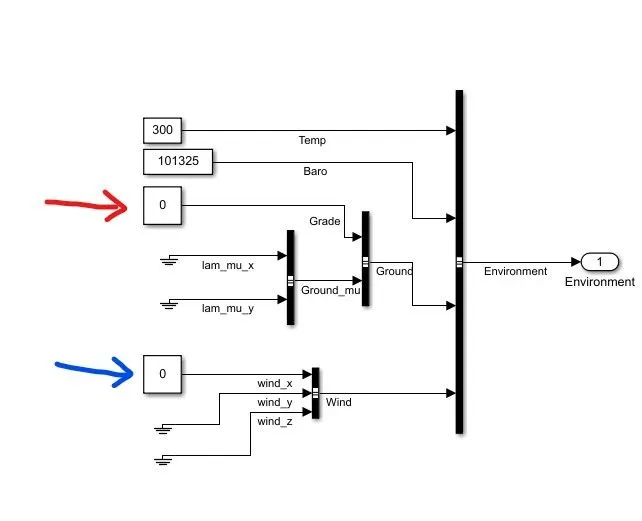
4. In the environment subsytem, change the values of grade and wind speed respectively for case study.
5. Run the model with required conditions.
Case1: HEV with no terrain effect (grade and wind velocity)
The performance of the HEV under this condition is
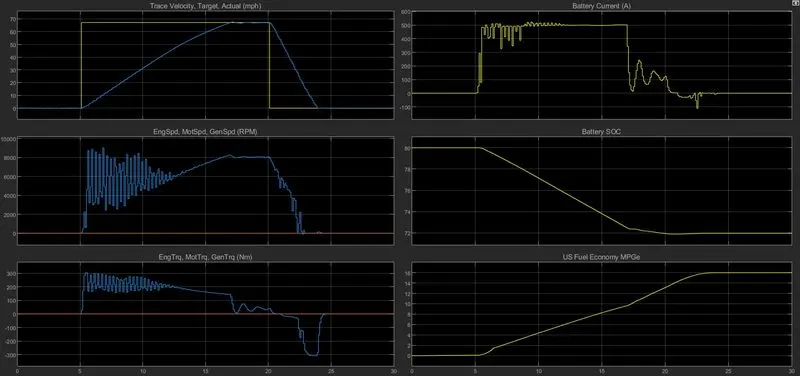
Inference
Max speed attained = 70mph
Charging of battery = NO (Gen doesn't turned ON)
Max fuel efficiency = 16MPGe
HEV mode = Battery operating mode
Case2: HEV with grade effect and no wind effect
Grade = 10 %
The performance of the HEV under this condition is
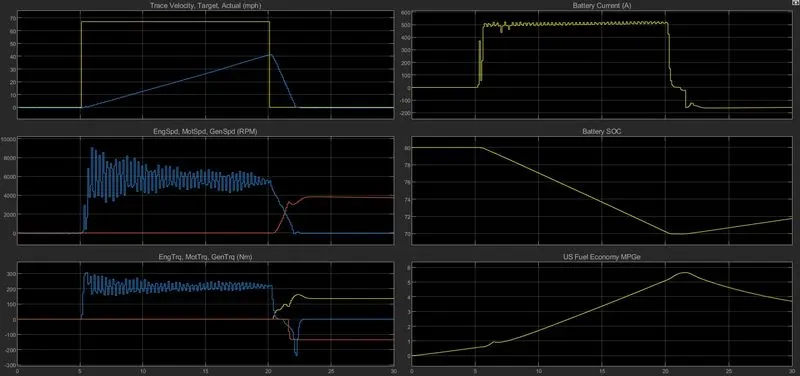
Inference
Max speed attained = 41mph
Charging of battery = YES (Gen turned ON)
Max fuel efficiency = 5.7MPGe
HEV mode = First Battery operating mode and the IC Engine
Case3: HEV with wind effect and no grade
Wind Speed = 15m/s
The performance of the HEV under this condition is
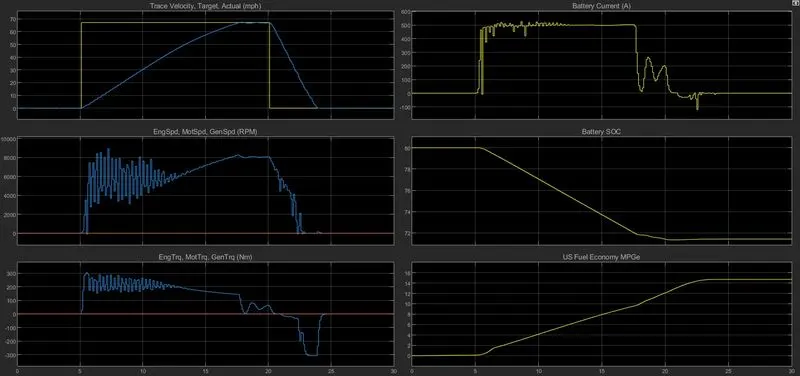
Inference
Max speed attained = 70mph
Charging of battery = NO (Gen doesn't turned ON)
Max fuel efficiency = 14.8MPGe
HEV mode = Battery operating mode
Case4: HEV with grade and wind effect
Grade = 10%
Wind Speed = 15m/s
The performance of the HEV under this condition is
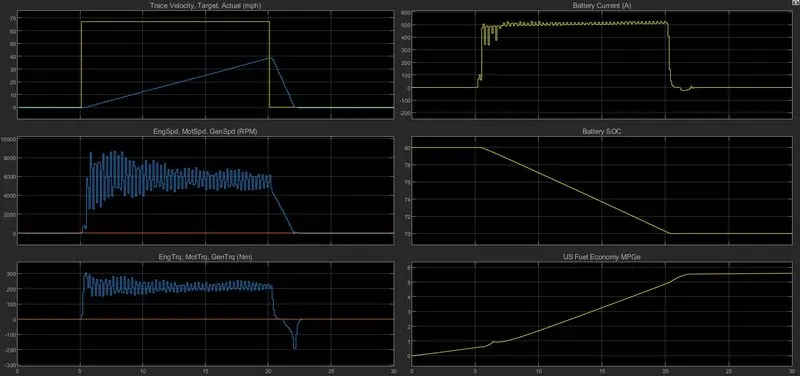
Inference
Max speed attained = 38mph
Charging of battery = NO (Gen doesn't turned ON)
Max fuel efficiency = 5.5MPGe
HEV mode = Battery operating mode
CONCLUSION
1. In grade effect alone, the HEV doesn't reach the max speed and the acceleration was very less due to the high hill climb force acting on the HEV.
2. In grade effect alone the HEV utilise the IC engine power to run the generator to charge the HEV battery, when the HEV starts to deccelerate and during idle throttle input.
3. In wind effect alone the HEV has taken little more time compared to CASE1, as there is a Air drag force acting on the HEV so the acceleration is reduce so as the time taken to reach max velocity increased. The Air drag force is less so vehicle has reached max velocity.
4. In CASE4, both air drag and hill climb force acts on the HEV, thus the max speed is again reduced as the acceleration is decreased within in a time period. This is due to both air drag and hill climb force acts on the HEV together.
5. The fuel economy decreases with increase in the force acting on the HEV, the fuel economy in decreasing order is CASE1>CASE3>CASE2>CASE4.
4. COMPARISON OF HEV AND EV
For HEV model type "autoblkHevStart" in command window
For EV model type "autoblkEvStart" in command window
Conditions:
1. Drive cycle: FTP75
2. No. of Drive cycle: 3
3. Environment condition (if any)
- Grade = 10%
- Wind velocity = 10mps
4. Initial SoC of battery 80%
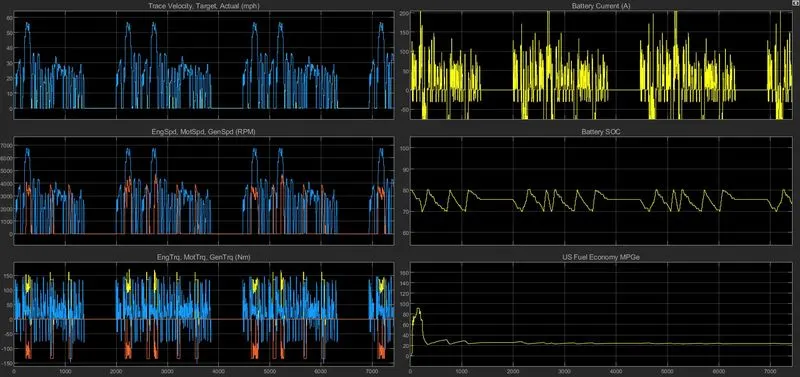
HEV model
Case1: With no terrain effect
Inference
1. 3 cycle completed: YES
2. Max/Min battery SoC: 80/70
3. Avg fuel economy: 25MPGe
4. Operating modes: EM (charging and discharging) and ICE modes
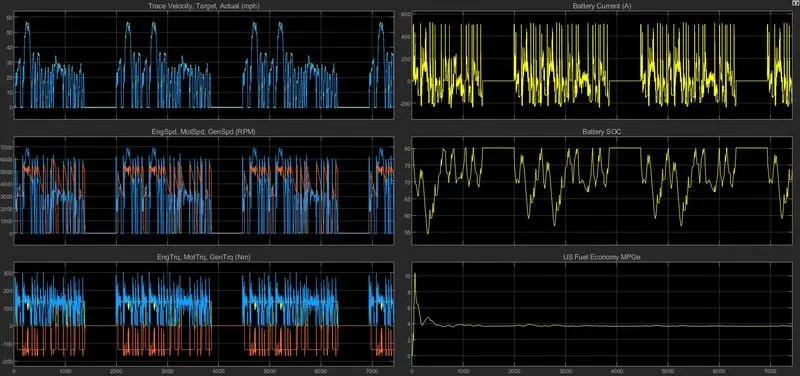
CASE2: with terrain effects
Inference
1. 3 cycle completed: YES
2. Max/Min battery SoC: 80/55
3. Avg fuel economy: 4MPGe
4. Operating modes: EM (charging and discharging) and ICE modes
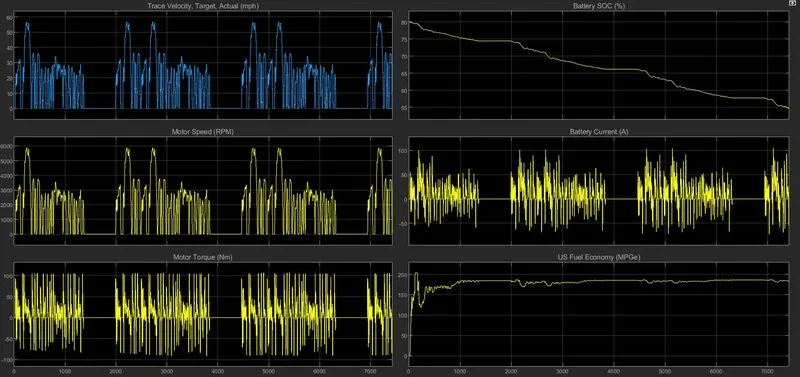
EV model
Case1: With no terrain effect
Inference
1. 3 cycle completed: YES
2. Max/Min battery SoC: 80/55*
3. Avg fuel economy: 180MPGe
4. Operating modes: EM (charging and discharging)
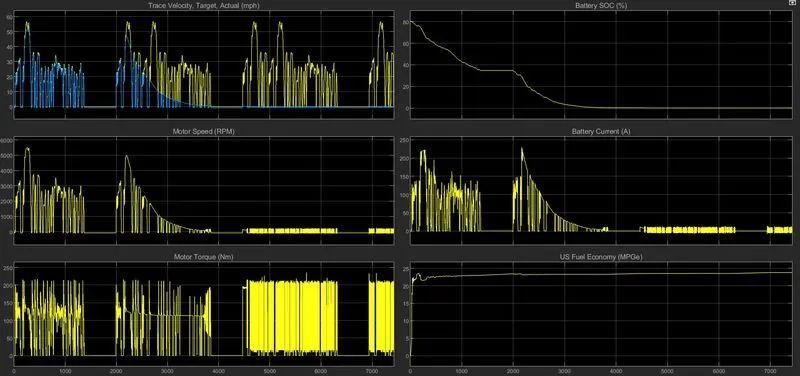
Case1: With no terrain effect
Inference
1. 3 cycle completed: NO (1.5cycle)
2. Max/Min battery SoC: 80/0*
3. Avg fuel economy: 23MPGe
4. Operating modes: EM (charging and discharging)
CONCLUSION
1. EV completly operates in battery, charging only takes when EV is deccelerating or braking. While in HEV the battery is charged and discharge frequenctly by means of ICE and during decceleration or braking.
2. With increase in grade the range of EV is decreased, since more power is required to run over a grade.
3. The overall fuel economy is good in EV compared to HEV, so EV is more social relevent vehicle in present scenario to control the pollution.