Week 7 State of charge estimation
Downloading and open closedloop BMS hardness dashboard model:
In file exchange open the document of designand test li-ion battery management algoriythm'
Download the zip file and extract to a folder. the folder consist of thses files as shown below,
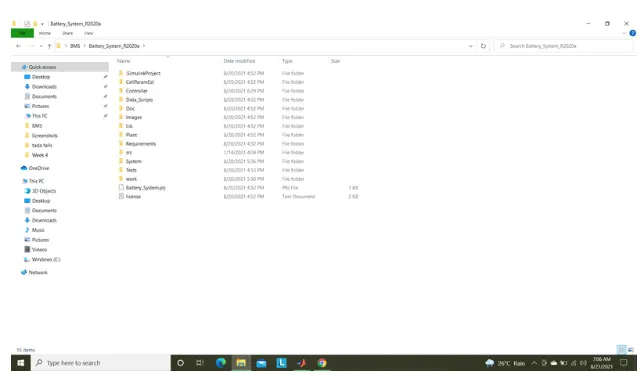
open matlab software and open the simlink model file of closed loop BMS hardness dashboard in test--->system--
>BMS_closedloop_hardness_dashboaed model file.
then given open project and model in pop-up dialog box to install all the model related library files into the current folder and woirkspace.
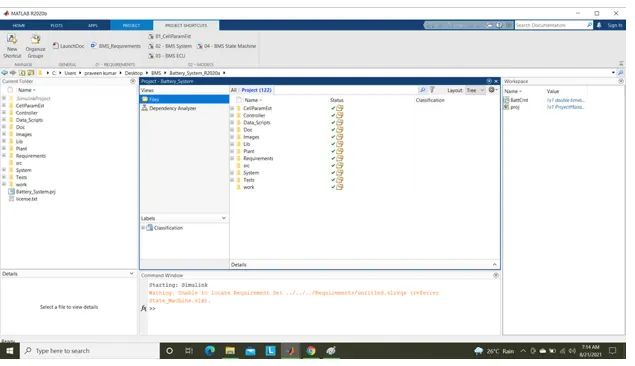
The model file open as,
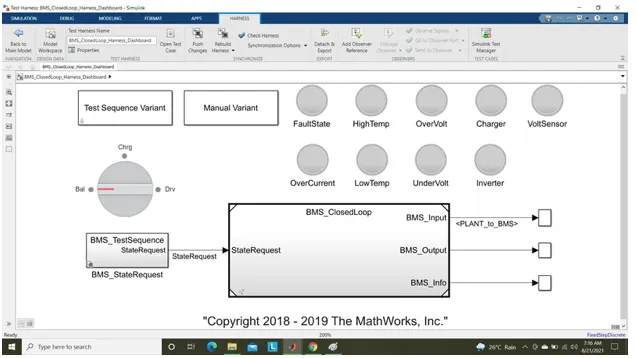
Block in model:
1). dash board
. Test sequence varient (selector)
. Manual varient (selector).
. BMS_tsetsquence state requred (subsystem) to provide state requred commands.
. lamps to indicate fault state, high temperature, over voltage, over current, charging, voltage senser operation, inverter operation, low temperature, under. if any fualt in these red indication will intimate us and all the in good conditions indicated by given indication.
. Rotating switch for manual varient change while runing simulation.
. In scope result the SOC of module, modul current, indidul cell voltage, individual cell temperature, battery state, cell balancing state are seen as outputs.
2). BMS_closed loop
In this main block consist of two subsystem, BMS ECU and PLANT units.
.
The plant output unit given as input to BMS ECU as BMS_input feedback loop. the state request is given to BMS ECU unit.
the final output from closed lopp model are BMS_input, BMS_info.
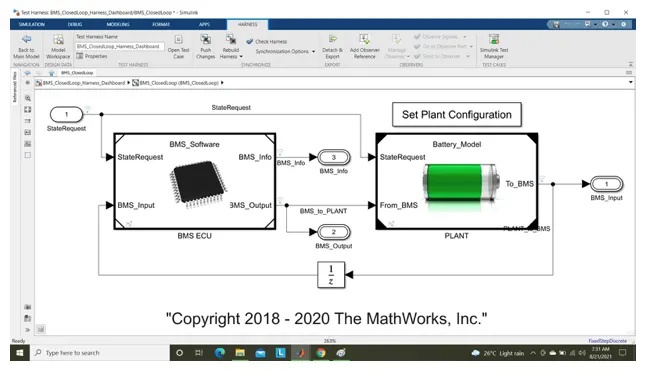
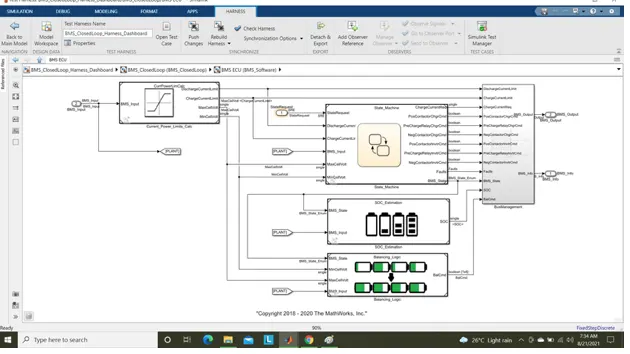
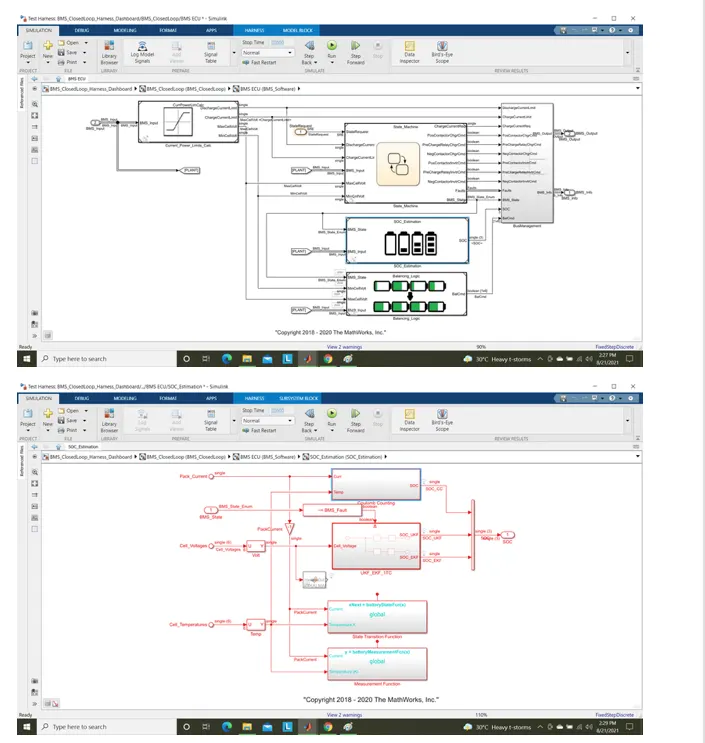
In BMS ECU unit, current power limit calculation are done used in sate machine block, SOC estimations, cell balancing logics as shown below,
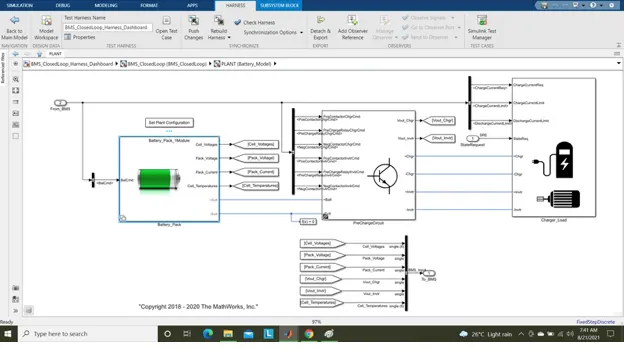
In plant unit, battery pack unit, pre charge unit, charger/load unit are created
In battery packs there are two types of configurations as 1 module (6 cells) and 16 modules (96cells)
Here we arechossing 1 module for lesser simulation running time.
Discussions:
A). To run three test cases from hardness dashboard of closed loop BMS control.
We have to test three cases for this model by selecting test sequence varient and select the cases one by one as fallows
THST CASE 1.
select 1 from test sequence varient dialog box and click apply as shown below.
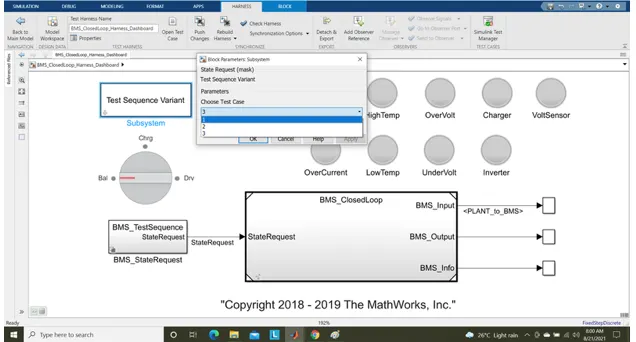
this selection consist of selection change in masked BMS_state request subsystem as,
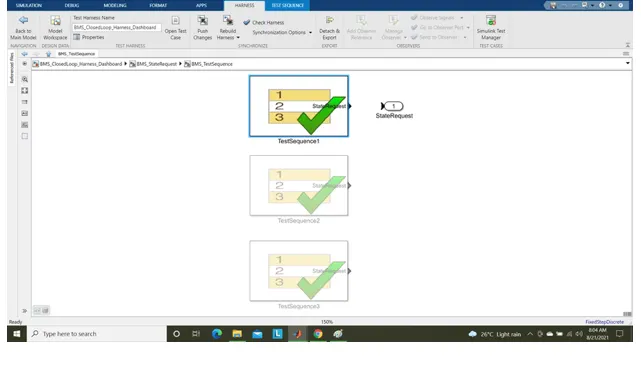
This test case consist of the fallowing sequence operations as,
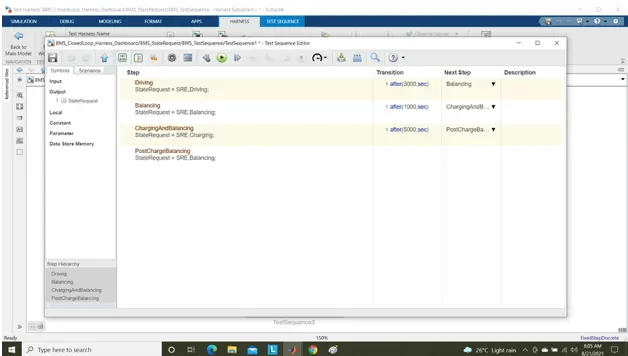
Here from the above test sequence editor it was set as,
. Driving for first 3000 secs.
. After 3000secs start balancing operations occure for next 1000 secs
. then charging and balancing occurs for next 5000secs.
after that sequence post charge balancing operation occures till end of the simulation period.
Results:
Run the simulation and results are shown as,
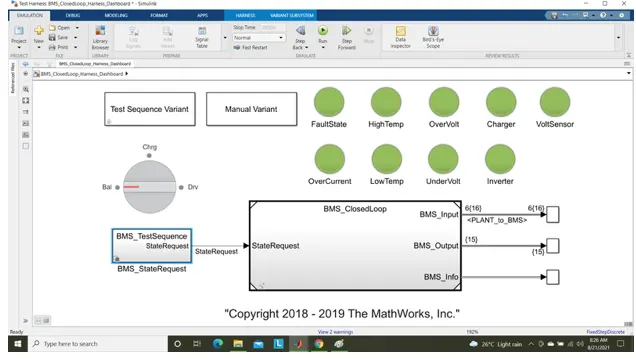
The lamp indication are showing green for overall simulation period showing that there are no faults occurs during the sequences.
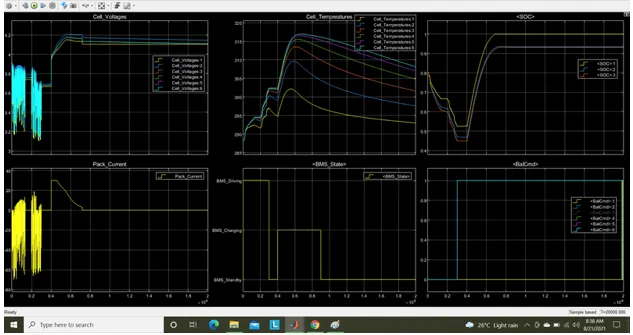
from the results we can underatand that,
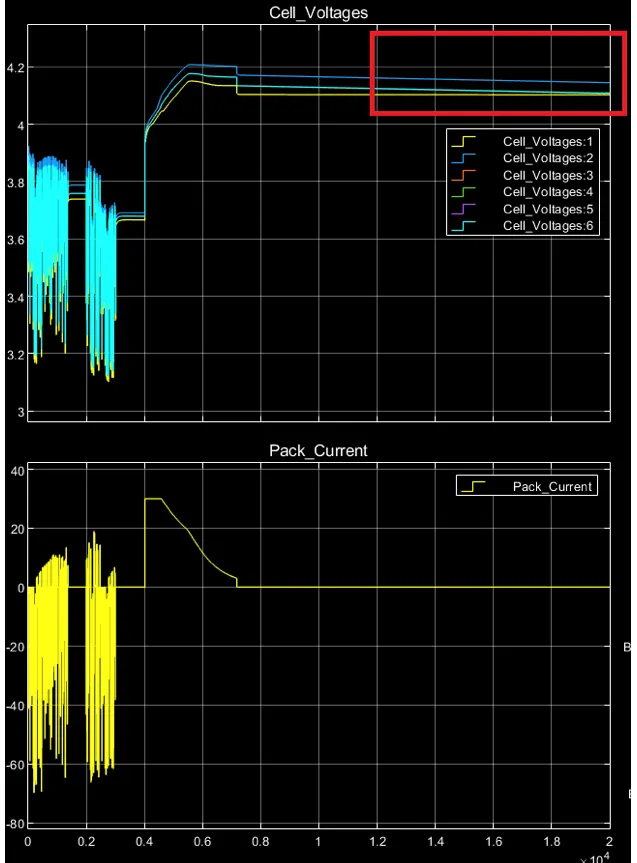
Cell voltage and pack current-
for first 3000 secs all 6 cells are in drive mode where dischargeing occurs majority and in standy mode for lesser duration at approximately 1000 to 2000 secs.
the voltage varies from 3.1v (min) to 3.9 (Max) in this range.
after 9000secs post charge cell balancing starte all cell voltage are balancing to a voltage with respest to cell to 4.1v as shown below, in this stage the pack is in stand by made.
Cell teperatures;
initail for 3000secs the temperature range of cell increase gradually from ambient temperature 288k to 320k.
from temperature of cell 1 lessre and cell 6 has higher temperature for all stages.
after 3000secs upto 4000secs the cell temperature are reducesd slightly as no current flow through cell in standby made,
after 4000secs tempertaure start incerase exponentially upto constant current region and start reduce as current folw reduce in consatnt voltage and cell balancing region upto 900secs.
cell 1 max temperature raised upto 320k and cell 6 temperature raised upto 317k.
BMS state
for 3000 sec the battery module in drive mode (dischargeing)
from 3000 sec to 4000 secs the battery module in balancing standby mode as shown from result plot.
after 4000 sec upto 9000 sec the battery module in charging and balancing mode.
after 9000secs only post charg balancing mode operation upto of simluation.
SOC
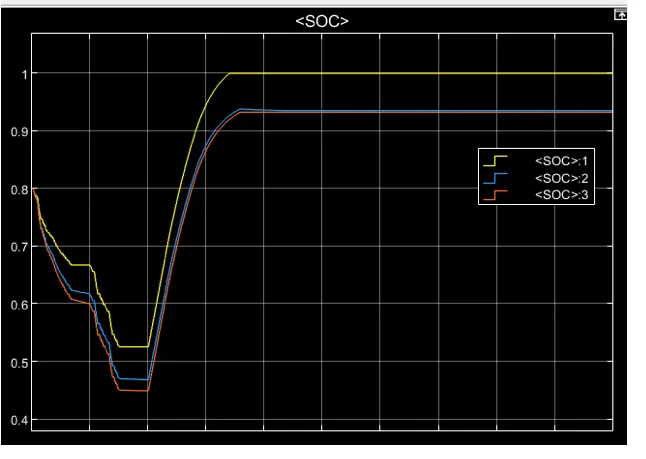
initially the state of charge opf battery module is in 80%
here the yellow plot repersent SOC estimation done by coulomb counting technique.
bule plot reperesent SOc estimation using unscented kalman filter technique.
red plot reperasent SOC estimation using extended filter technique
afetr 3000secs upto 4000 secs the SOC is constant ar 45% as cell balancing=cc modee, 7000 to 9000=cv mode).
afetr 9000 secs the SOC because consatnt approximately 94% as seen from above plots.
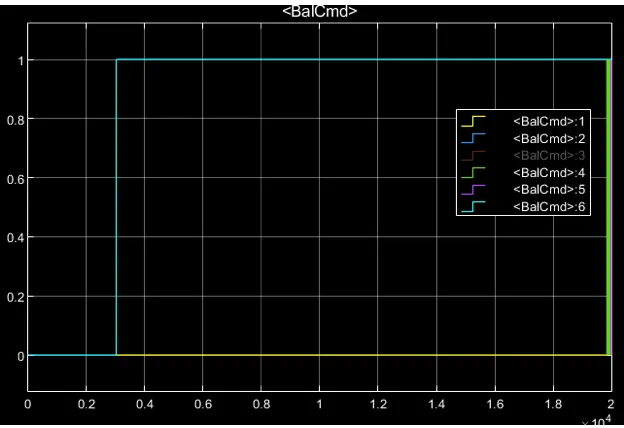
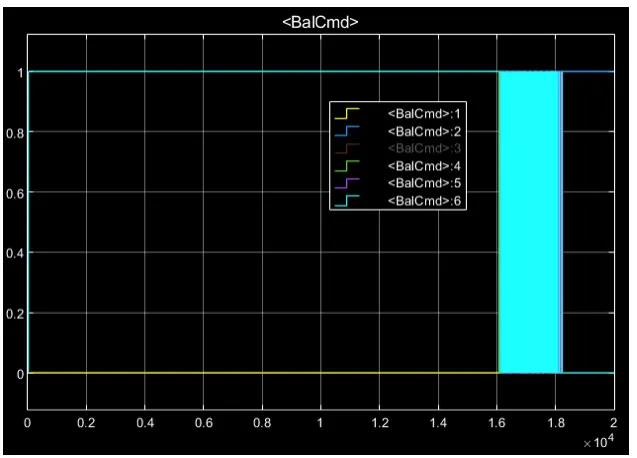
initally upto 3000 secs balancing was not performing.
after 3000 secs cell balancing start with on cell 6 and cell 2 as they rised to 1 as shown above since its voltage is higher than all other cell voltages
after thsi stage charging and balancing, post charge balancing are occures as cell and 2 reamin in 1 state till of simulation
as cell (yellow) is in lessser voltage than cell it reamin in 0 state tharougj out the simulation.
at the end of the simulatiom all cell voltages try to bananced equally as we seen eariler in single cell voltahe plot.
TEST CASE 2
Now select test case 2 and click apply in test sequence varient dialog box as shown below,
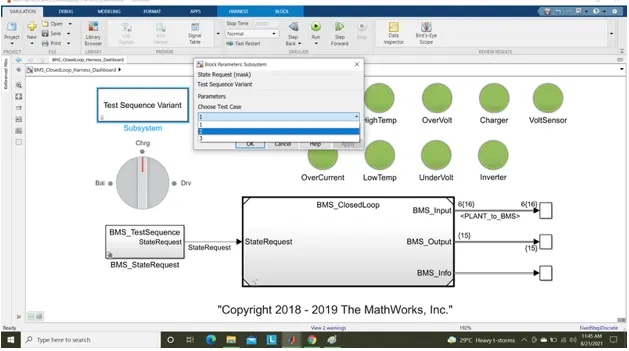
The case si altered to second as shown below,
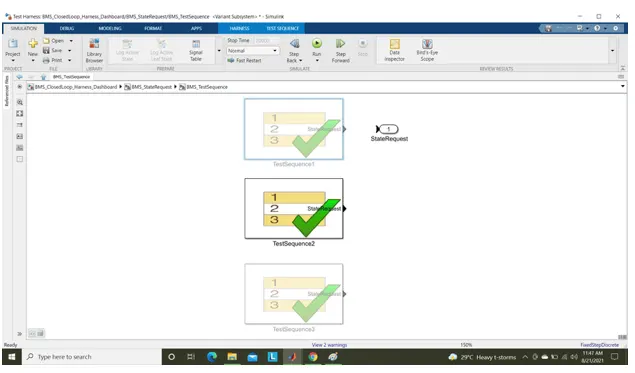
This test case consist of drive mode for 10000secs and after than charging occures till end of simulation.
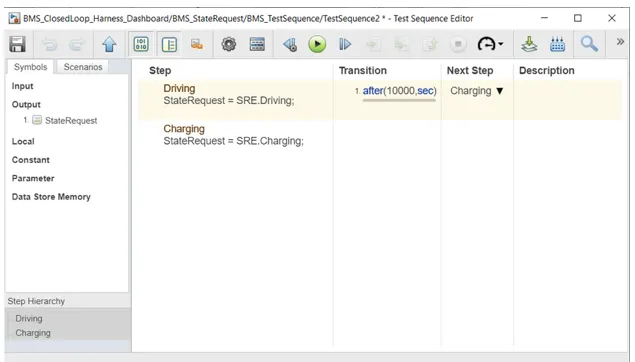
now run the model and result can be viewed,
RESULTs:-
the dashboaed results are shown as without any faults occured.
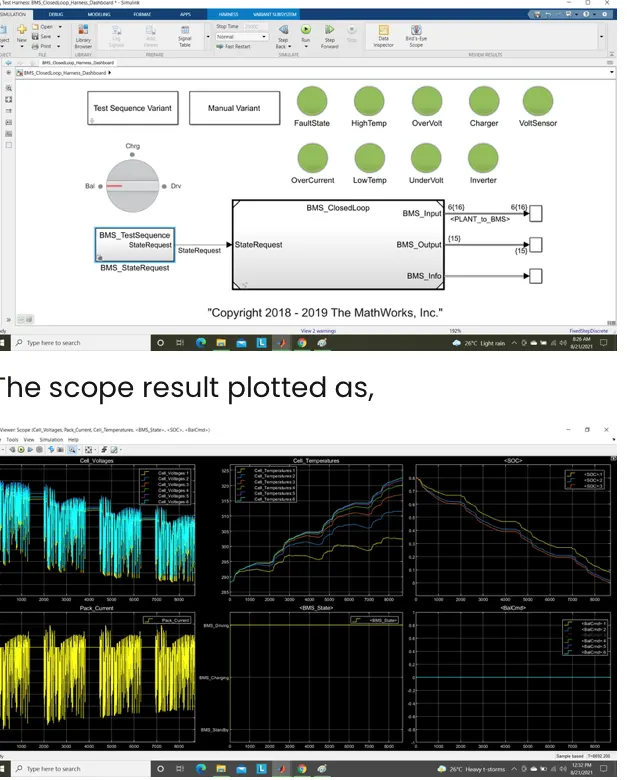
here in these plots only driving mode of battery module is plotted.
Cell voltage and pack current-
The cell voltage varies from maximum 3.9v and reduce to 3.05v as cut off voltage upto 9000 secs. entire capacity drained at 90000secs.
The pack current discharges upto maximum 70A and slight charging occures during the overall drive.
some stand by made conditions are in between the drive modes.
Cell temperature.
here cell 1 having lesser temperature variation from 288k to approximately 322.5k
celll 6 having higher temperature variation from 288k to approximately 322.5k
the cell temperature are reducing in between the drive modes as thses durations are in stand modes.
Battery module state:-
entire sequence is performing in drive mode as shown from the above plot.
small duration of standby modes are not plotted in this plot as simulation upto 10000sec command as drive mode.
but in actual practial sitautiomn standby modeas are not prsesnt as battery current drains by other smalll auxilaries of Ev's
SOC of module:-
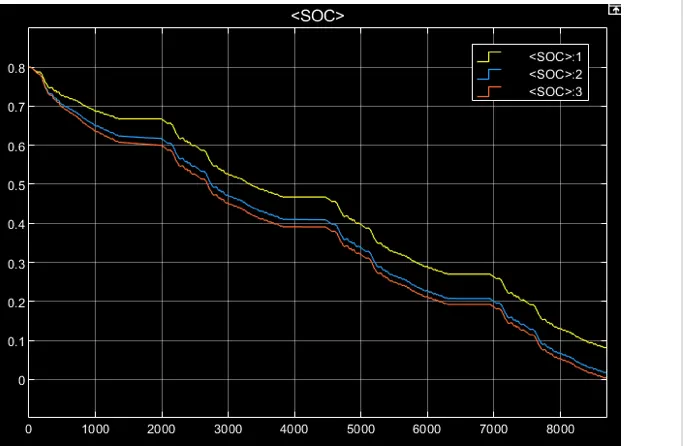
here the SOC reduce from 80% to 0% (as current drained for longer duration) in entire drive mode as shown in above plot.
At stand by modes in between them the SOC reamin constant as shown.
BALANCING;-
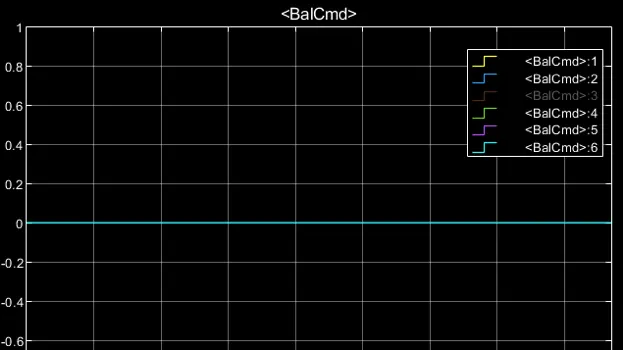
Here select of cell are not performed as shown as balance states are in 0 for entire drive mode.
TEST CASE 3.
Now select test case 3 and click apply in test sequence varient dialog box as shown below,
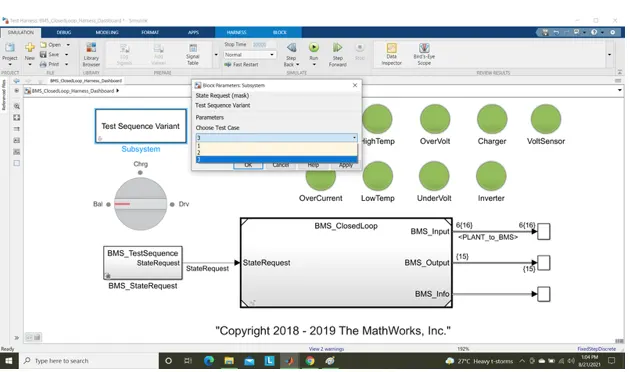
The test case in altered to third as shown below,
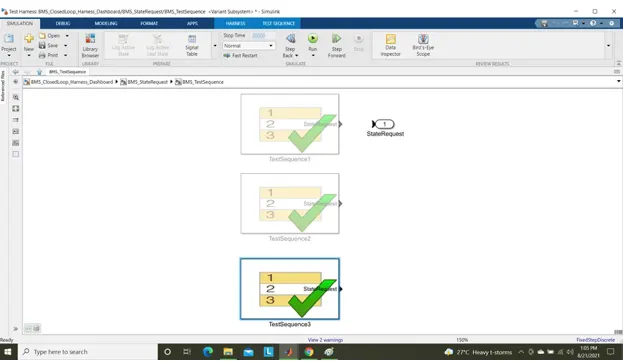
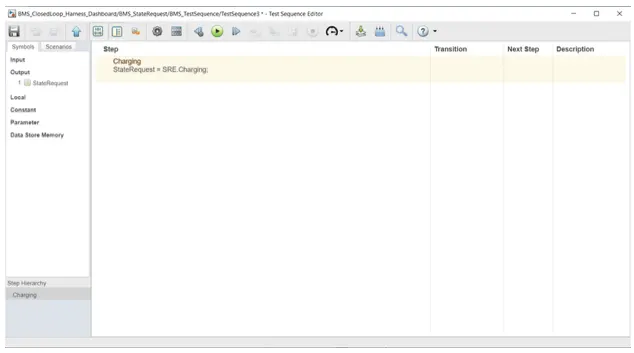
This test case consist of charging for entire duration of time,
run the model and result can be viewed.
RESULT:-
the dashboard lamps indications are shown as,
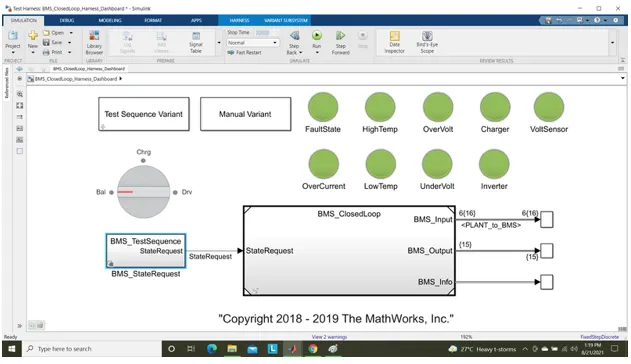
all indicatons are in green indicates no fault condition are occured.
The plots are shown as,
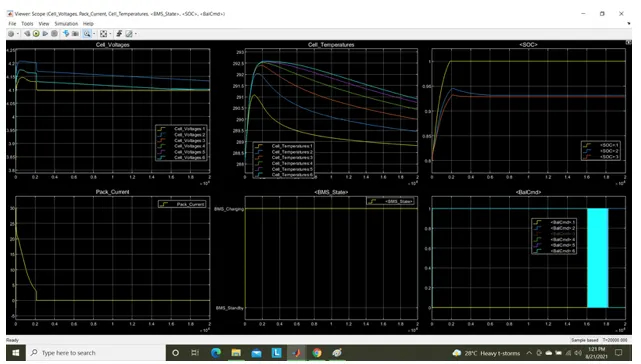
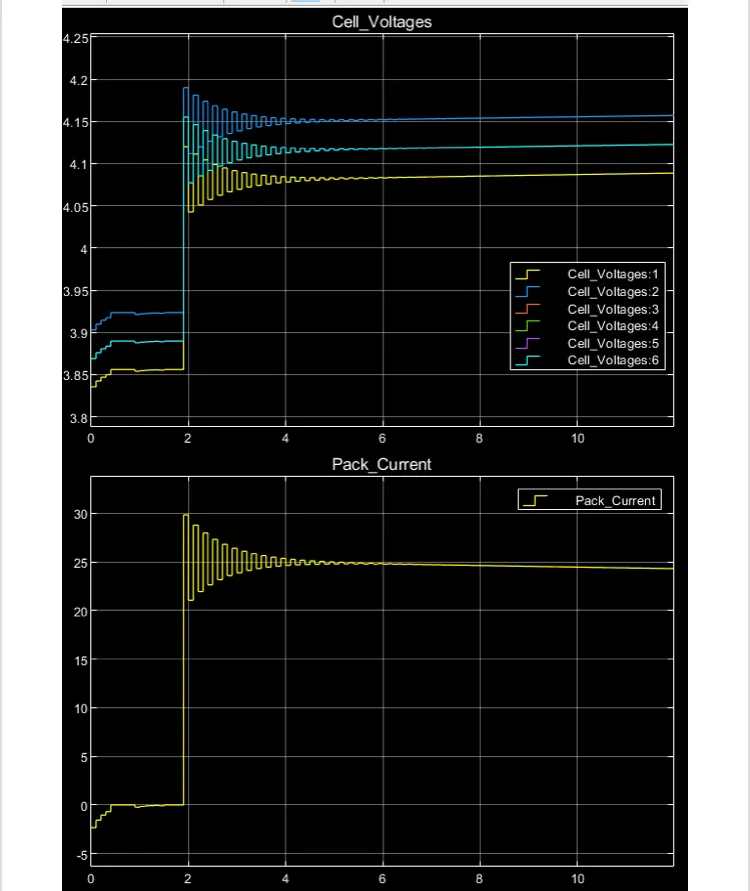
Cell voltage and pack current:-
initially cell 2, voltage rises from 3.9v (approx) to maximum 4.2v na d stabilised to 4.15v.
cell 1 series from 3.85v to 4.1v and stabilised to 4.08v.
the battery pack current raising from 0A to 30A and starts to reduce to 2.5A gradully at end of full charging upto 2000 secs
aftre full charge current folw will be cutoff as shown in result plot.
CELL TEMPERATURE;-
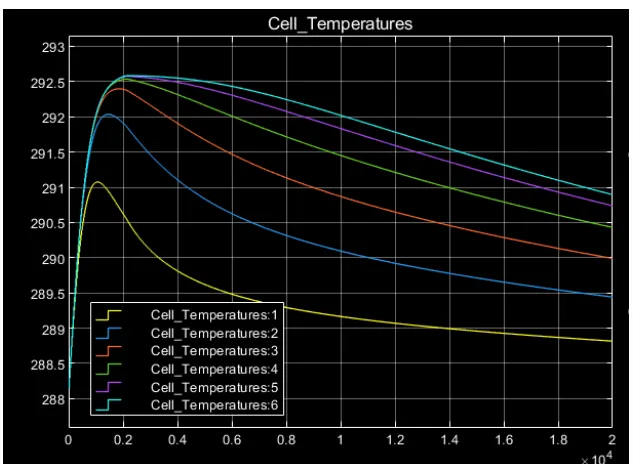
the cell temperature continue to increase head upto full charge and after that the temperature get start to reduce to ambient temperature.
as shown from result plot the temperature start full charge (at 2000sec).
BMS state:-
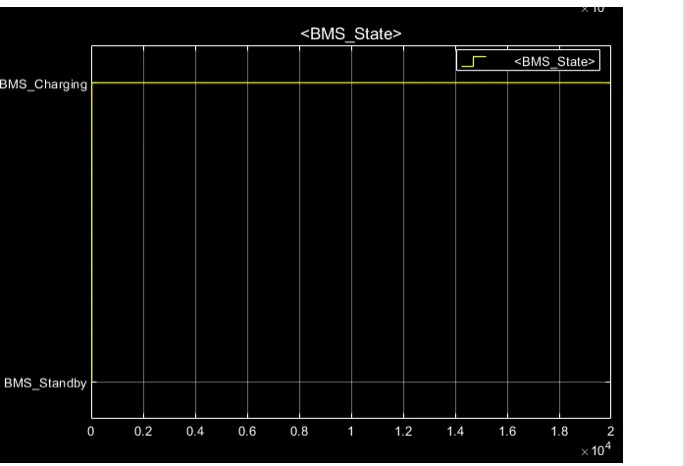
Entire battery pack sequence is operaing in charging mode as shown above
SOC:-
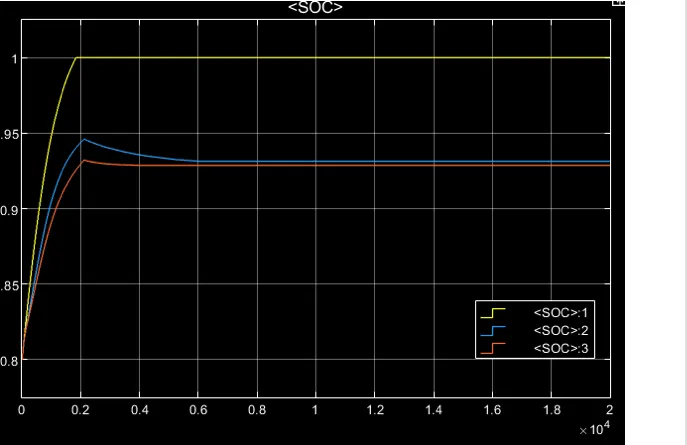
the pack SOC gets fully charge at 2000secs and remain at full charge for rest of the sequence as shown above.
the actaul state of charge is arround 93% shown as full charge shown by UKF and EKF rechniques.
Cell balancing:-
B).
To explain coulomb countimg for finding the SOC estimation in BMS coulomb counting:-
SOC (state of charge) is define as the arte of avialable capacity to its maximum capacity when a battery is fulkly charge and describes the remainsg percentage of the vbattery
Capacity.
To find this SOC % we are using coulomb counting method.
The cou;omb counting method measurement the discharging current of the battery and intergrates current over time in order to estimate SOC.
Which can be estimate from discharge current (I). previously estimated SOC values (SOC(t-1) the relation cen be given as,
SOC(t) = SOC (t-1)+I(t)/Qn*delta t
modified coulomb counting:-
In this technique dischage current is corrected with a function and corrected current is found out for accurate SOC estimation.
Ic(t) = K2I(t)*2+K1I(t)+ko,
where ko,k1,k2 are constnt value obtained from the practice experimental data.
The SOC relation can be given as,
SOC(t) = SOC(t-1)+Ic(t)/Qn*delta t
SOC estmation in BMS model:-
To see the model of coulomb counting technique in BMS model ckick the subsystem of SOC-estimation and click coulomb counting
it developed as shown below,
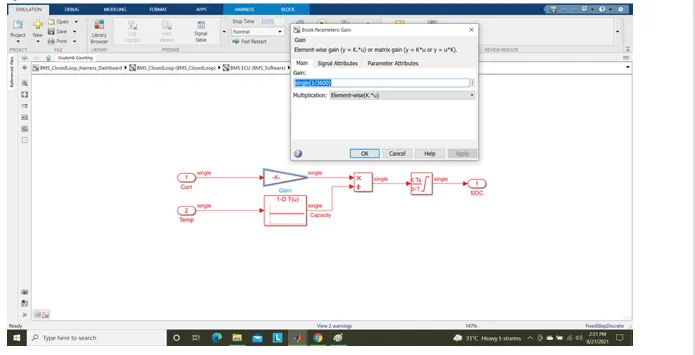
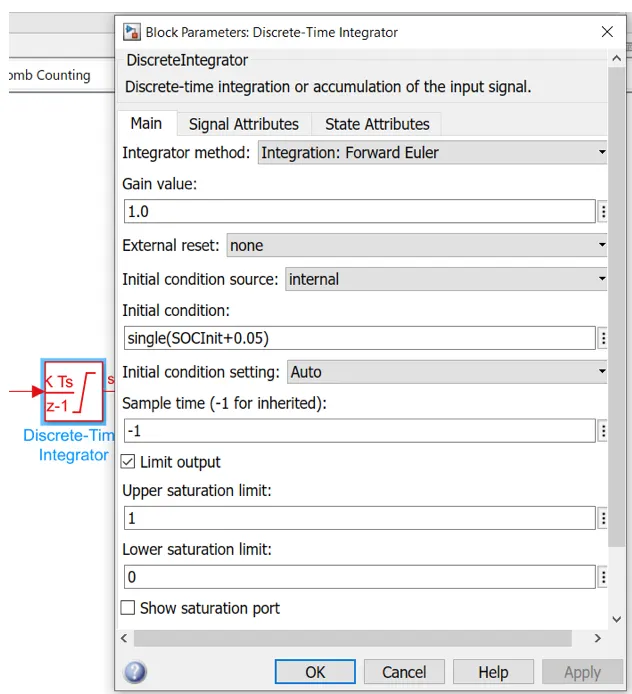
Here the discharge current from the battery given to agin with value as 1/36000 to convert current to ahr.
the value is divided by capacity due to temperature change. then integrated with a again value of 1 with samnple time -1 as ew are using discreate intergrate.
the saturation limited are from 0 to 1.
We will get the SOc values from 0 to 1 multiplies with 100 to get inb percentage of SOC.
Note:- BMS files foulder(R2020a) attached with this submission.