Week 7 State of charge estimation
Questions:
1. Simulate the 3 test cases from the harness dashboard and write a detailed report on the results
2. What is coulomb counting? Refer to the above model and explain how BMS implements coulomb counting for SOC estimation?
Answers:
1. Open BMS_closedloop_harness_dashboard.slx from the respective folder
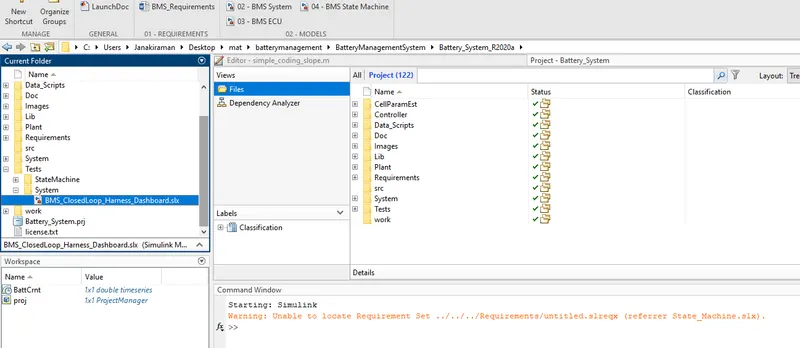
the model opens as below,
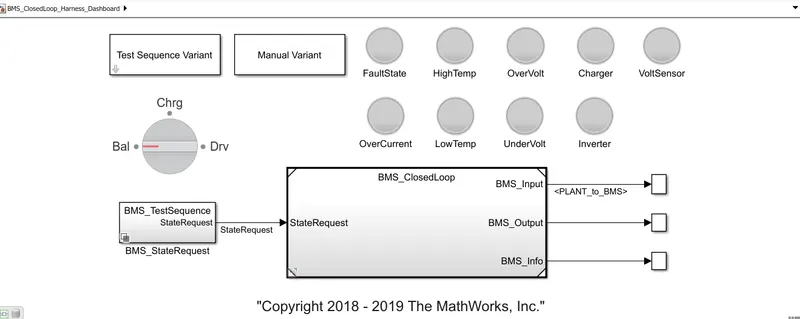
- the above model is the dashboard for BMS.
- here we can select the test sequence.
- there are 9 lamp blocks that help in finding the conditions of system logic or any faulty condition. green will be indicated in case of correct logic condition and red will be indicated for fault in the system logic condition.
- these lamp blocks include fault state, high/low temperature, over/under voltages, charger, inverter faults, voltage sensor, and over current.
BMS closed loop
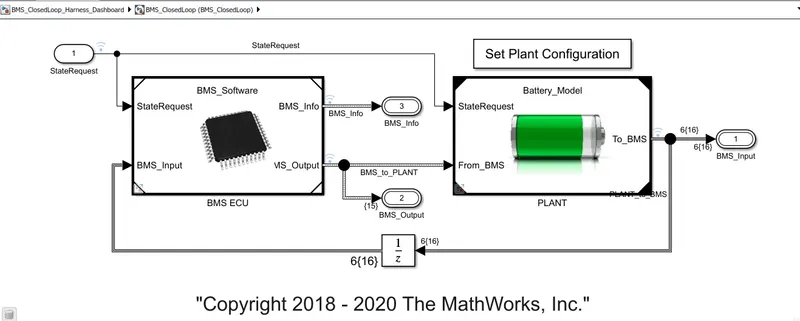
- Inside BMS closed loop, we have two blocks BMS ECU and PLANT.
- they are arranged in a closed-loop model, where the output from the PLANT is feedback to the BMS input of BMS ECU. and the BMS output is given to the PLANT.
BMS ECU
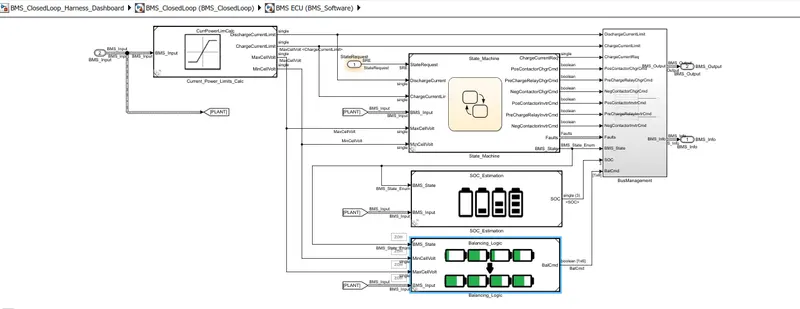
- Inside the BMS subsystem, there are subsystems for current power calculation, state machine, SOC estimation, balancing
- various calculation and state machine logic are implemented.
PLANT
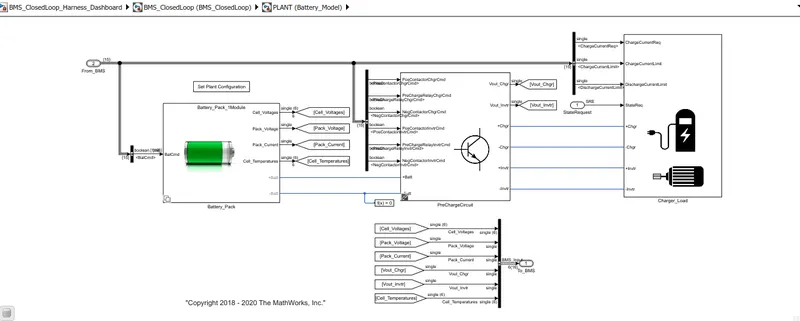
- here we have a battery block, that can select battery pack 1_module or 16_module
- then precharge circuit which helps in preventing the damage occurring to the system circuits when load or charger is connected.
- charger(charging calculation) and load(drive cycle) subsystem are implemented.
Simulation of 3 test sequence
case 1:
- selecting 1 in test sequence variant
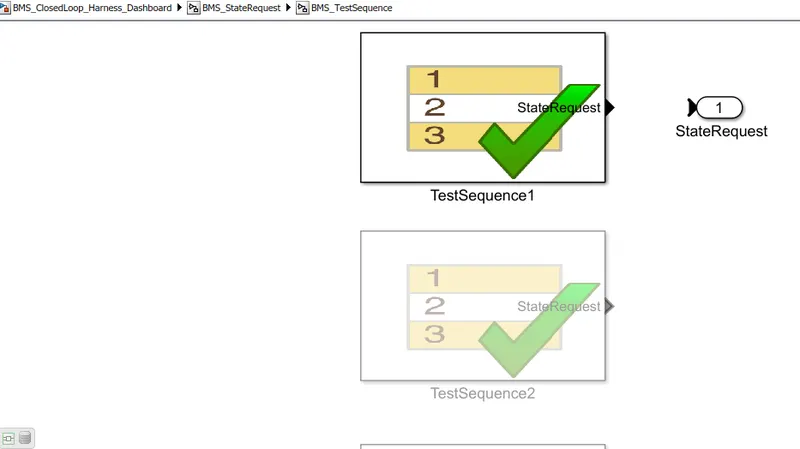
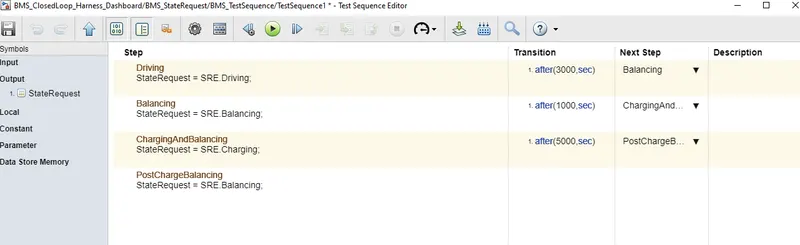
- in TestSequence1 we have state request for driving-balancing-charging-balancing.
- first step driving for 3000 sec
- second step balancing for 1000 sec
- third step charging and balancing for 5000 sec
- fourth step post charge balancing for the rest of the simulation.
after running the simulation,
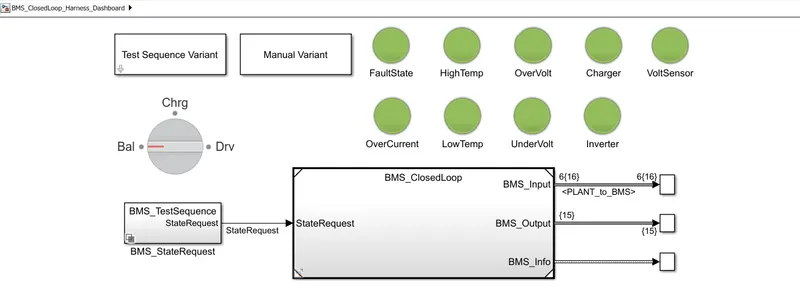
- all lamp blocks are green indicating that all the logic conditions are correct or satisfied.
scope result
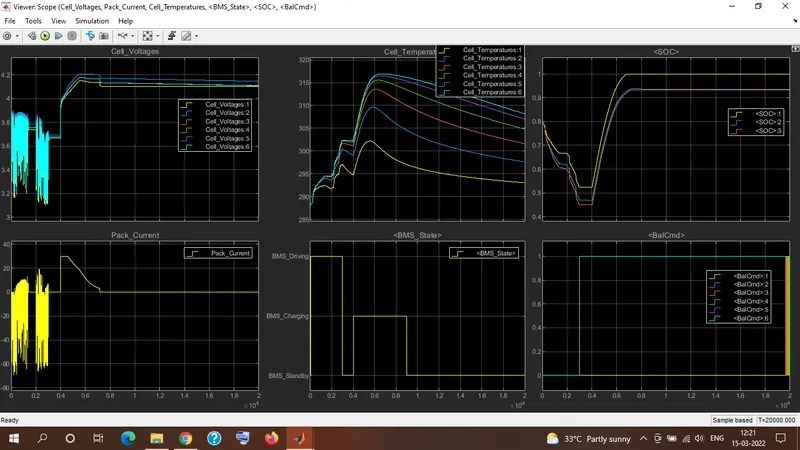
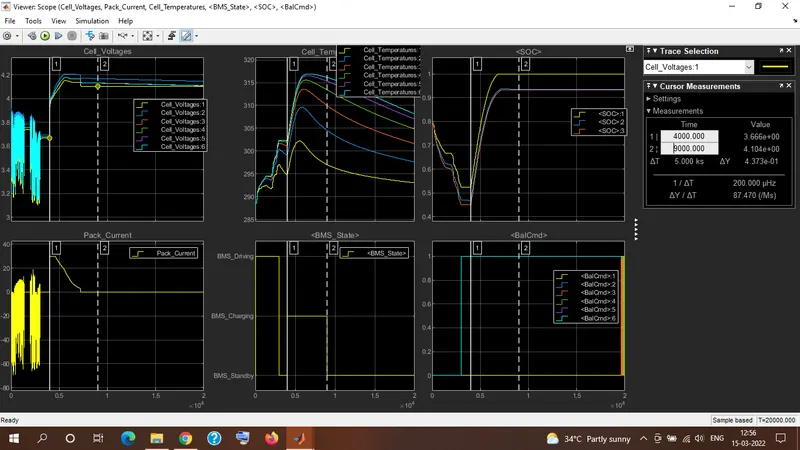
cell voltages and pack current
from 0 to 3000 sec, driving is happening
- the voltages of 6 cells are varying from a maximum of 3.9V to a minimum of 3.1V
- in the pack current plot also we can observe the variation, the negative current indicates the discharging condition and the positive current indicates the charging condition(regenerative braking)
from 3000 to 4000 sec, balancing is happening
- we can see those cell voltages are constant from 3000-4000 sec (balancing)
- in pack current plot, the current remains 0 from 3000-4000 sec (balancing)
from 4000 to 9000 sec, charging and balancing is happening
- we can observe a constant current of 30A initially indicating constant current charging mode and the voltages are increasing.
- once the voltages reach their preset values, constant voltage charging mode kicks in, and the current drops to 0.
- then balancing is happening.
from 9000 to simulation end time, post-charge balancing is happening
- the cell voltages are balancing
- the pack current is constantly 0, indicating no charging/discharging.
cell temperatures and BMS state
- from 0-3000 sec(driving), the temperature of the cells raises gradually and in BMS state, we can observe a constant line indicating driving
- from 3000-4000(balancing), the temperature of the cells seems to have a little drop and be constant for one or two cells. and BMS state shows standby
- from 4000-9000(charging and balancing), the temperature of the cells increases in CC mode and then drops down gradually in CV mode. the BMS state shows charging
- after 9000 sec, the temperature of cells are dropping and the BMS state shows standby
- the difference between the maximum and minimum temperature is monitored and if it goes beyond the critical value, then the capacity of cells or battery packs will be compromised
SOC
- we can observe three plots, yellow(coulomb counting), and blue and red(unscented Kalman filter & extended Kalman filter)
- the plot of UKF, EKF are more accurate than the coulomb counting.
- from 0-3000(driving), the soc seems to drop indicating discharging with a little regenerative charging according to the drive cycle, when the pack current seems to be in positive.
- from 3000-4000(balancing), soc remains constant
- from 4000-9000(charging and balancing), soc seems to increase linearly in constant current charging and increase exponentially, slowly in constant voltage charging.
- from 9000 sec, soc seems to be constant.
- by UKF, EKF plots we can say that the battery packs SOC is 94%
Balancing
- from 0-3000(driving), the balancing will not occur and so we can observe the plots remain at 0
- from 3000-4000(balancing), cell 6(higher voltage) seems to be at 1, and cell 1(lower voltage) seems to be at 0, indicating the balancing has been started.
- then the charging and balancing step occurs.
- at the end of the simulation, we can observe that all cells are trying to balance.
case 2:
- selecting 2 in test sequence variant
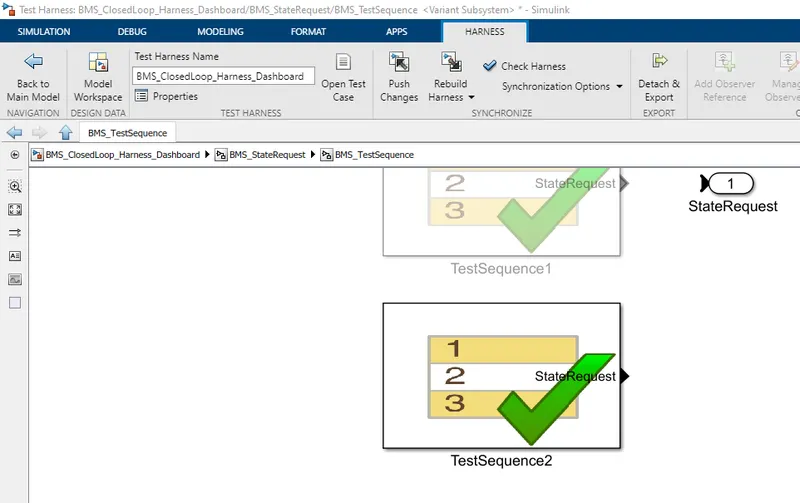
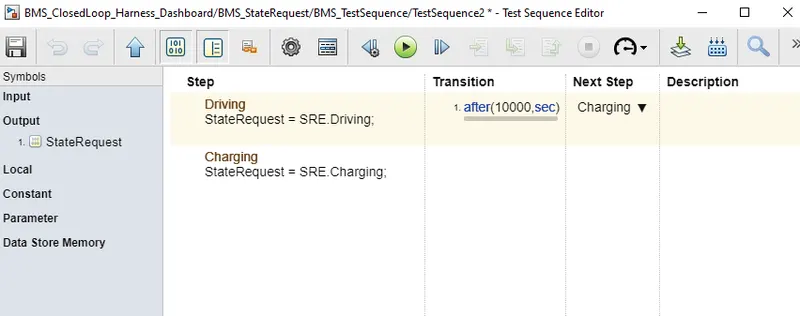
- in TestSequence2 we have state request for driving-charging.
- The first step is driving for 10000 sec
- the next step charging for the rest of the simulation.
after running the simulation,
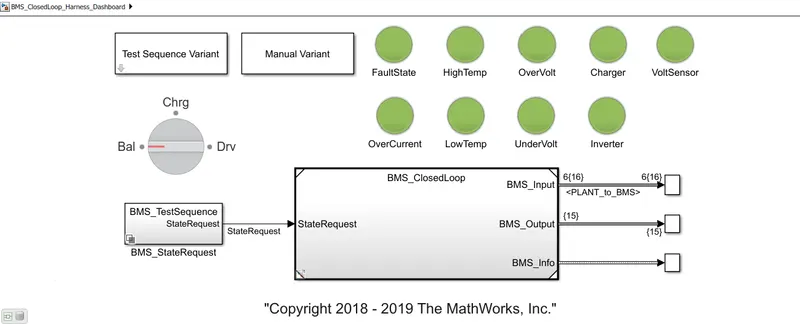
- all lamp blocks are green indicating that all the logic conditions are correct or satisfied.
scope result
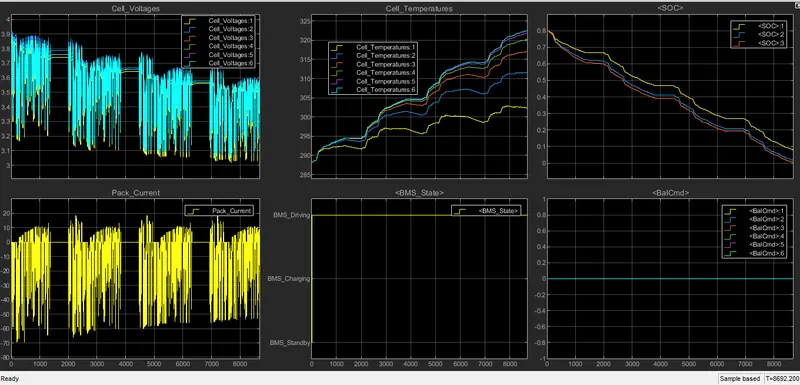
- only the driving step is implemented
- the simulation ran for only 8692.2 sec since the SOC reached 0. that is the battery is completely discharged.
cell voltages
- we can see the voltages of 6 cells varying between 3.9V -3.1V
- the cell voltage 2 is observed as maximum, while the cell voltage 1 is minimum
- we can observe straight lines between the variations indicating the standby in the driving cycle.
pack current
- the maximum current discharge is 70A.
- the negative current indicates the discharging condition and the positive current indicates the charging condition(regenerative braking)
- the current is 0 when standby
cell temperature
- we can only see the cell temperatures raising because of driving mode, discharging condition of the battery.
- there has been little drop with the variations of temperatures according to the driving cycle.
- the maximum cell temperature is 6 and the minimum is 1.
BMS state
- only driving mode is implemented which is observed in the plot
SOC
- the battery pack gets discharged from 80% to 0% within 8692.2 sec
- the variations in the plot are due to the driving cycle pattern either standby or deceleration pattern.
Balancing
- As there is no balancing logic is implemented, we can see that the plot remains 0.
case 3:
- selecting 3 in test sequence variant
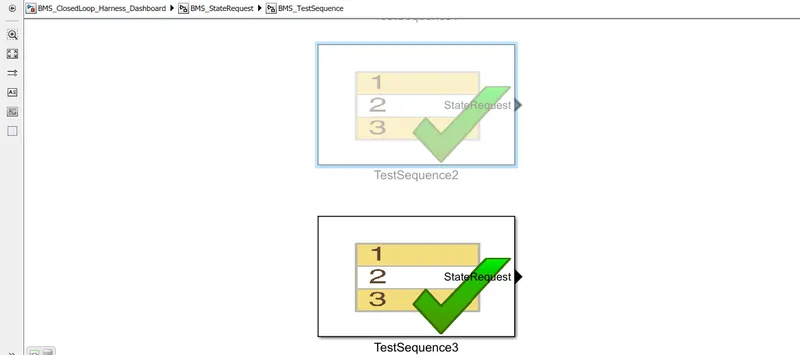
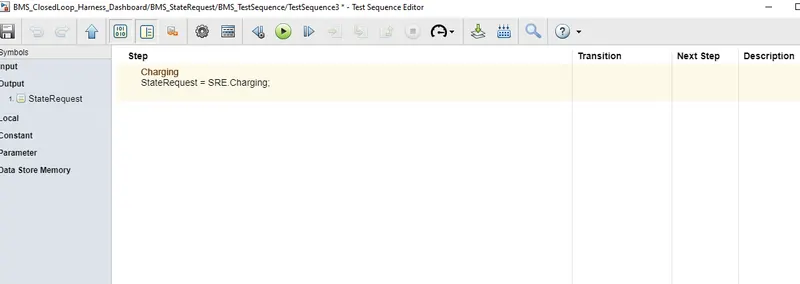
- only charging is happening the entire simulation
after running the simulation
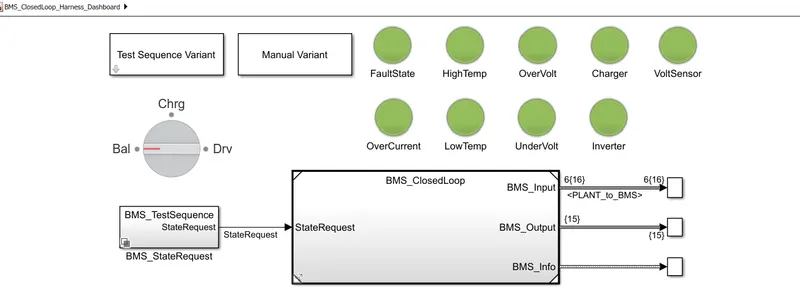
- all lamp blocks are green indicating that all the logic conditions are correct or satisfied.
scope result
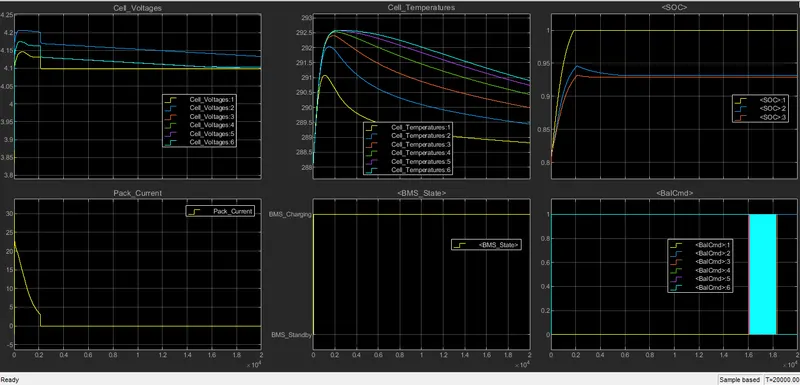
cell voltages
- the cells have been charging from the battery pack of 80% soc.
- so the voltages are reaching to their maximum in constant voltage mode and then dropping gradually to the minimum cell voltage
pack current
- as the battery pack is charging from 80%, we can see an initial rise and drop to 0A at 2000 sec
cell temperatures
- until the cells of the battery back are fully charged, their temperatures rise and then gradually drop.
BMS state
- only charging step is implemented and observed in the scope
SOC
- the battery pack is charged from 80% to 100% in almost 2000 sec
- by UKF, EKF plots we can say that the battery packs SOC is 93% (fully charged battery)
All the 3 test cases from the harness dashboard have been simulated and a detailed report has been given.
2. What is coulomb counting? Refer to the above model and explain how BMS implements coulomb counting for SOC estimation?
Coulomb counting
The coulomb counting method is often used as a core technology for battery SOC estimation in BMS. They express SOC as a ratio of available capacity to nominal capacity. the remaining capacity in the battery is calculated by measuring the current flow rate (charging/discharging) and integrating it over the time interval
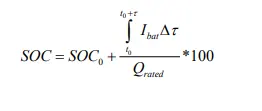
where SOC_0 = initial SOC, I_bat represents current across the battery, Q_rated = nominal capacity of the battery, Δ𝜏 = time interval
Coulomb counting characteristics,
- average precision
- simple to implement
- cumulative error
from the above model,
select SOC Estimation subsystem from BMS ECU
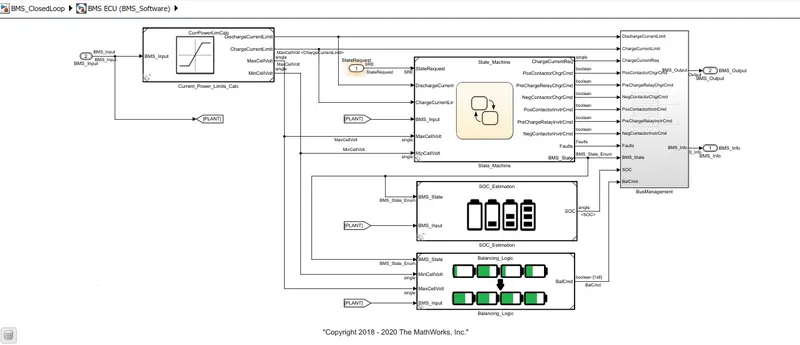
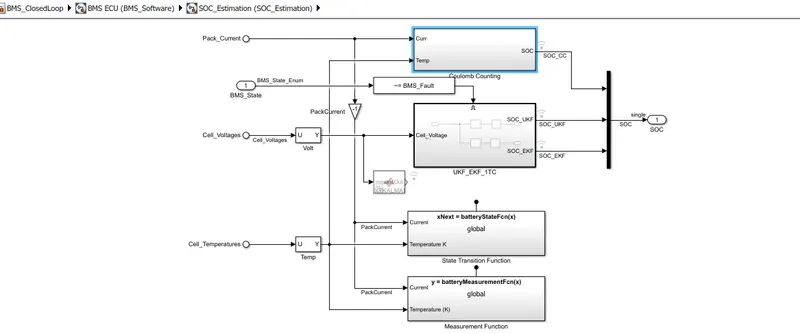
- The pack current and temperatures are given as the input to the coulomb counting block and SOC is estimated.
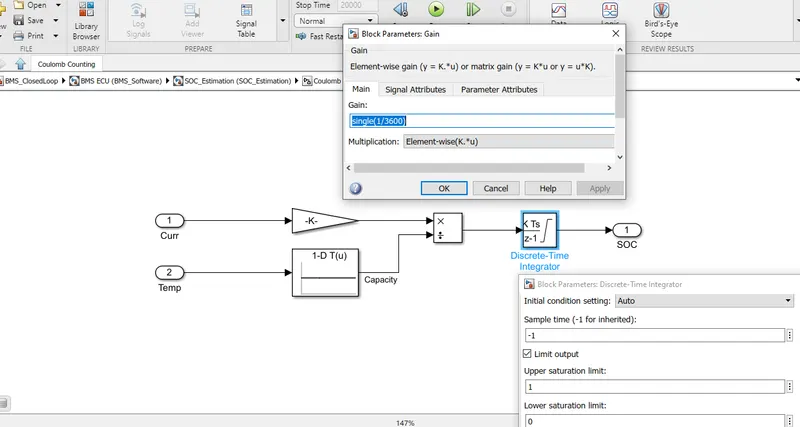
- the pack current is multiplied with the gain block (1/3600) which converts into Ahr
- the temperatures with the lookup table are divided with the values from the gain block and then integrated to estimate the SOC.
- the SOC estimation through Coulomb counting is not accurate, but only an average precision.