Solving second order ODEs
Aim: To solve 2nd order ODE | simple pendulum | and creating animation.
MAIN PROGRAM:
close all
clear all
clc

%inputs
l=1; %meter
m=1; %kilogram
b=0.05;
g=9.81; %m/s^2

%initial_cond
theta_0=[0;3];  %  0=ang_displacement | 3=ang_velocity (initial)

%time_array
t_span=linspace(0,20,500);  % 0-20 sec; 500 vales in between

%ode solve
[t, results]= ode45(@(t,theta) ode_func_challenge(t,theta,l,m,b,g),t_span,theta_0);

%plot
figure(1);
plot(t,results(:,1),'color','r');     %time | ang_displacement
hold on;
plot(t,results(:,2),'color','b');     %time | ang_velocity
xlabel('time');
ylabel('plot');
legend('ang_disp','ang_vel');

%inputs for loop
j=results(:,1);
ct=1;

for i = 1:length(j)
    THETA=j(i);
    x0=0;
    y0=0;
    x1=l*sin(THETA);            % (opposite side) sin(theta) along x axis
    y1=-l*cos(THETA);           % (adjacent side) cos(theta) along -y axis
    %plot
    figure(2);
    plot([-1,1],[0,0],'linewidth',3,'color','b');   %plot (line) in pendulam diagram
    text(-0.5,0.5,'simple pendulum animation');
    text(1.1,0,'support');
    hold on;
    plot([x0,x1],[y0,y1],'linewidth',1,'color','k');   %plot the length of string from (x0,y0) to (x1,y1)
    text(0.3,-0.3,'string');
    hold on;
    plot(x1,y1,'o','markersize',20,'markerfacecolor','r'); % plot for creating sphere
    text(-0.3,-1.3,'ball');
    hold off;
    axis([-2 2 -3 1]);          % for easy and convinent view of the plots
    pause(0.03);                % pausing duration
    M(ct)=getframe(gcf);        % get current frame and stored in M(ct)
    ct=ct+1;

end
movie(M);                       %movie creating
videofile=VideoWriter('simple_pendulum_ode_challenge.avi','uncompressed AVI');
open(videofile);
writeVideo(videofile,M);
close(videofile);
FUNCTION PROGRAM:
%ode_func_challenge program

function [dtheta_dt] = ode_func_challenge(t,theta,l,m,b,g)

theta1 = theta(1);
theta2 = theta(2);
dtheta1_dt = theta2;
dtheta2_dt = -(b/m)*theta2-(g/l)*sin(theta1);
dtheta_dt = [dtheta1_dt;dtheta2_dt];

end
OUTPUT PLOT:
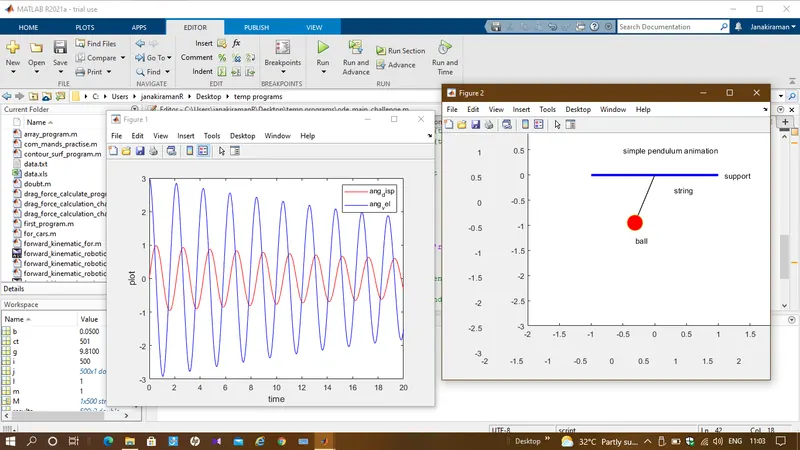
EXPLANATION:
Function program
d^2theta/dt^2 + b/m*dtheta/dt +g/l*sintheta = 0 [second order ODE]
we need to break into 1 st order ODE:
theta = theta1;
then dtheta/dt = dtheta1/dt = theta2 ------------1
d^2theta1/dt^2 = d/dt*(dtheta1/dt) = d/dt*(theta2)
rewriting theta with theta1: d^2theta1/dt^2 + b/m*dtheta1/dt + g/l*sintheta1 = 0
d/dt*(dtheta1/dt) + b/m*theta2 + g/l*sintheta1 = 0
d/dt(theta2) + b/m*theta2 + g/l*sintheta1 = 0 (multiple 1st order ODE)
dtheta2/dt = -b/m*theta2 - (g/l)*sintheta1 -------2
d/dt[theta1 ; theta2] = [theta2 ; -b/m*theta2-g/l*sin(theta1)]
dtheta/dt = [dhteta1/dt ; dtheta2/dt]
function [dtheta_dt] = ode_func_challenge(t,theta,l,m,b,g) % function_name(arguments)
MAIN PROGRAM:
%inputs
b=0.05; damping coefficient
g=9.81; gravitational force
l=1; length of string
m=1; mass
theta_0=[0;3]; initial condition for angular displacement | angular velocity
t_span = linspace(0,20,500); time array for t_span ie) from 0 - 20 sec, 500 values
%ODE solve
[t,results]=ode45(@(t,theta) ode_func(t,theta,b,g,l,m), t_span,theta_0); t=time | results= both angular displacement and velocity
syntax: ode45(@(time and theta values of which is to be calculated) function_name(arguments),time_array,initial_condition at time(0)
figure(1) figure 1 is created
plot(t,results(:,1)) ploting time vs results of every row in 1st column ie time vs ang_displacement
hold on holding the figure(1)
plot(t,results(:,2)) ploting time vs results of every row in 2nd column ie time vs ang_velocity
xlabel('time') xaxis- time
ylabel('plot') yaxis- plot
%inputs for loop
j=results(:,1); results(:,1) is assigned in j
ct=1; inital counter
for i = 1:length(j) loop starts from 1 to end value of ang_displacement of result ie 1 st column
THETA=j(i); j(i)=is assigned to THETA
x0=0; starting point
y0=0; starting point
x1=l*sin(THETA); (opposite side) sin(theta) along x axis (trignometry) ending pt
y1=-l*cos(THETA); (adjacent side) cos(theta) along -y axis ending pt
%plot
figure(2); figure 2 created
plot([-1,1],[0,0],'linewidth',3,'color','b'); the support rod in pendulam diagram blue color
text(-0.5,0.5,'simple pendulum animation'); title for the animation
text(1.1,0,'support'); support label using text command
hold on; for holding on the fig plot axis
plot([x0,x1],[y0,y1],'linewidth',1,'color','k'); the length of string from (x0,y0) to (x1,y1)
text(0.3,-0.3,'string'); for string label is animation
hold on;
plot(x1,y1,'o','markersize',20,'markerfacecolor','r'); for creating sphere at(x1,y1) with size of 20 and red color
text(-0.3,-1.3,'ball'); for ball label
hold off; if not given then the string and ball will be visible in every frame
axis([-2 2 -3 1]); for easy and convinent view of the plots
pause(0.03); pausing duration
M(ct)=getframe(gcf); get current frame and stored in M(ct)
ct=ct+1; ct getting incrementing untill loop ends (1 to result(:,1))
end
movie(M); movie creating
videofile=VideoWriter('simple_pendulum_ode_challenge.avi','uncompressed AVI'); creating videofile by giving name and the format
open(videofile); opening the file
writeVideo(videofile,M); writing the movie in the file
close(videofile); closing the file
https://www.youtube.com/watch?v=ADIIZeYRz6E