Week 7 State of charge estimation
THE BMS MODEL :
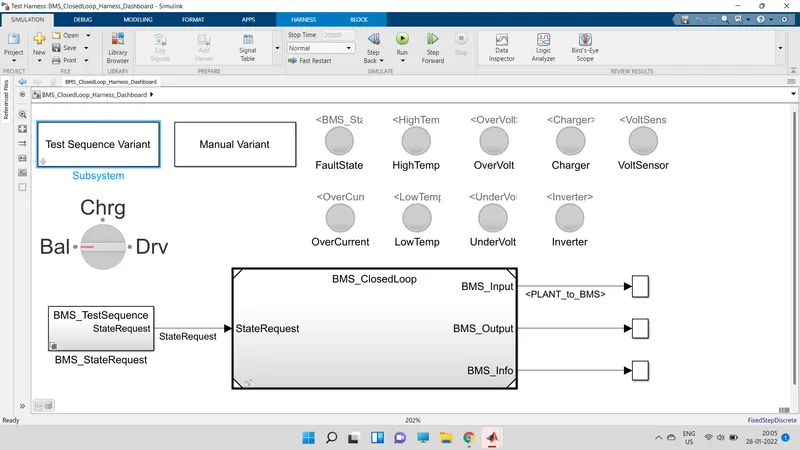
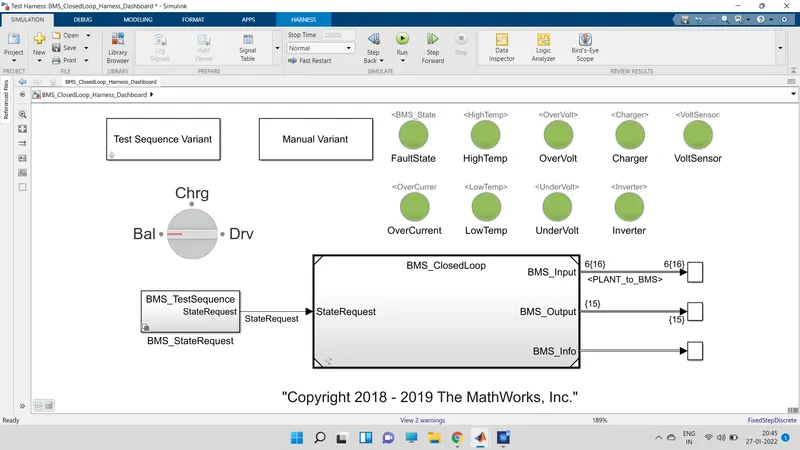
This model tells us the how BMS model of battery pack works .
The block mainly consists of closed loop BMS block .
BMS state request block.
Test sequence variant for diffrent test sequences.
lamps for diffrent states faults identification.
If the indicator glows green there is no fault condtion , if it glows red there is a fault it indicates.
There are fault checking conditions like high temperature,over voltage ,charegr ,over current ,low temperature,etc
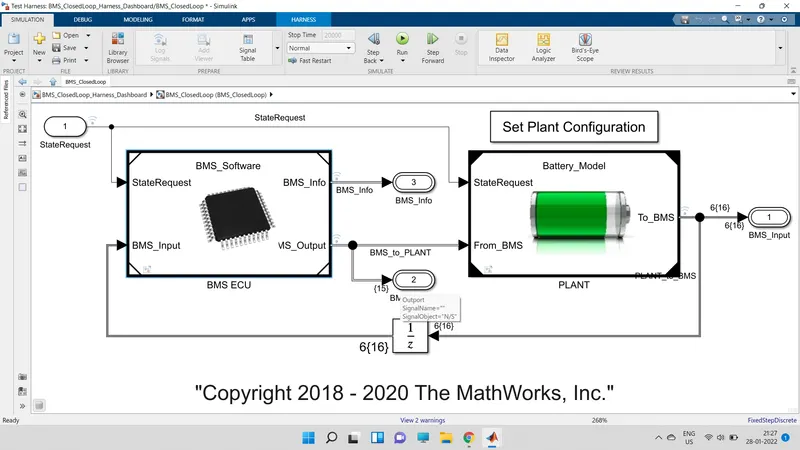
The below model is the closed loop of BMS model :
It consists of BMS ECU and plant units .
These blocks further consists of subsytem blocks for measurements and all.
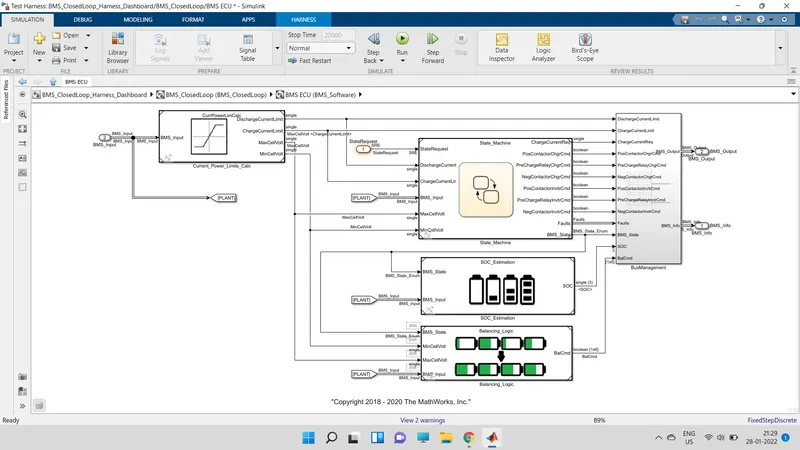
The model for BMS electronic controll circuit:
It has the state machine ,soc estimation ,cell balancing ckts .
The state machine implements the charge , controll and voltages , currents data and all in the state transitions conditions.
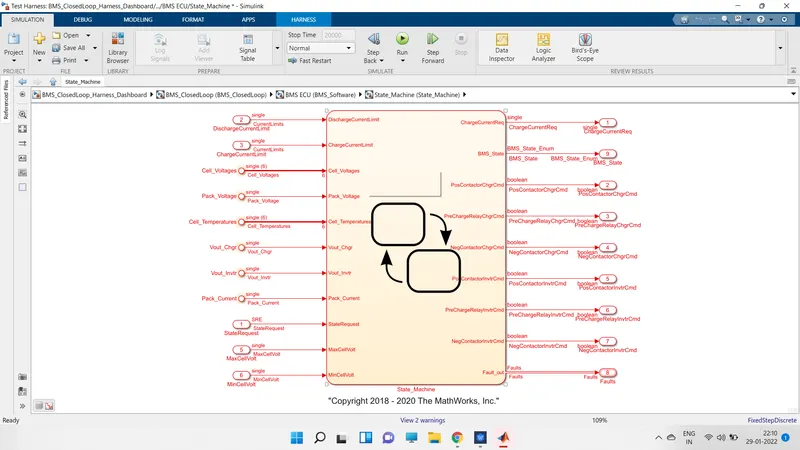
The below model represents the state machine :
It takes care about the currents , charging ,loads ,temperature transitions to turn on or off the contactors and all.
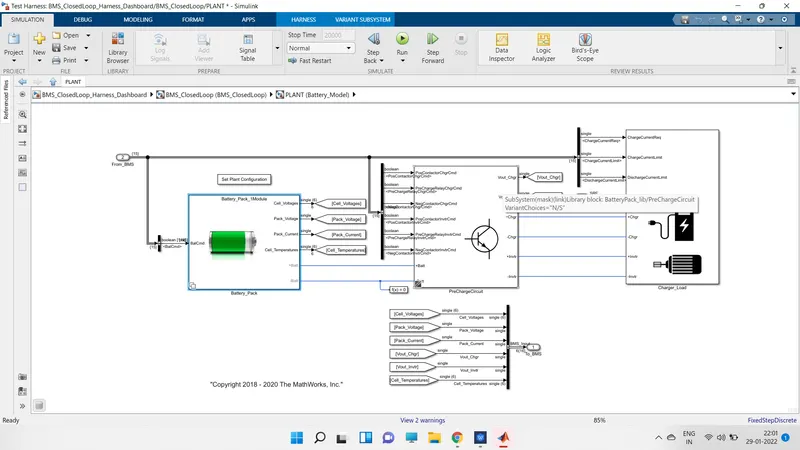
The model for plant of the BMS :
The model has the batery pack , charging circuit ,load circuit Diffrent scope tags for plots.
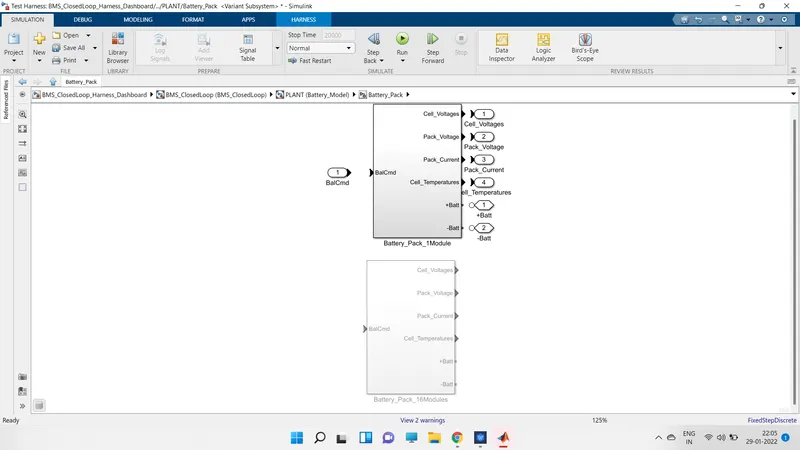
Inside the battrey pack we have the diffrent modules it has 2 module which are shown below.
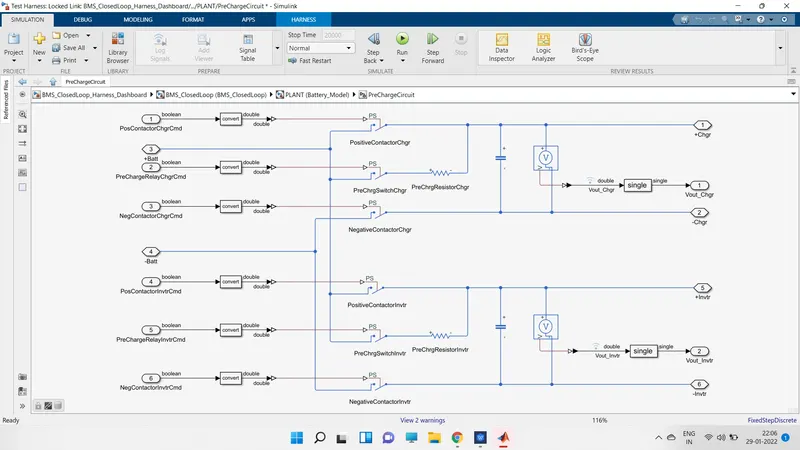
And a precharger ckt for protectio during charginng .given below.
The model is going to run for for three test conditions ie,
1.Balancing or standby
2.charging
driving
For the 1st test condtion :
Go to the test sequence variant and set the sequence as 1
Run the simulation for the set time then the display shows like below
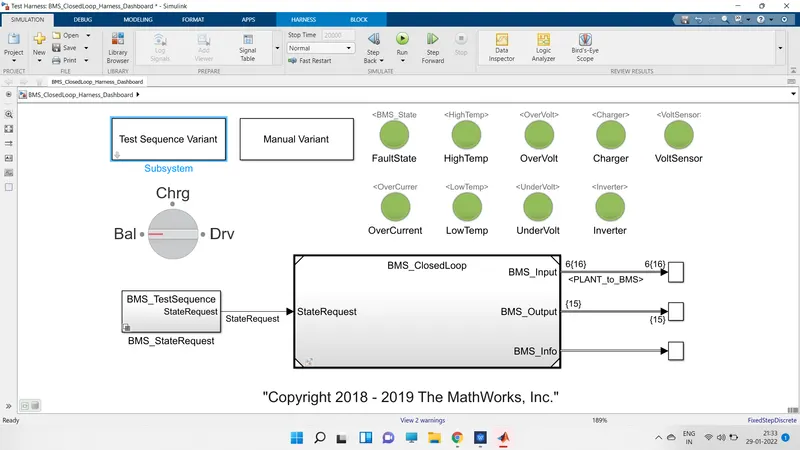
That means all lamps glows green so there is no fault condition.
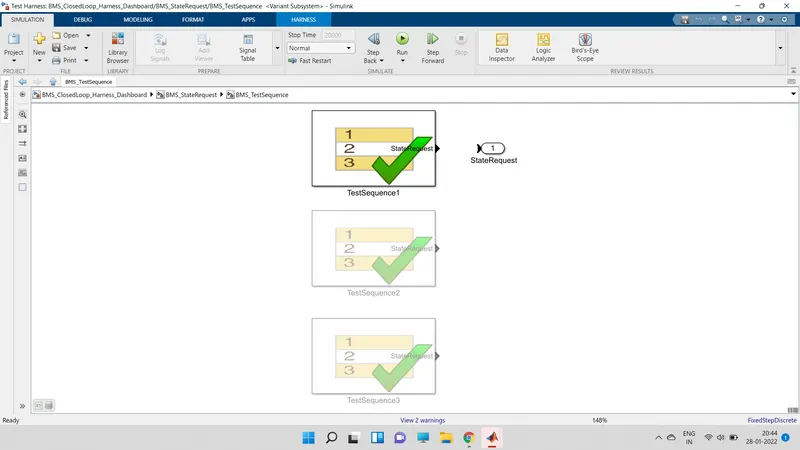
Go to the BMS state request to check the which sequence is applied .
We can that the test sequence 1 is sucessfully done inthe below image.
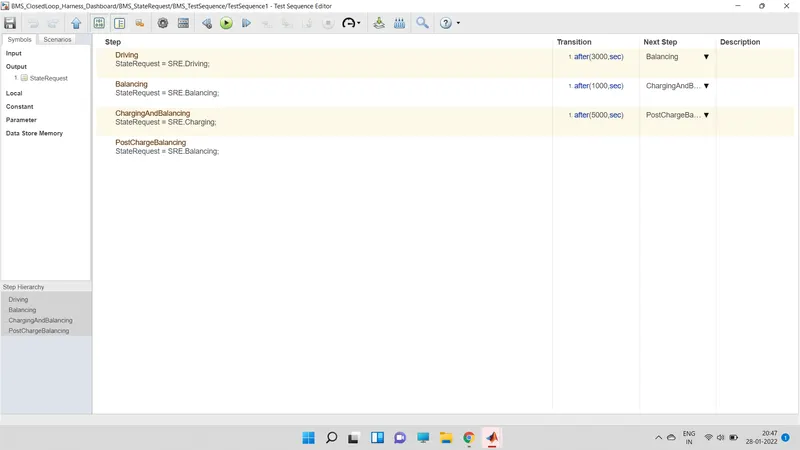
When we click on the test case 1 it shows the below image
The image shows the diffrent states attained by the BMS for particular time.
The states are driving , balancing ,charging .
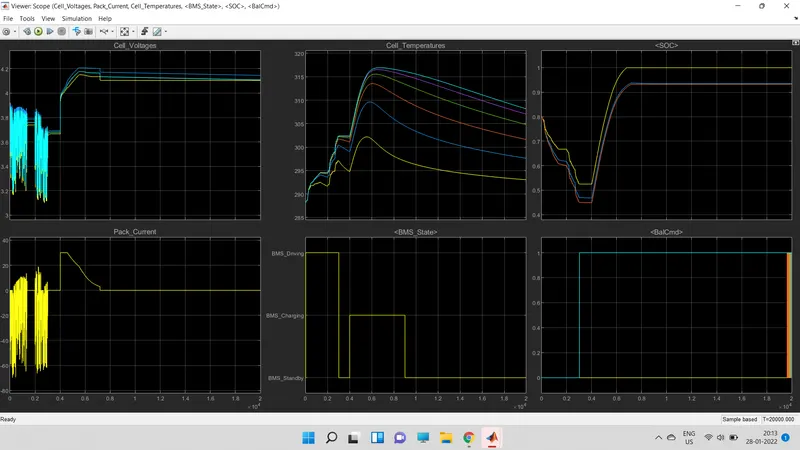
This is the plot for the test case 1 :
The scope plots the diffrent parameters like cell voltage ,cell temperature and SOC ,
And peak current , bms state.
INtially the bms is under cell balancing condition , so the voltage and currents of cells are fluctuatinng .
After some time like 0.4 *10^4 sec the bms chages to charging state so the battrey charges under CCCV mode.
After some time it reaches to the standby condtion.
The cell temperature is also raises unthe driving state and setteled and drops in the charging state.
The soc of the cells are droped during driving state and incresed in the charge state and setteled in the standby state .
The harness dashboard after test case 2:
There is no faulty conditons in any states of the BMS is showing .
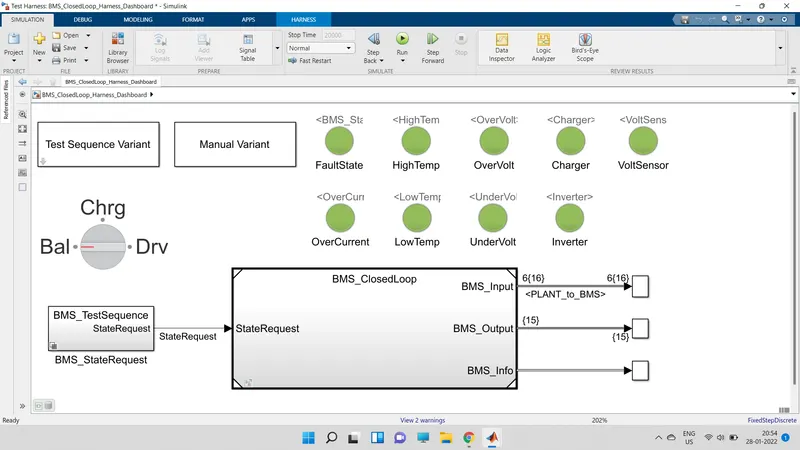
Go to the BMS state request to check the which sequence is applied .
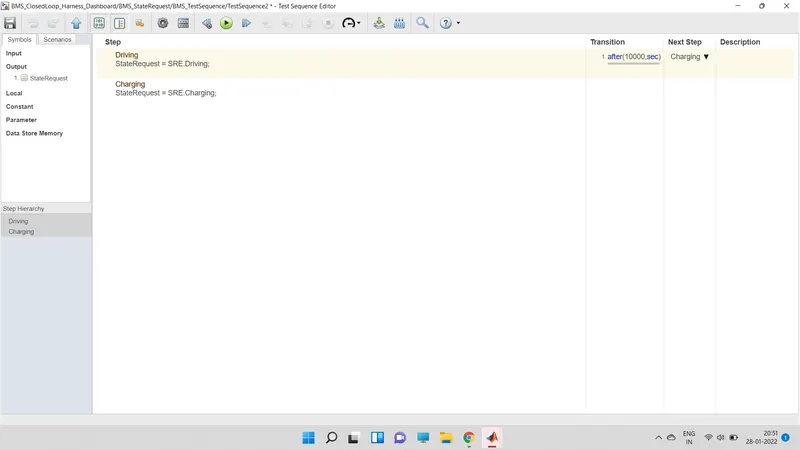
We can that the test sequence 2 is sucessfully done inthe below image.
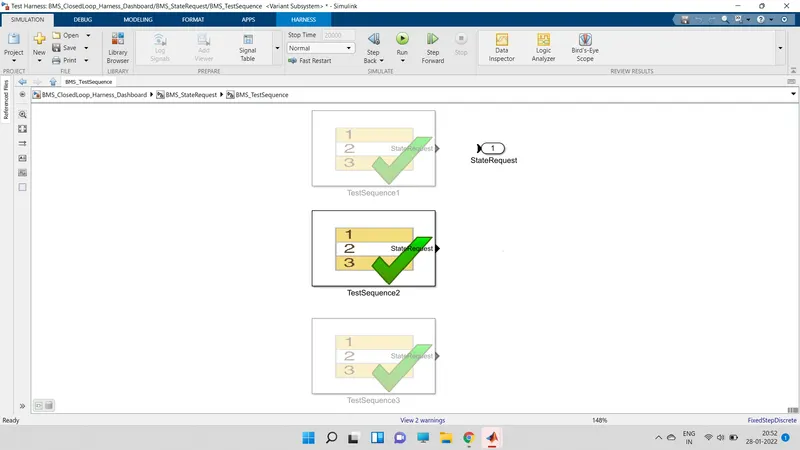
When we click on the test case 2 it shows the below image :
The image shows the diffrent states attained by the BMS for particular time.
The states are driving ,charging .
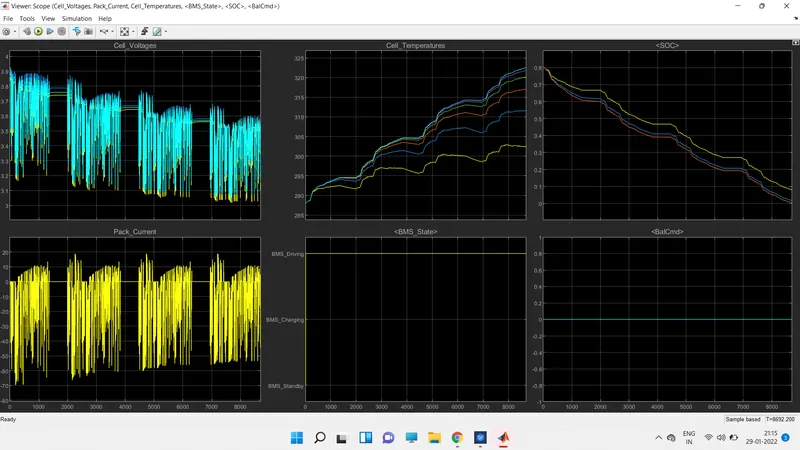
This is the plot for the test case 2 :
The scope plots the diffrent parameters like cell voltage ,cell temperature and SOC ,
And peak current , bms state.
In this test case the bms is mostly under driving condtion only, so the voltage and currents of cells are fluctuatinng .
The SOC is droped to 0% from 80% of diffrent cells , the SOC is 0 s simulation set for 8000sec only.
The temperature is raises to 290 to 320k of diffrent cells in the pack.
The harness dashboard after test case 3:
There is no faulty conditons in any states of the BMS is showing .
Go to the BMS state request to check the which sequence is applied .
We can that the test sequence 3 is sucessfully done inthe below image.
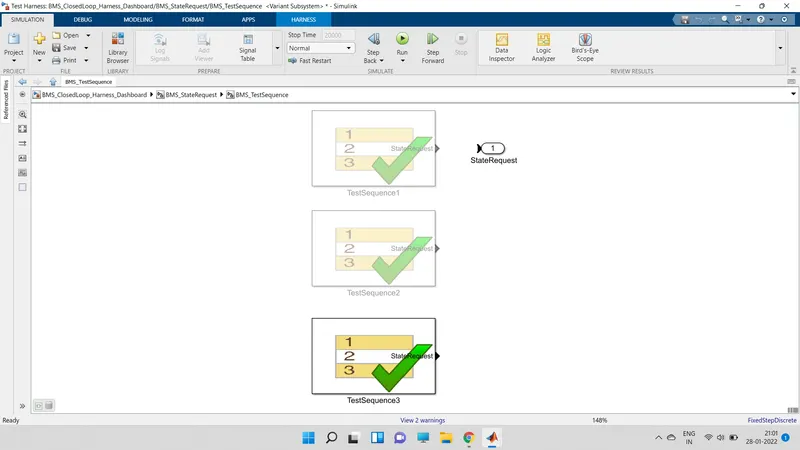
When we click on the test case 3 it shows the below image :
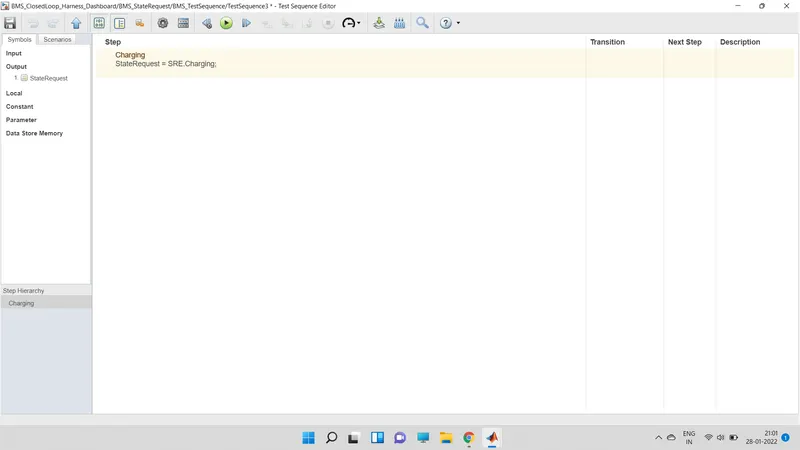
The image shows the diffrent states attained by the BMS for particular time.
The state for this test case is charging only.
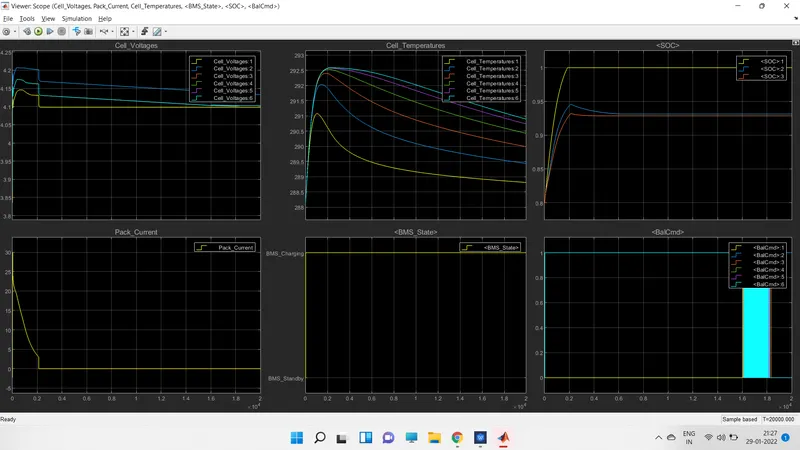
This is the plot for the test case 3 :
The scope plots the diffrent parameters like cell voltage ,cell temperature and SOC ,
And peak current , bms state.
In this test case the bms is mostly under charging condtion only, so the voltage of the cells are balanced due to charging .
The peak current drops to 0 after some time .
The SOC of different cells increse to like 100% ,94%,93% form 80%, The soc is maintained constant after some time ie, no discharging.
Due to the smooth charging the temperatures of diffrent cells also drops from high to low.
2.coulomb counting :
Coulomb counting is a technique used to calculate the State of Charge of a battery pack.
It works by integrating the active flowing current (measured in amps) over time to derive the total sum of energy entering or leaving the battery pack.
This produces a capacity that is typically measured in Amp-hours.
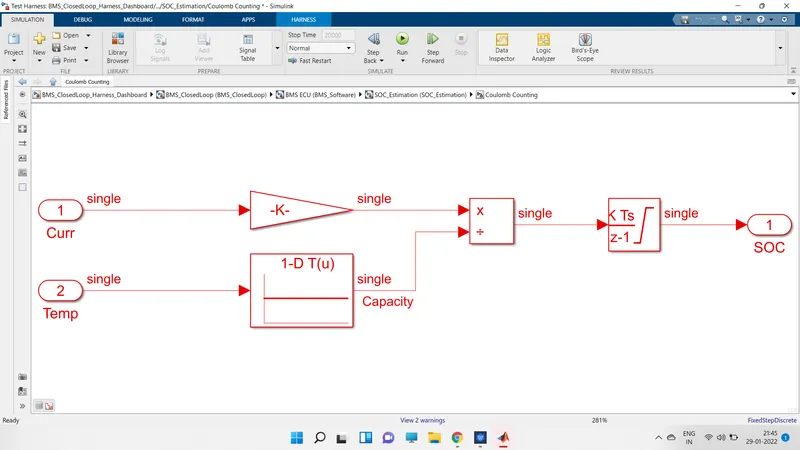
The below model is for columb counting which is designed in the bms model .
Coulomb counting is the simple method of soc calculation.
There are other methods like kalman filter to calculate the soc but it is complex.
The model look up table data and current and temperature data
And an mathematical block is used to make calculations.
After that an integrator used integrate over a period of time to calculate the SOC .