Week-4 Challenge WOT Condition Part-2
1.MAPPED MODEL :
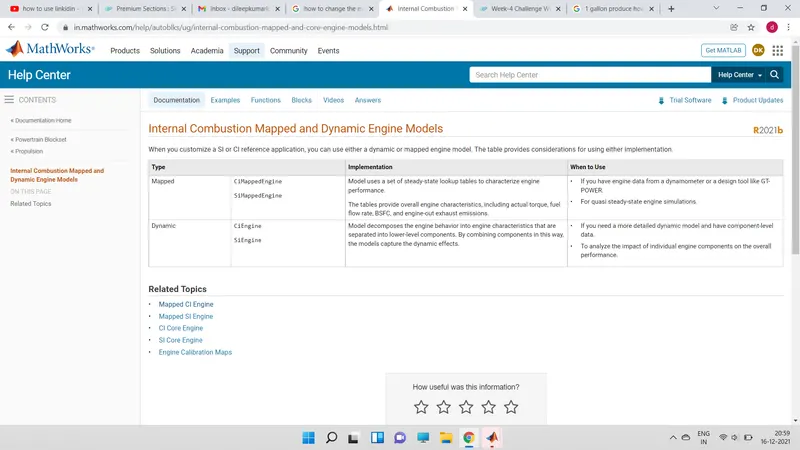
The mapped models is made with the help of lookup tables .
These lookup table consists of the data of device parameters .
Lookup table blocks use arrays of data to map input values to output values, approximating mathematical functions.
The following figs are 1D and 2D lookup tables
The models take less simulation time compared to dynamic model .


DYNAMIC MODEL:
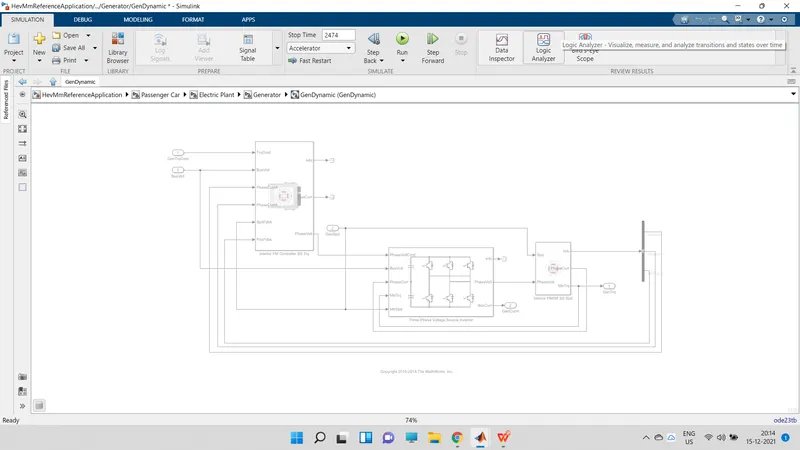
The dynamic model is reprsentation of actual components .
These models take more time for simulation.
These individual component parameters.
Diffrences of mapped and dynamic model :
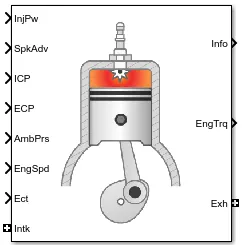
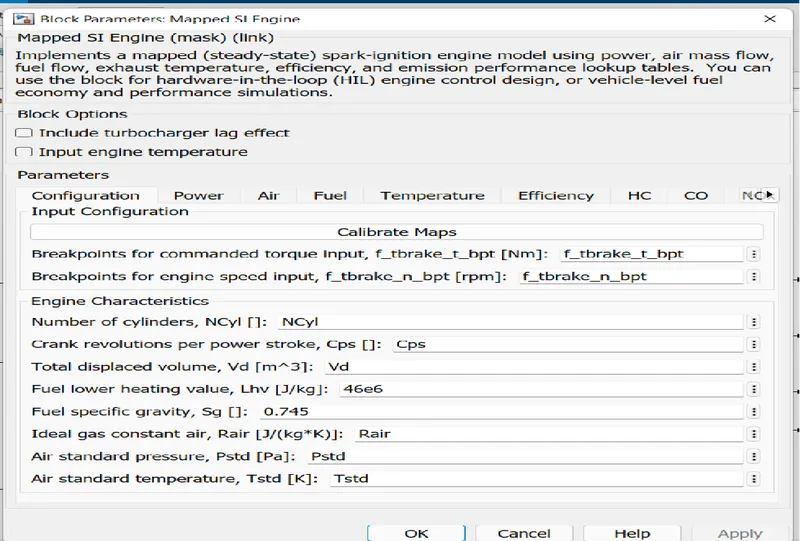
Mapped SI engine :
The Mapped SI Engine block implements a mapped spark-ignition (SI) engine model using power, air mass flow, fuel flow, exhaust temperature, efficiency, and emission performance lookup tables. 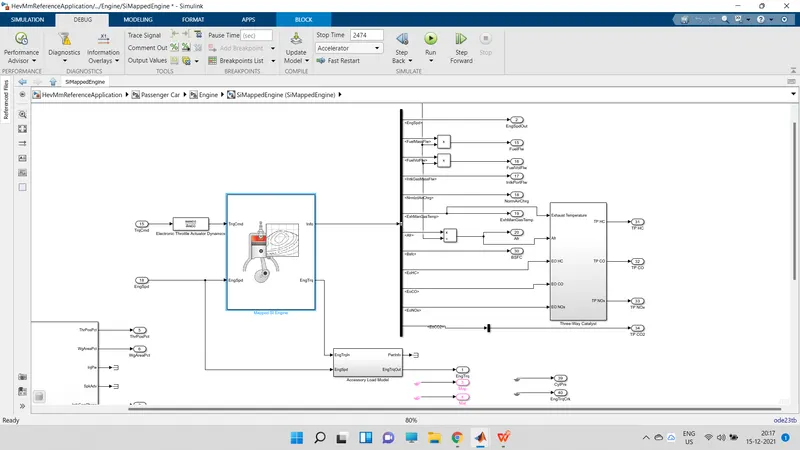
Dynamic SI engine :
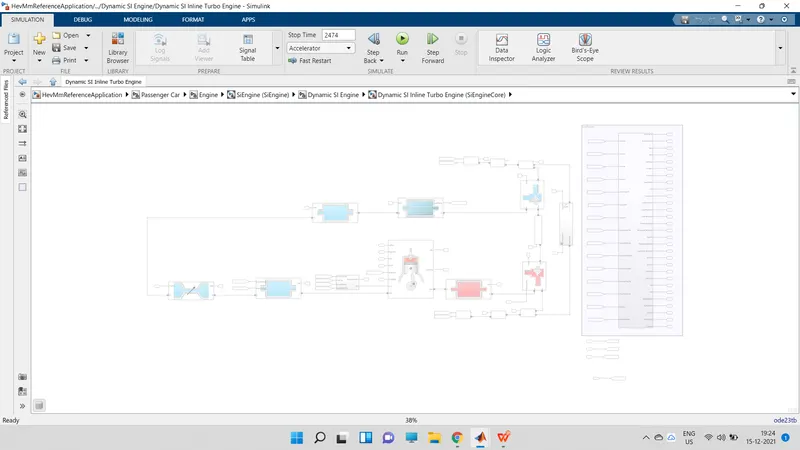
The SI Core Engine block implements a spark-ignition (SI) engine from intake to exhaust port. You can use the block in larger vehicle models, hardware-in-the-loop (HIL) engine control design, or vehicle-level fuel economy and performance simulations.
The SI Core Engine block calculates:
-
Brake torque
-
Fuel flow
-
Port gas mass flow, including exhaust gas recirculation (EGR)
-
Air-fuel ratio (AFR)
-
Exhaust temperature and exhaust mass flow rate
-
Engine-out (EO) exhaust emissions
mapped motor :
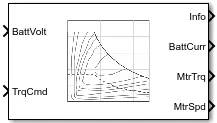
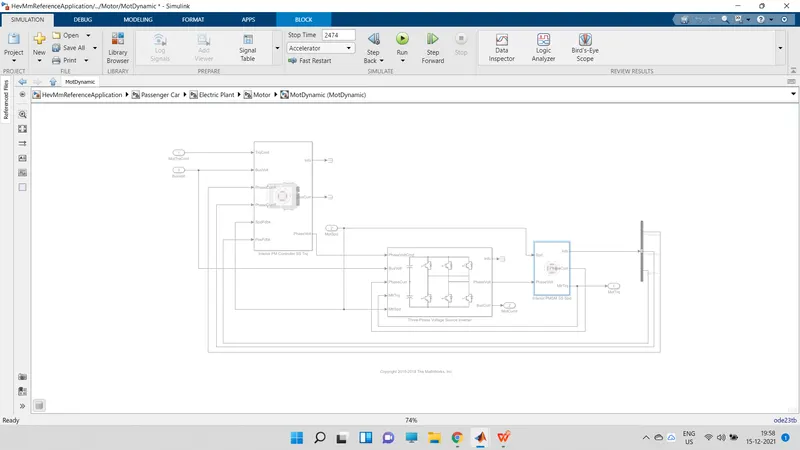
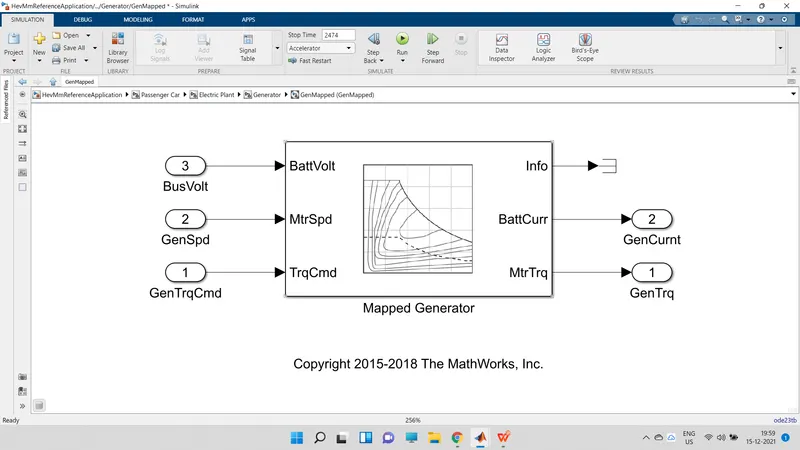
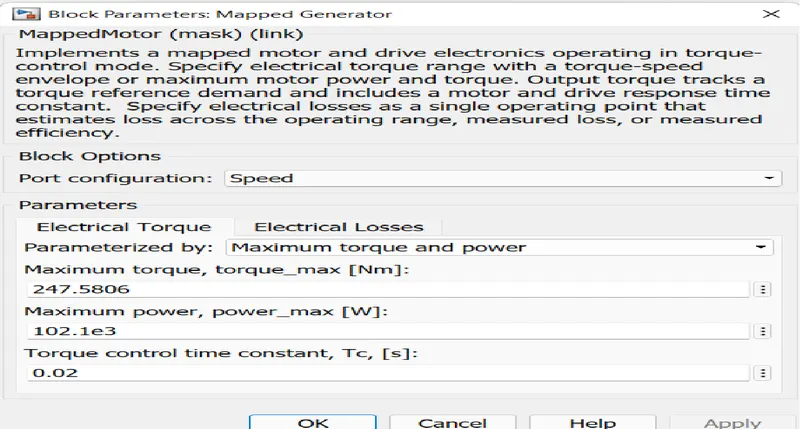
The Mapped Motor block implements a mapped motor and drive electronics operating in torque-control mode. The output torque tracks the torque reference demand and includes a motor-response and drive-response time constant. Use the block for fast system-level simulations when you do not know detailed motor parameters, for example, for motor power and torque tradeoff studies. The block assumes that the speed fluctuations due to mechanical load do not affect the motor torque tracking.
You can specify:
-
Port configuration — Input torque or speed.
-
Electrical torque range — Torque speed envelope or maximum motor power and torque.
-
Electrical loss — Single operating point, measured efficiency, or measured loss. If you have Model-Based Calibration Toolbox™, you can virtually calibrate the measured loss tables.
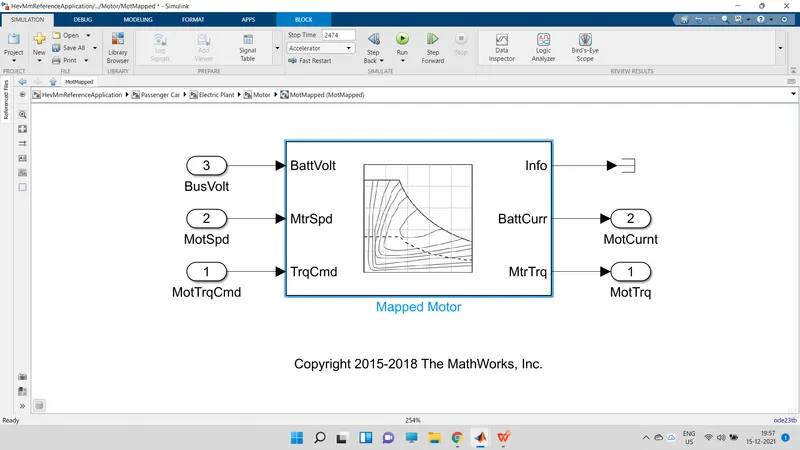
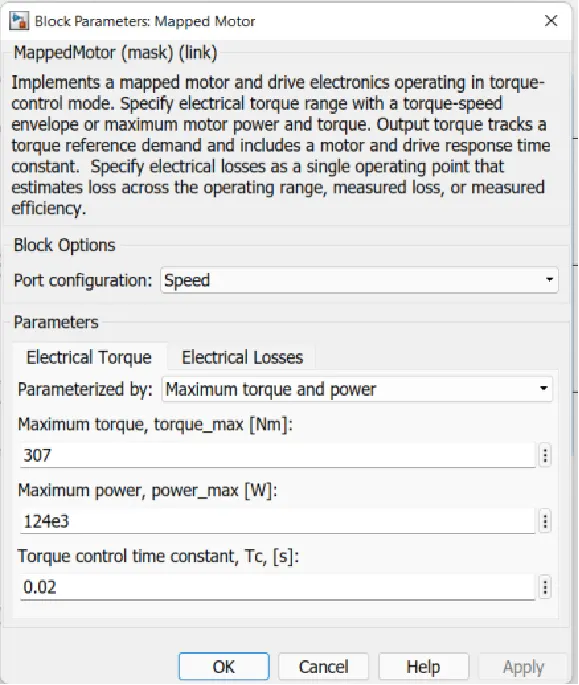
Mapped motor parameters :
Dynamic motor :
mapped generator :
mapped generator parameters :
Dynamic generator :
Converting mapped model to dynamic model or vice versa :
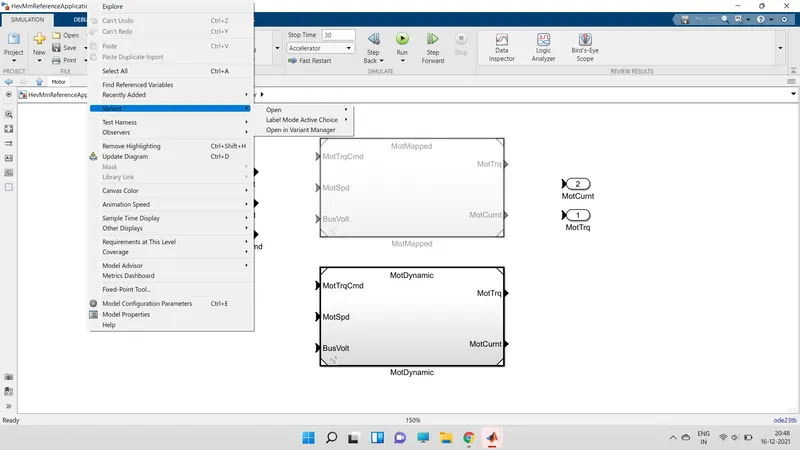
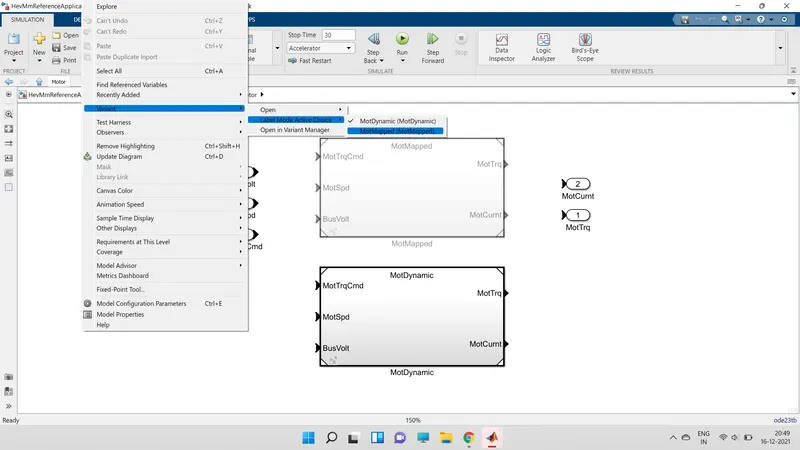
right click on the window where you need to modify .
The variant option provided in the list of options ,
Click on variant .
select label mode active choice.
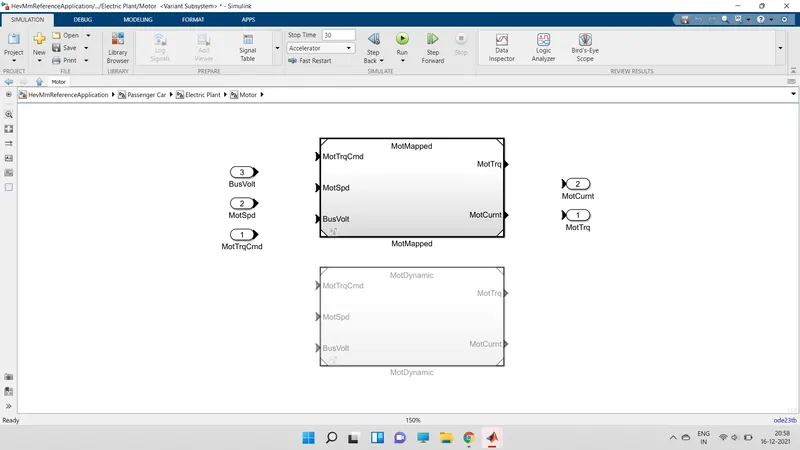
In that we can switch to mapped and dynamic models.
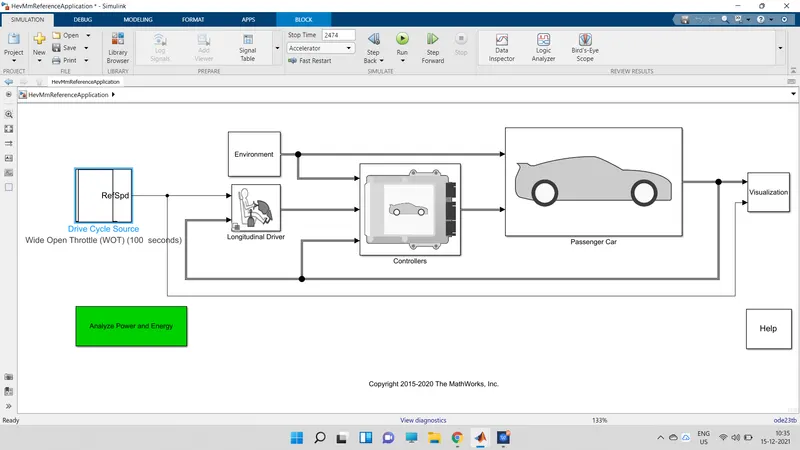
Once the model modified from one model to another it looks like 3rd fig.
2.calculation of miles per gallon :
Miles per gallon :
It is the distance measured in miles, that a car can travel per gallon of fuel .
If we consider the HEV vehicle model .
if we come from the o/p side by entering into the visualization block .
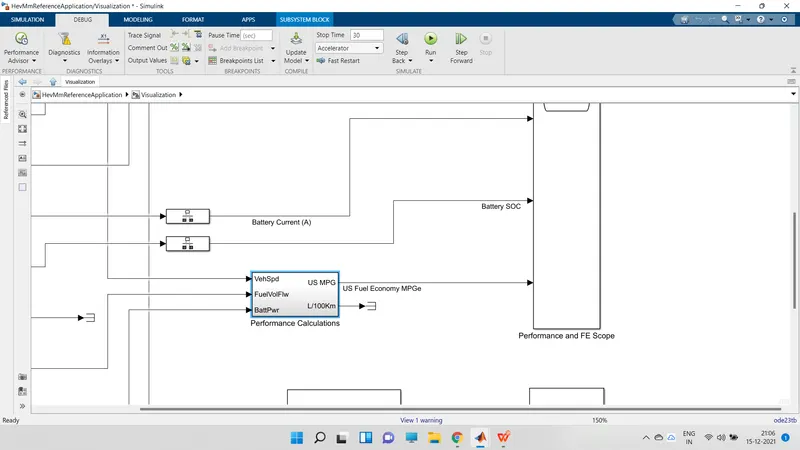
There is block provided for performance calculations if we enter into that block the below block will open.
From top right corner US MPG is calculated ie ,the vehicle distance ccovered to the sum of fuel and and baterry power.
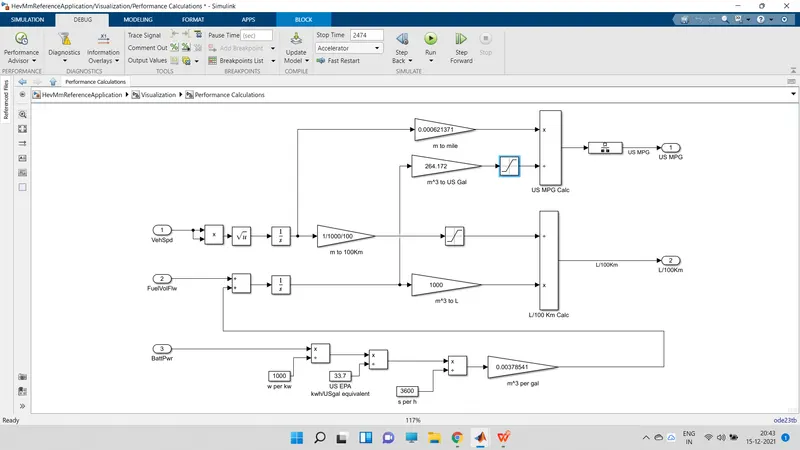
This is performance calculations block for seeing the the various parameters are calculated :
Factors are considered to model fuel flow :
From the formule we can observe that vehicle speed ,battery power ,and fuel volume flow.
Battery power :If the battery provides the more power to move the vehicle the the fuel required is less .as we seen in the HEV case with if more batery provides more power the miles per gallon will be more.
3.The default model hybrid electric vehicle reference model :
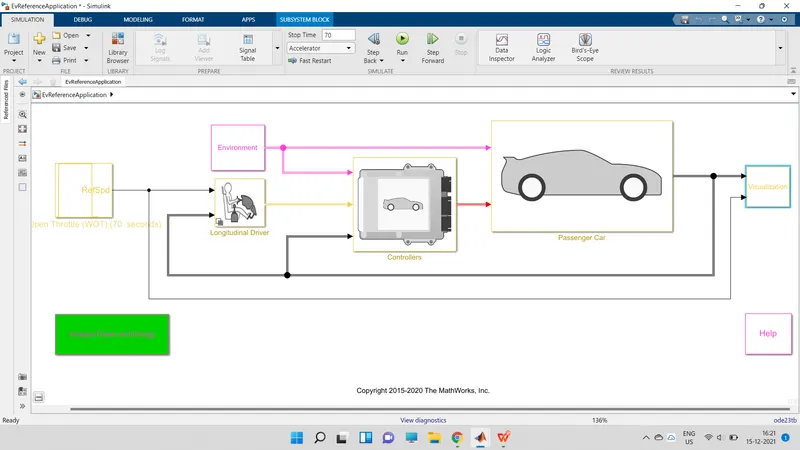
This model manly consists of diffrent blocks ie, driving cycle ,driver block ,controllers ,passenger car ,environment and visulization blocks ,these blocks further consists of no of mathamatical models ,mapped models , dynamic models.
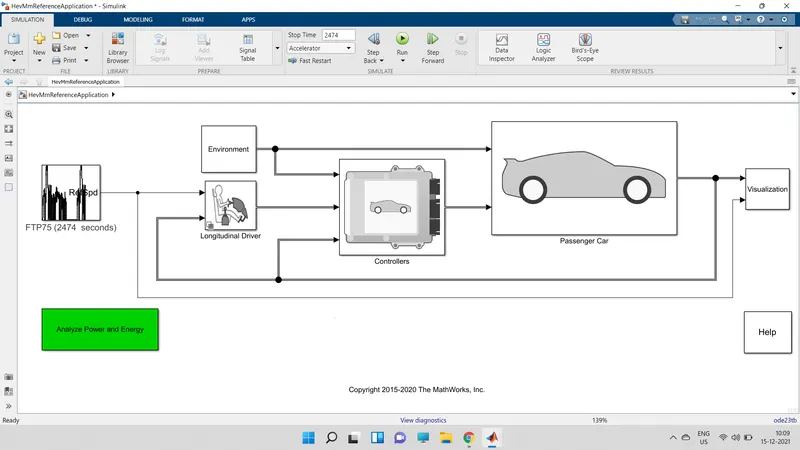
Wide open throttle cycle to the model:
The fig represents the drive cycle is fed with wide open throtle condtion .
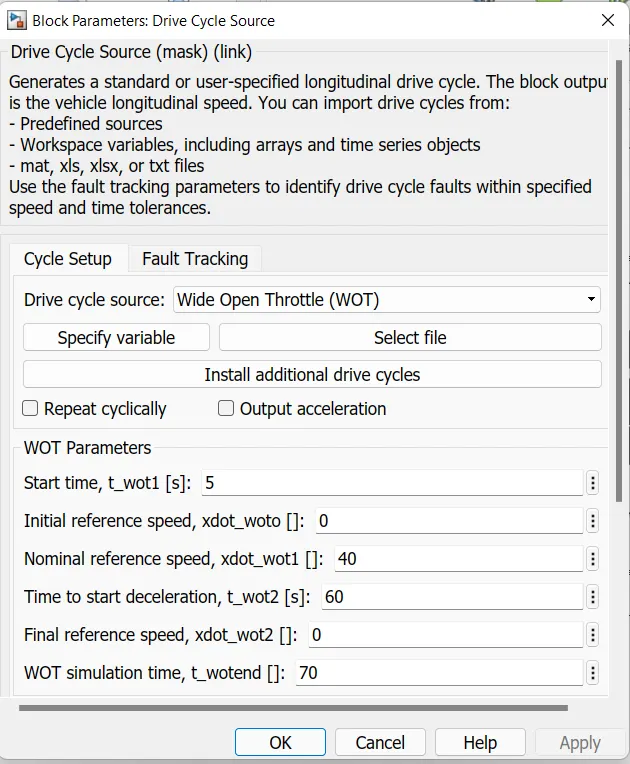
WOT given inside the drive cycle source :
Nominal reference speed is given as 40mph,
Time to start decelaration =60sec;
Time of simulation =70sec;
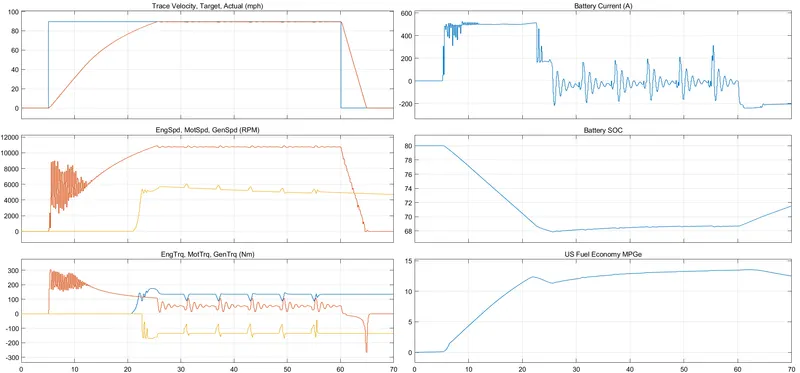
PERFORMANCE AND FE PLOT FOR WOT CONDTION :
PERFORMANCE AND FE PLOT FOR WOT CONDTION :
The plot consists of diffrent vehicle parameters like speed ,torque ,velocity ,SOC,Battery current ,us fuel economy.
By using trace section we can understood diffent changes and parameters of vehicle .
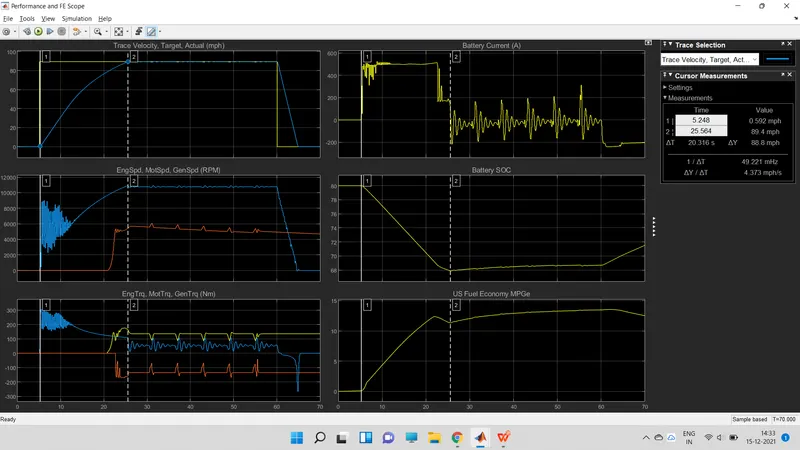
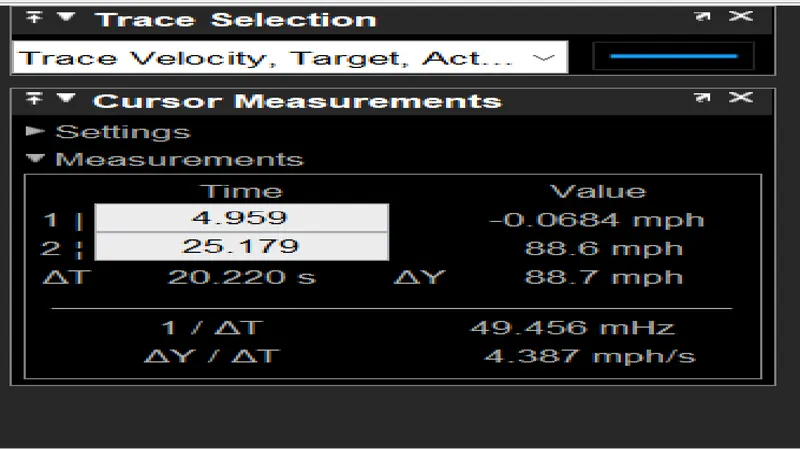
It takes around 20.3sec to reach the full speed ie,89mph.
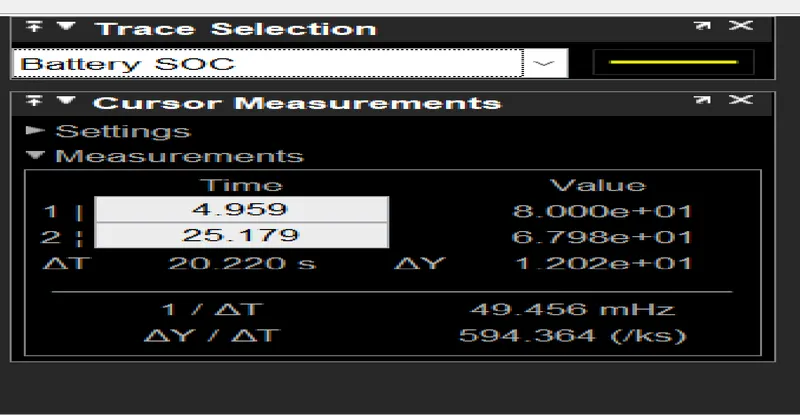
Intially the battery charge at 80%.it reduses to 67% to reach the full speed in a particular time .
ie, it uses 12% SOC to reach the top speed.
After the vehicle reaches to its top speed the soc it maintained constant .once the vehcle moves in decelarating region it chagers the battery .
The soc changes from 68 to 71 % ie, 2.7% soc incresed in decelaration .
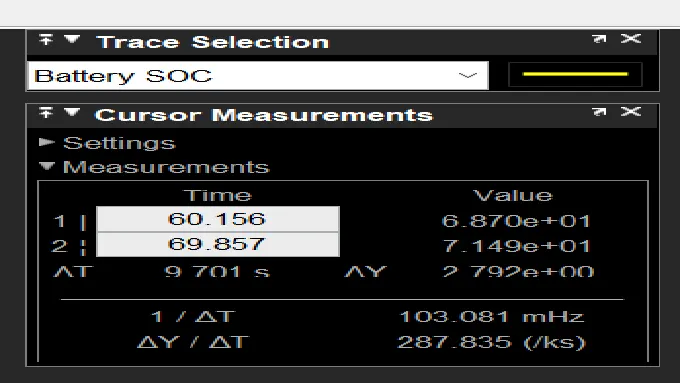
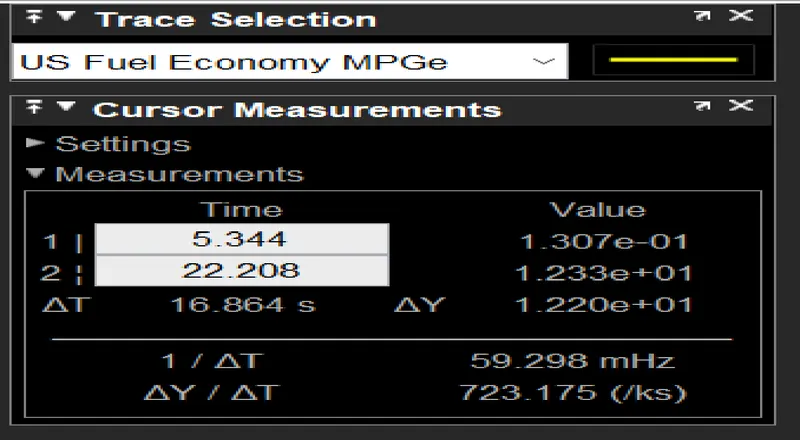
The fuel economy is increse to 12.2 MPG ,the motor runs the vehicle mostly .so it saves the usage of fuel.
WHEN GRADE AND WIND VELOCITY CONSIDERED THE VEHICLE PARAMETERS :
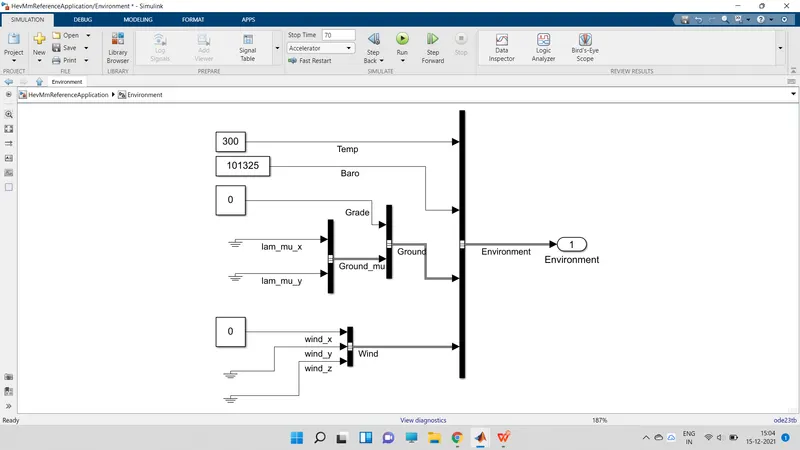
The model inside the environment block :
This block is used to change the parameters like grade angle , wind velocity temp and some parametes are maintanied as constant.
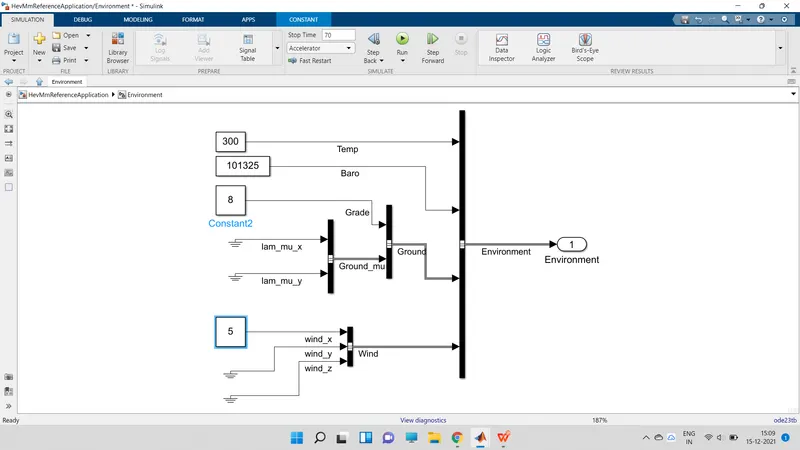
Model when grade and wind velocity are modified :
When grade is given with 8% and wind velocity is given as 5mph.
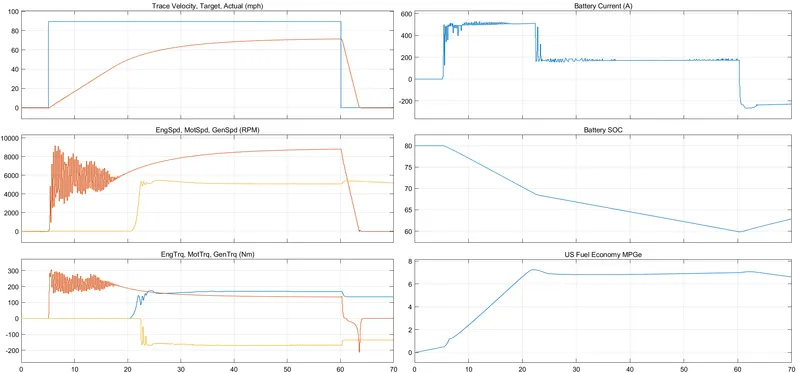
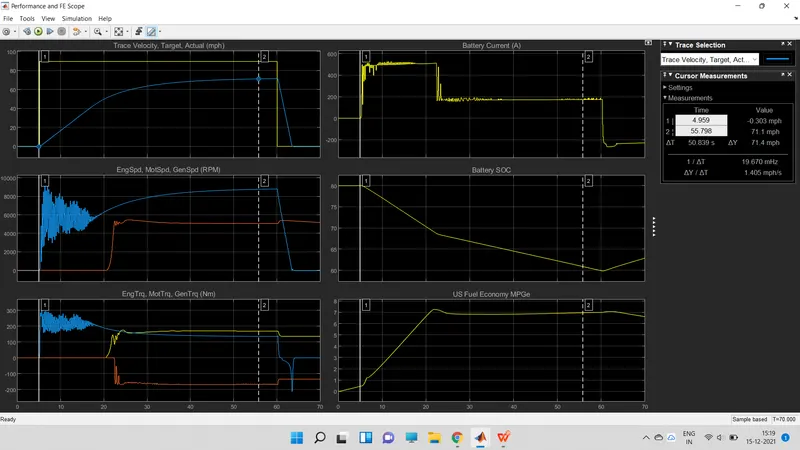
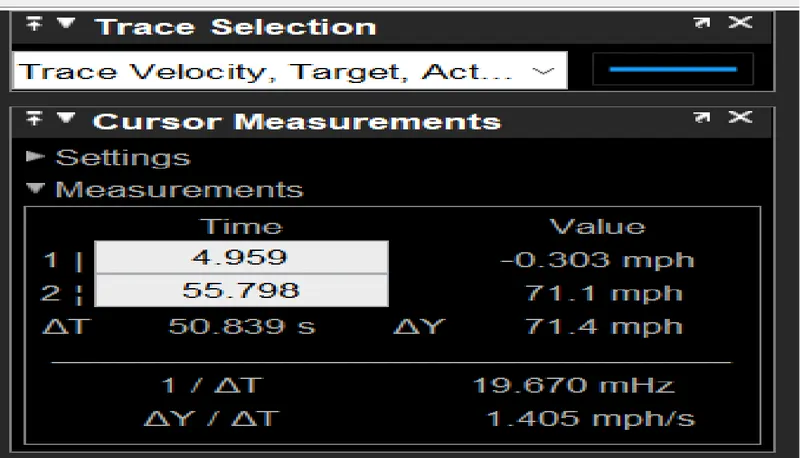
It takes around 50.8sec to reach the full speed ie,71.4mph.
In this case the vehicle attending the max 71.4 mph speed due to the grade and wind velocity.
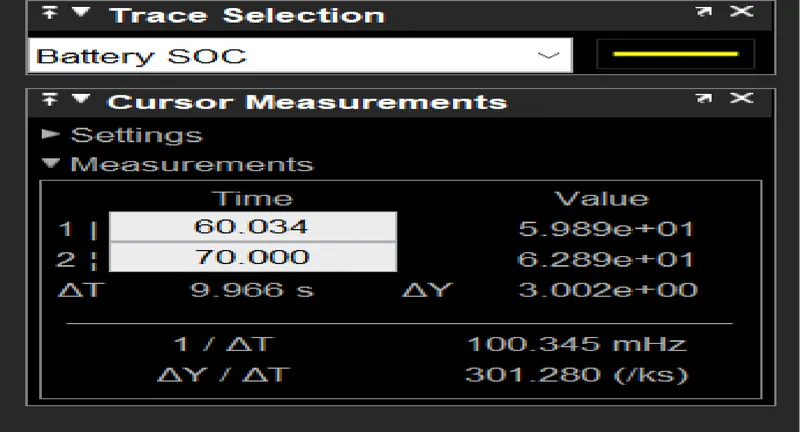
Intially the battery charge at 80%.it reduses to 60% to reach the full speed in a particular time .
ie, it uses 19% to reach the top speed.
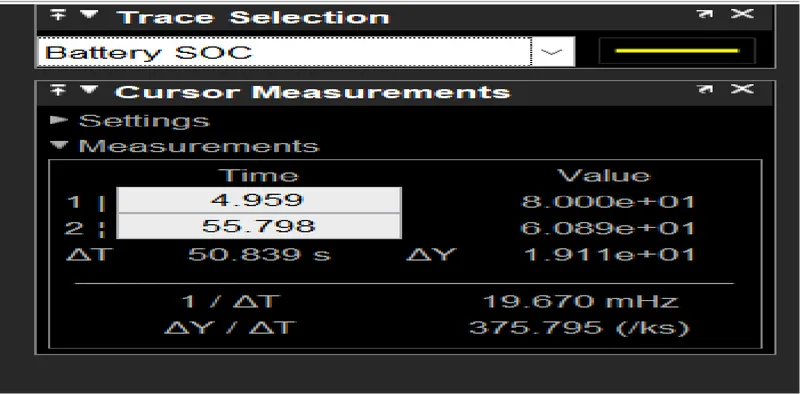
After the vehicle reaches to its top speed the soc it maintained constant .once the vehcle moves in decelarating region it chagers the battery .
The soc changes from 59 to 62 % ie, 3% soc incresed in decelaration .
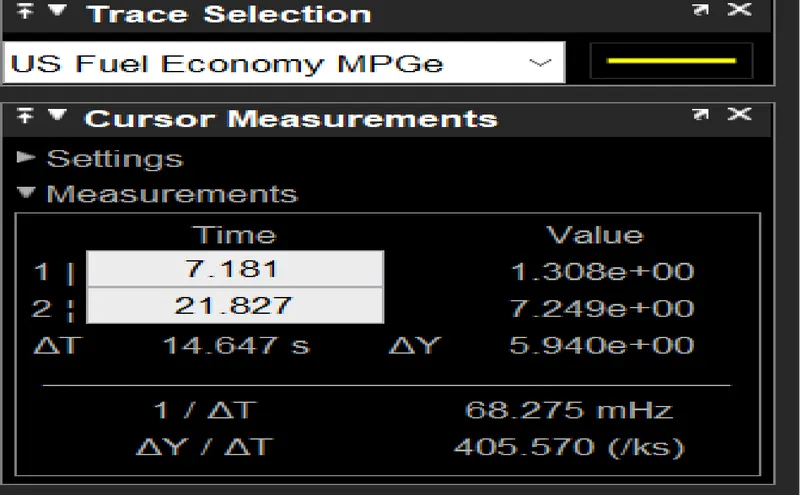
The fuel economy is increse to 5.9 MPG ,the motor runs the vehicle mostly .so it saves the usage of fuel.
From the above two cases i observed that:
The vehicle reaches to max speed when there is no grade ,if the grade is present the max speed is not achived by the vehicle.
It takes more time to full wot condtion when grade is present.
It require more SOC when grade is present compared to non grade condtion.
We have to definitely notice this the increse in soc is similar in both cases .
As the battery dischages quickly it effects the fuel economy ,so it reduces in the case of grade condition.
4.WHEN ALL PARAMETERS ARE SAME IN HEV & PURE EV :
The pure ev parameters are ploted below:
The pure ev consists of all blocks except engine and its controlling blocks.
PURE EV'S PERFORMANCE & FE PLOT :
The plot consists of diffrent vehicle parameters like speed ,torque ,velocity ,SOC,Battery current ,us fuel economy.
By using trace section we can understood diffent changes and parameters of vehicle .
All the plots are ploted wrt time on x-axis.
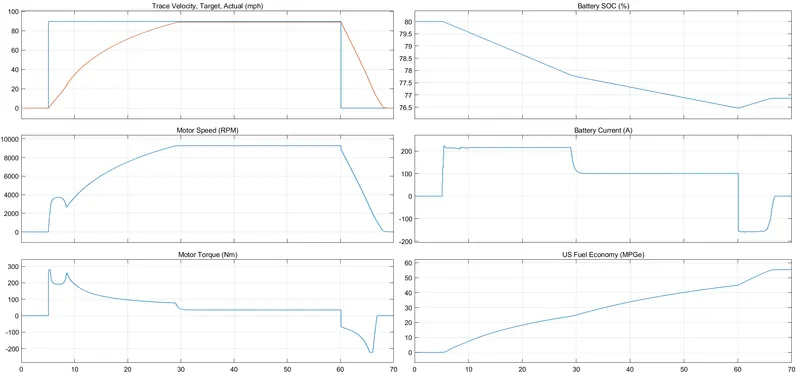
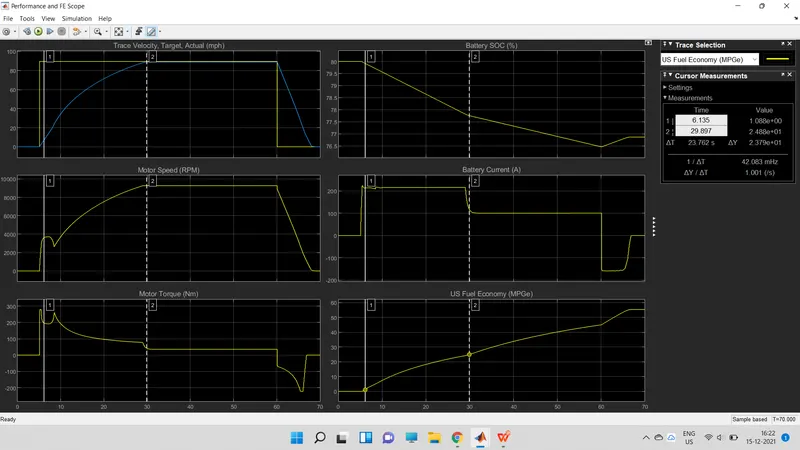
It takes around 23.76sec to reach the full speed ie,88mph.
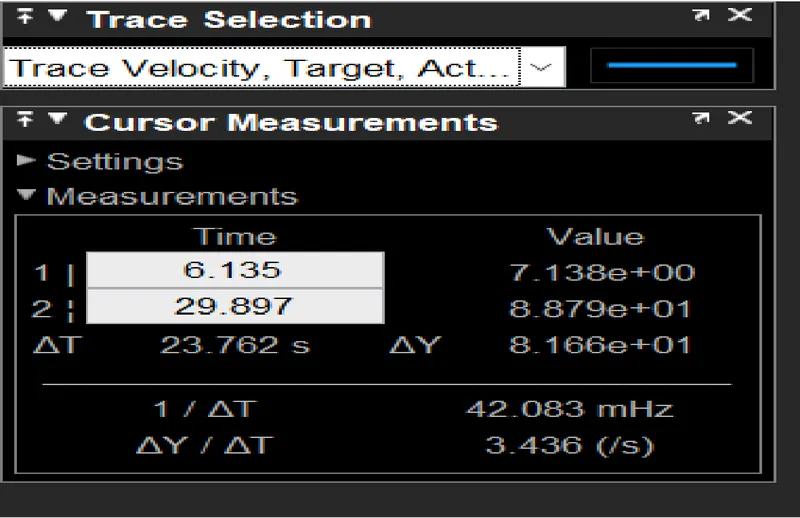
Intially the battery charge at 80%.it reduses to 78% to reach the full speed in a particular time .
ie, it uses 2.24% SOC to reach the top speed.
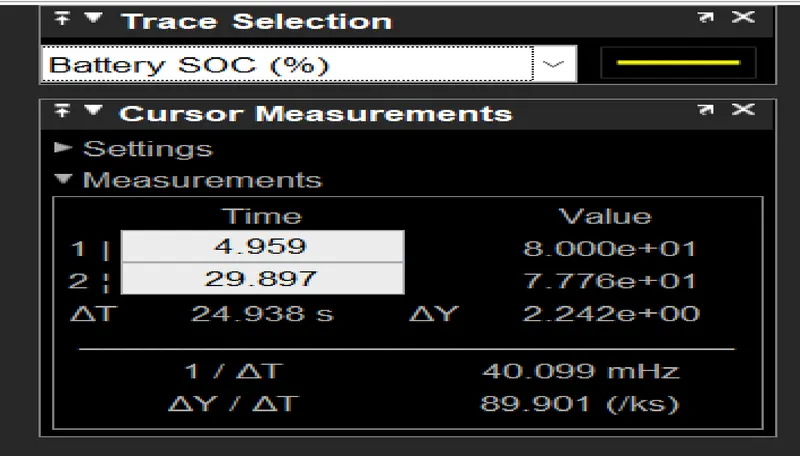
After the vehicle reaches to its top speed the soc it maintained constant .once the vehcle moves in decelarating region it chagers the battery .
The soc changes from 76.4 to 76.8 % ie, 0.39% soc incresed in decelaration .
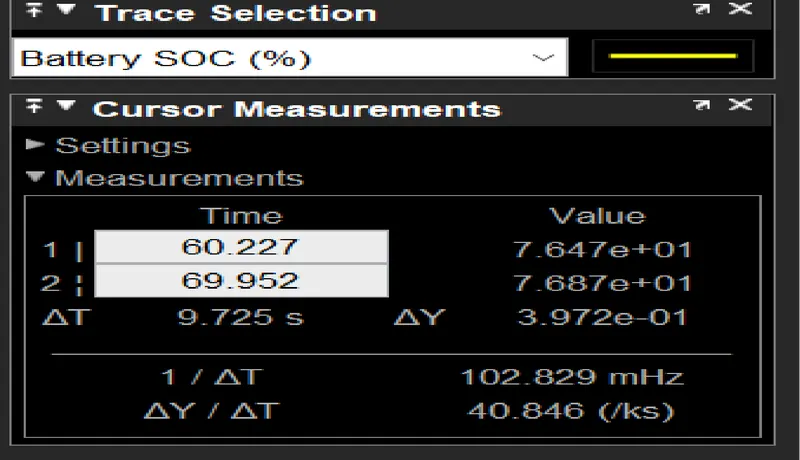
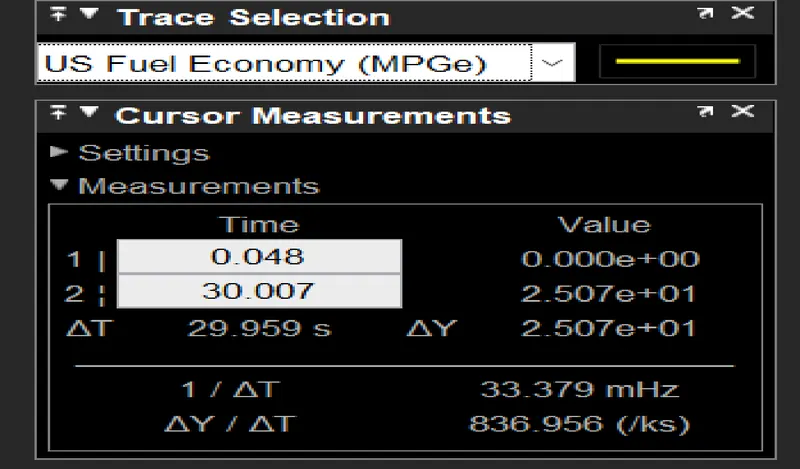
The fuel economy is increse to 25 MPG,the motor runs the vehicle mostly .so it saves the usage of fuel.
The vehicle reaches top speed in 23sec when there is no grade .But in case of HEV it is 20.3 sec to reach the same speed 88mph.
The pure EV use 2% of SOC for WOT condtion ;but incase of HEV it uses 12% of the SOC from this we understood that the pure Ev's have more SOC capacity batteries.
We have to notice this the HEV stores 2.7%SOC in deceleration period ,for the same period the pure ev 0.39% charge only.
The fuel economy is not desired in case of pure EV'S, it has less in case HEV .