Week 7 State of charge estimation
1.Simulate the 3 test cases from harness dashboard and write a detailed report on the results
ans:
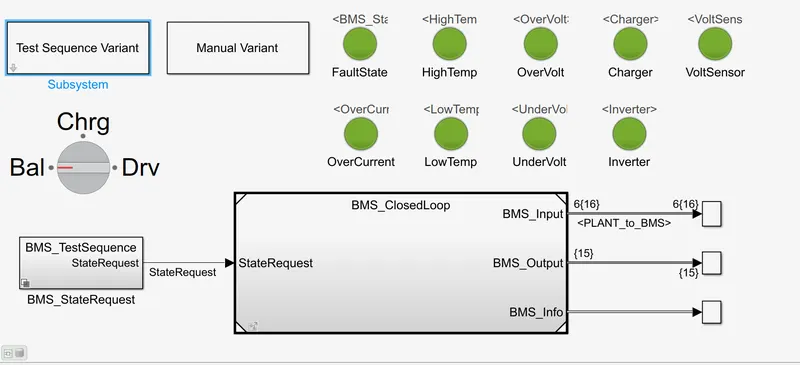
now at first have to simulate 3 test cases from harness dash board. we need to select the harness dashboard from we downloaded in the reference link.the first case battery model harnash dash is represented below.
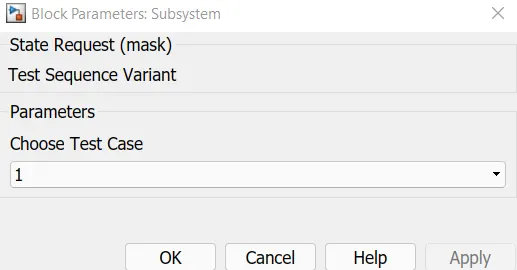
click on the sequence varient block and select test csae 1
now clicking on the bms sequence below we get the chart.

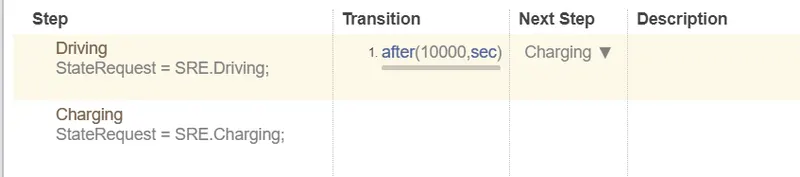
when simulation will start the model will be in driving condtition .after 3000 sec it will be in balancing mode and after 1000sec it will be in chaging mode .now by running the simulation.
results:
here all the indicators are green .so we can no errors and we chech the plot for the model and is shown in below.
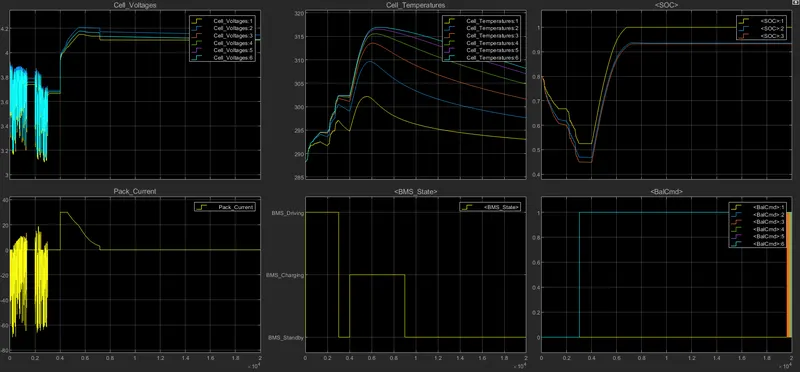
initially 90% the vehicle in driving and chagring condition. after chaging it reaches to standby mode.it can be seen in bms state plot.battery temprature increases in driving and charging .battery voltage increased to 4.2v while charge.current plot shows the value of current supplied to vehivcle while driving.soc dereases uo to 50% in driving condition and it was increased while charging.
2.in secon case:
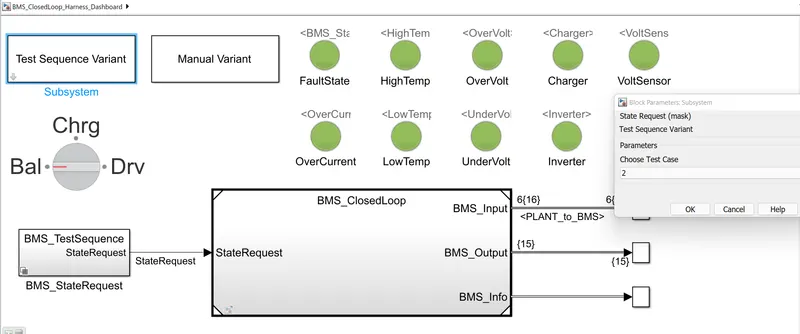
now clicking on the bms state request block
results:
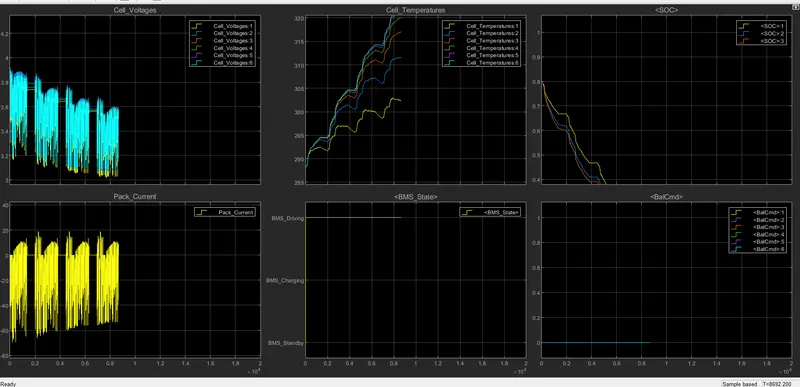
from the graph ,a fault condition occured in second case . so even after charing was started the soc didnot increase it continue to decreases.
now case 3:
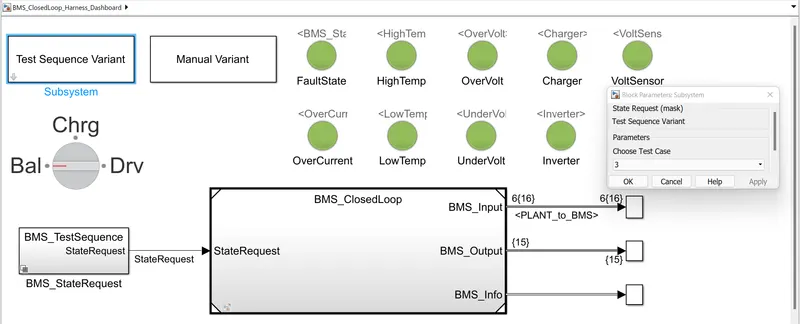

this condition has only one phase and that is chaging.thus 0 to 20000 seconds simulation runs.
results:
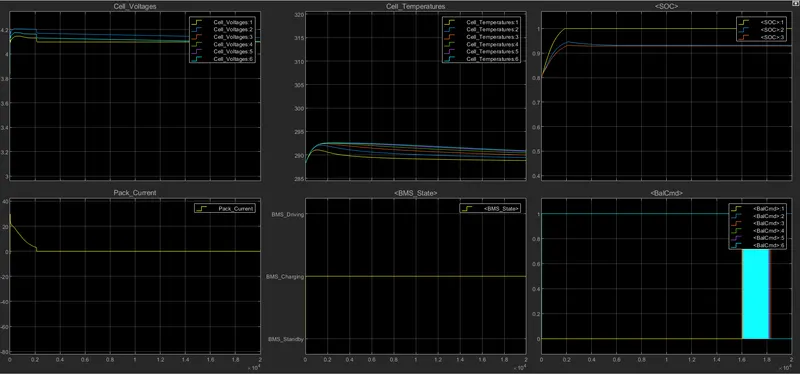
. here we can see the that soc reaches 100%in charging and remained in stand by mode. cell temp also decreases when stnadby mode was acheived.
from 3 cases we observe that only charging takes palce thus soc was 80% at first, then soc increases to 100% in 2000 sec then soc remains constnat at 100%.
2.What is coulomb counting? Refer to the above model and explain how BMS implements coulomb counting for SOC estimation ?
Coulomb counting
The ‘coulomb counting’ or CoulCount method was developed by Schmitt et al.18 as a heuristic method, although the underlying theory is reasonably accessible.19 It depends on the recording of the current noise only. The signal is filtered with a high-pass filter with a cut-off frequency of 0.01 Hz. The filter may be either analogue (although the implementation of a good-quality 0.01 Hz analogue filter is difficult) or digital. The absolute value of the measured current samples is then summed over time. A steep slope is taken as an indication of rapid corrosion, although it is not possible to calibrate this in terms of an estimated corrosion rate.
It can be shown that this method is similar to integrating the standard deviation of current over time.19 The use of the integrating plot provides a form of low pass filtering that may make it easier to see trends, but this can also be accomplished by digital filtering. The use of only the current noise restricts the value of the technique, as it does not allow for the estimation of the noise resistance (and hence the corrosion rate), and it is difficult to see what real advantages the method has over the conventional threeelectrode method, although the use of integrating plots may be of value.

for example we can look into the project file we downloaded .a bms system in the file is represented below.
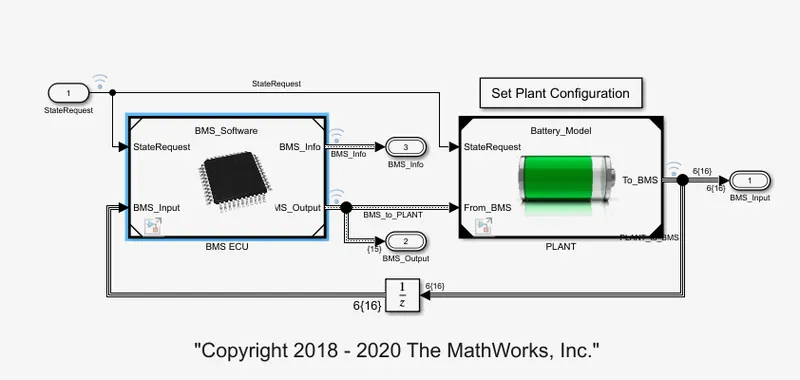
bms alogorithum models,protects, reports the measurment from the battery pack
by clicking on the bms ecu we get the sub system
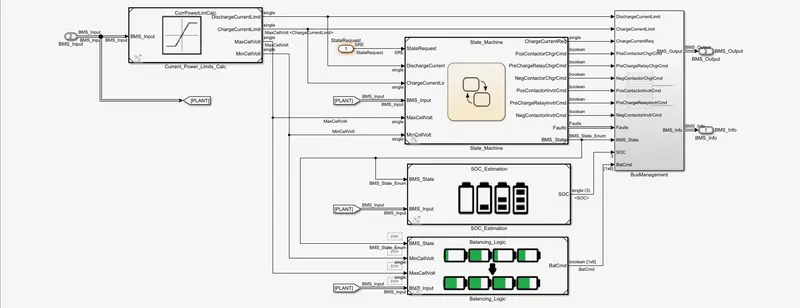
by clicking on the soc estimation block we get
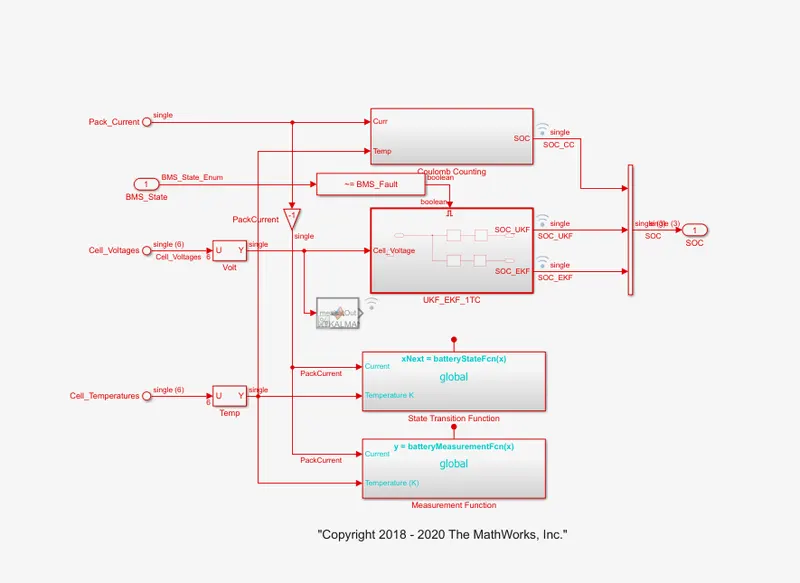
from the figure we observe the coloumb counting block
a subsystem opens when we clicking on the coloumb charging
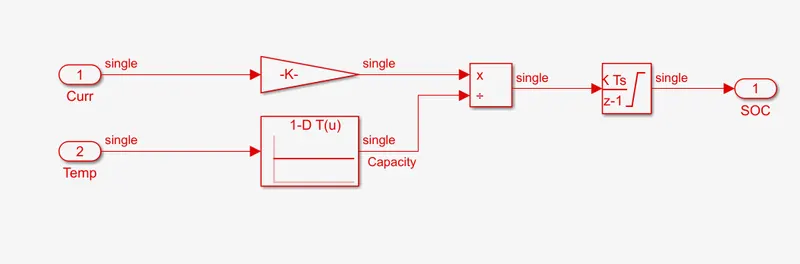
1.the system does the estimation by coloumb counting equation mentioned above.
2.advantage of coloumb counting method is its simplicity and low computation cost.
3.temp and current from the battery is given as inputs.
4.current signal is given to a gain block and temp is given to capacity since it varies according to temprature.
5.the i/p are given for integration where current will be integrated with respect to time
6.this output is given to anouther block where it is divided by capacity.
7.hence the soc is estimated.