Week 7 State of charge estimation
Aim : 1.Simulate the 3 test cases from harness dashboard and write a detailed report on the results
solution :
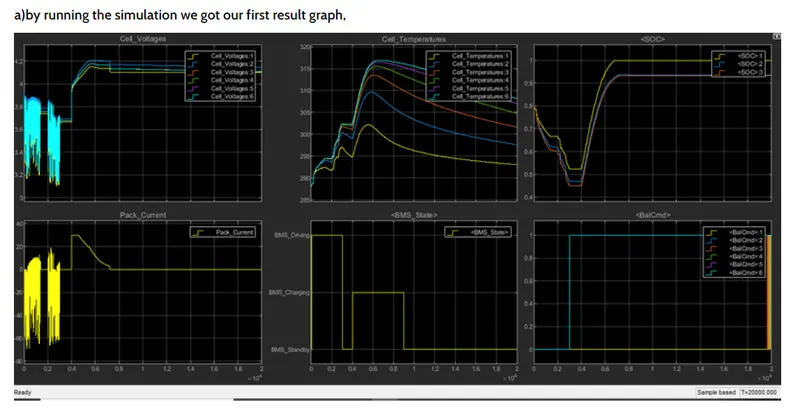
observation : As simulation ends we got 6 reasults graph considering BMS capital is an operation for electric vehicle
1st graph indicates the cell voltage of all the cell involve in the battery pack we first observe that cell voltages charging as the current folllowing in and out. At the beigning of the simulation, the voltages are slightly different because we initialize the model with a slight associate of imbalance the volategs are deflecting fromm the range of 3.1v to 3.9v for the time period of 0.3 *10^4sec and then there is balances state of all voltage of their respective cells and their is sudden hike in cell voltage till they reach 4.2 volt and at end of the simulation, the values conversion towards one another and trying to balnce the voltages still end . still there is a small differnce in there voltages and voltage lineclosed between 4 to 4.2v because the system goes on stand by mode.
In charging state during the constant current phase current (current is deflective in the range of 19A to -70for 0.38*10^4)is debeated. because the maximum cell voltage is high , enough compaired to prescribe 4.4v limit that an excessively high. current controlled the voltage behind the threshold significantly limiting the life of the battery.
Observation :
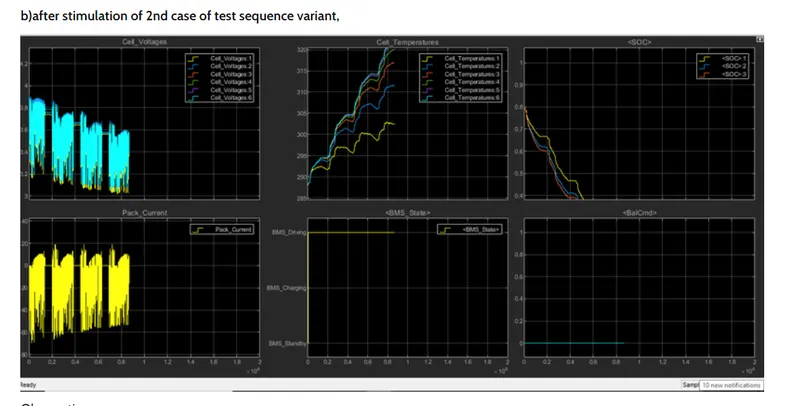
- At the initial state the voltage of all the cells are deflecting in the same manner and dropping slightly in the range of 3 to 3.9v It has 4 fraction zones and in between each of this fluctuating zone, they are stable for while and this phase last for 0.85*10^4sec
- On the other hand the current graph has exactly flowed in the same manner but in the opposite direction when voltage is getting drop current require is high and current flows in the range of -70a to 20A.
- In other scope indicates the bms state at each of the balance command signals respectively.whereit is on driving mode and command signals on zero lines.
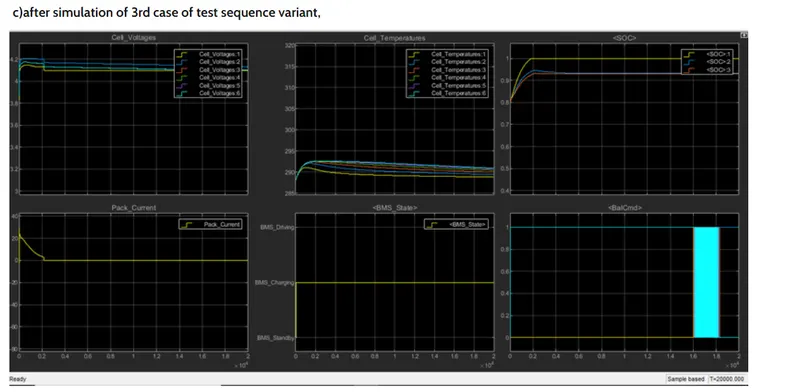
All the cells are initiated with a different voltage the where 6the ne having higher voltage of 4.2v and 1st one having near about 4.1v and remaining falling under this range BMS on charging state throughout the simulation.
so the voltage graph move along in a straight line beacuse the voltage supply continues there have some deflection of voltage lines of different cells but that is a very less amount of change in voltage at the end of the simulation BMS trying to balance the voltage very much.
The other scopes indicate the BMS state at each of the balance command signals respectively. bms on chrging state and battery command passing signal between 0 to 1.
QUESTION 2 :
What is coulomb counting? Refer to the above model and explain how BMS implements coulomb counting for SOC estimation ?
ANSWER : SOC estimation in the BMS model
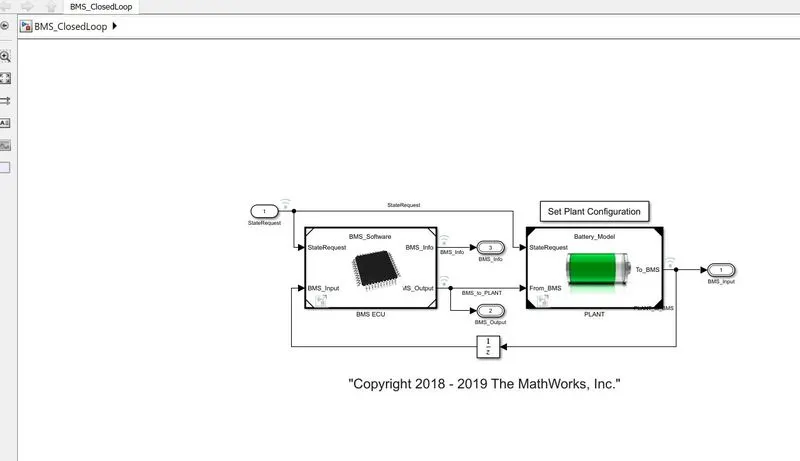
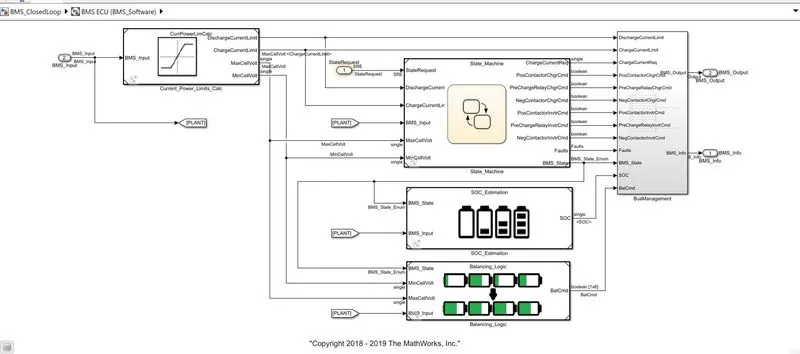
It is shown as below
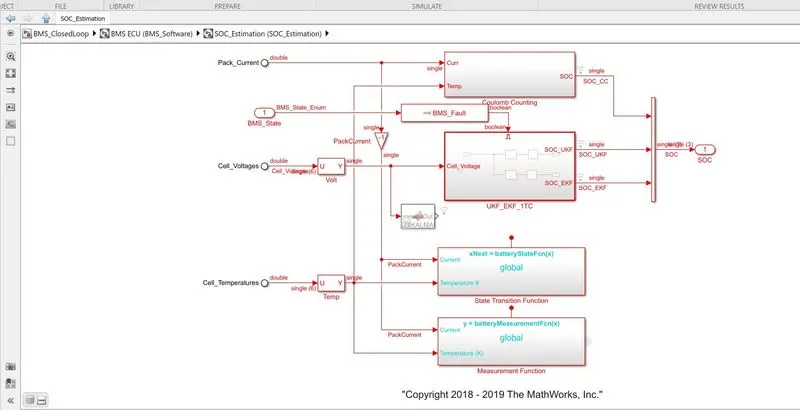
coloumb counting :
SOC is defined as the rate of available capacity to its maximum capacity when a battery is fully charged and describe the remaining % of the battery.
To fine this SOC % we are using coulomb counting method.
THe coulomb counting method measures the discharging current of the battery and integrates the discharging current time in order to estimate SOC.
which can be estimated from discharging current (I(t)).previously estimated soc values. The relation can be given as
SOC(t) = SOC(t-1) +I(t)/Qn*t
Modified coloumb counting :
IN this technique discharge current is corrected with a function and corrected current is found out for accurate SOC estimation.
The function canbe given as,
Ic(t) =k2I(t2)+k1I(t)+k0
where k0,k1,k2 are constant values obtained from the practice experimental data.
the SOC relation can be given as
SOC(t) =SOC(t-1)+Ic(t)/Qn*t.