Week 7 State of charge estimation
Harness dashboard: This is a testing harness model with BMS closed-loop model. This dashboard tells the present status of the battery management system. If all status LEDs are in green colour this means there is no fault and if any LED is in red colour this means there is a fault. We can also see the BMS status if the system is in driving mode, charging mode or balancing mode. We can select the Test sequence also. There are three test sequences as shown below.
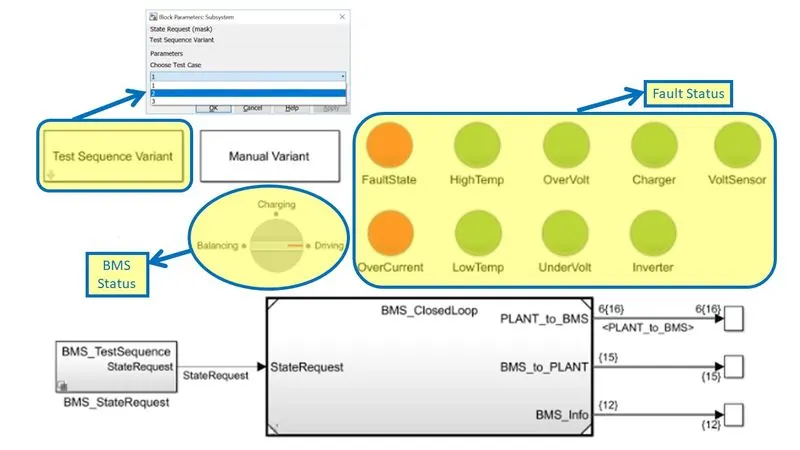
BMS closed-loop Model:
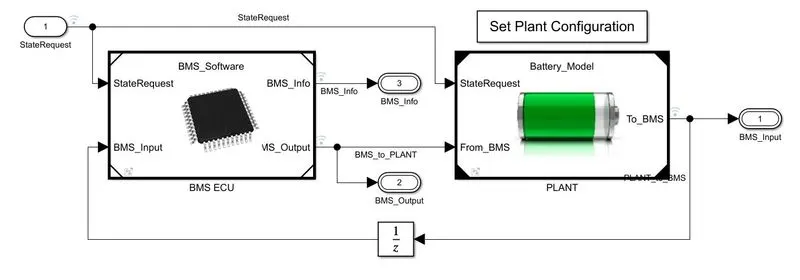
This is a battery management system model available on the Matlab website. In this model, there are two blocks: BMS ECU and Plant. BMS ECU is a battery management system electronic unit, which is software simulated in a Simulink environment and the plant is actually the battery pack block with a precharge circuit and through the precharge circuit, the battery pack is connected with a charger and load (motor).
The battery pack module is having two configurations: (1)one module of 6 cell series, (2) 16 modules of each having 6 cell series (96 cell series)
The three test sequences in the BMS Harness dashboard are:
1.) Test Sequence 1: It is having first driving then balancing after a transition of 3,000 sec then charging and balancing after a transition of 1,000 sec then post charge balancing after 5,000 seconds
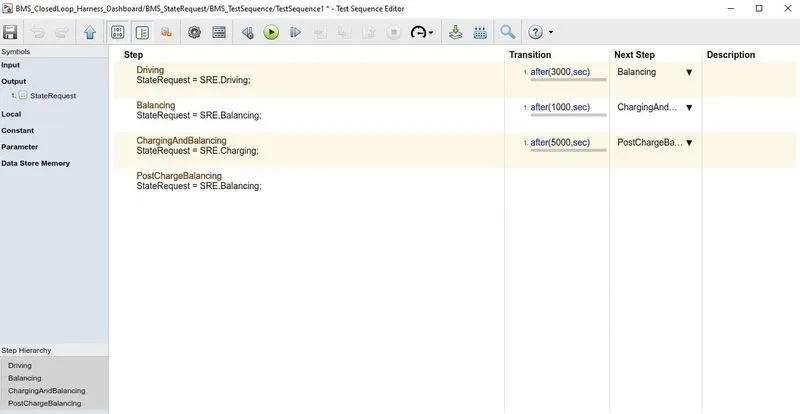
Results: Run the simulation and results are shown below:
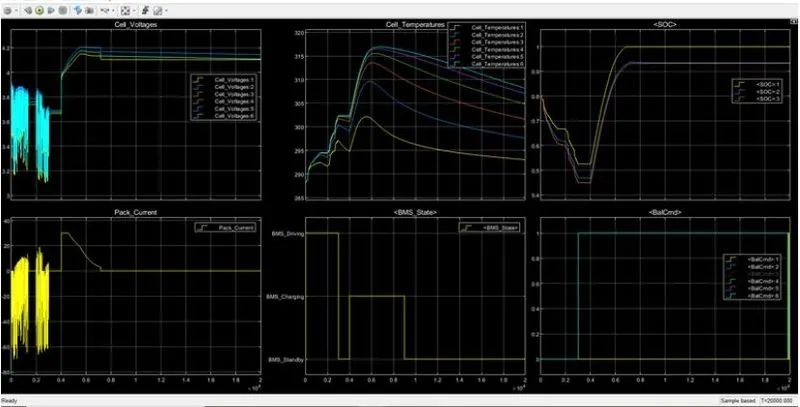
From the Results we can understand that For first 3000secs all 6 cells are in drive mode where discharging occurs majorly and in standby mode for lesser duration at approximately 1000 to 2000 secs. The voltages changes from a minimum value of 3.1V to a maximum value of 3.9V.
From 3000 secs to 4000secs cell balancing occurs and voltage is constant at nearly 3.7V.
After 4000secs charging occurs,the voltage is increased from 3.7V to 4V. The constant current of approximately 30A is applied from 4V to 4.2V and when the volatge is 4.2 V and becomes constant, the value of current reduces from 30A to 2.6A at end of the charging and cell balancing occurs upto 9000Secs.
After 9000 secs post charge cell balancing starts. All cell voltages are balancing to a voltage with respect to cell 1 to 4.1 V.
Initially for 3000Secs the temperature range of cells increases gradually from ambient temperature 288K to 302K.
The temperature of cell 1 is lesser and cell 6 has higher temberature for all stages.
2.) Test Sequence 2: It is having first driving then charging after a transition of 10,000 sec
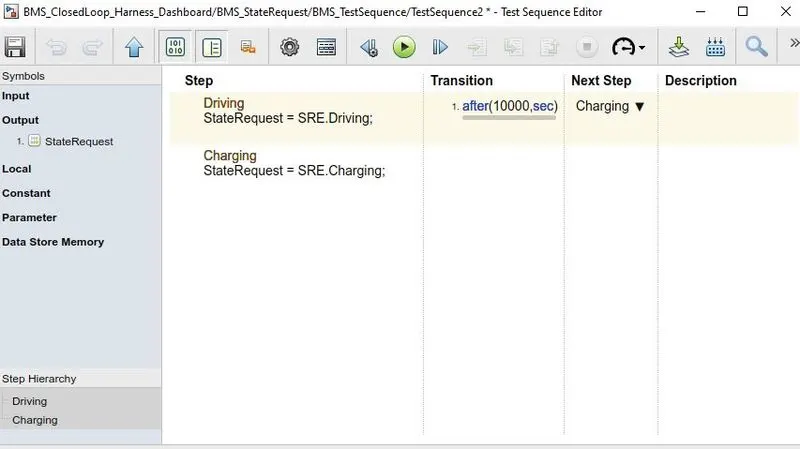
Results: Run the simulation and results are shown below:
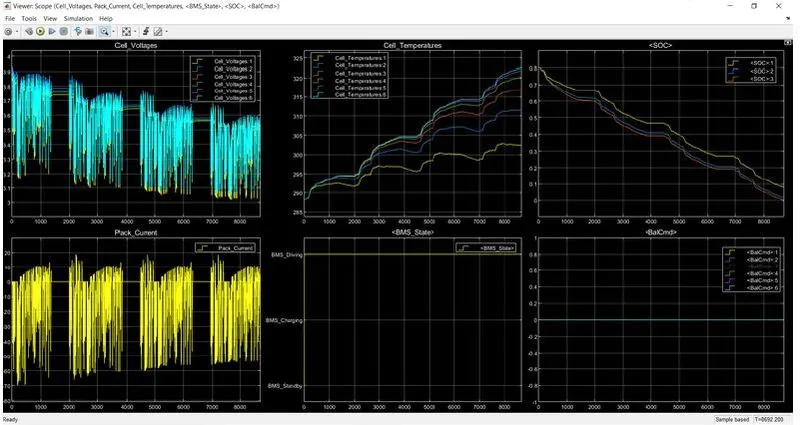
The cell voltages reduces from maximum of 3.9V to 3.05V as cutoff voltage upto 9000 secs. Entire capacity drained at 9000 secs.
The pack current discharges upto 70A and slight charging occurs during the overall drive.
Here cell 1 having lesser temperature variations from 288K to approximately 302.5K.
Cell 6 is having higher temperature variation from 288K to approximately 322.5K.
3.) Test Sequence 3: It is having only charging
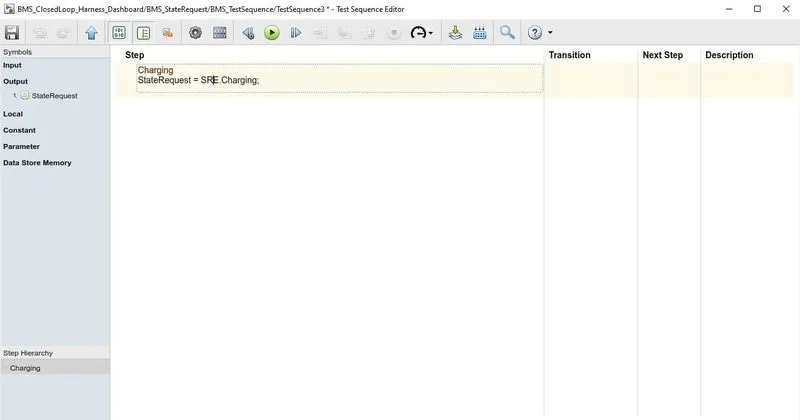
Results: Run the simulation and results are shown below:
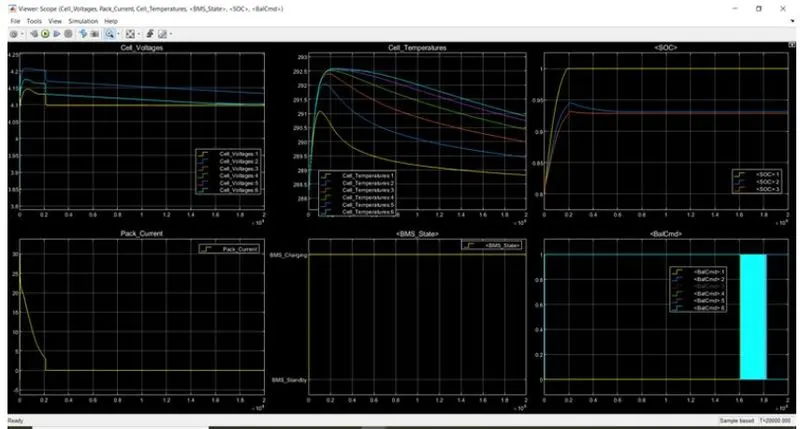
Initially cell 2 , voltages increases from 3.9V to maximum 4.2V and stabilised to a value of 4.15V. Cell 1 voltage increases from 3.85V to 4.1V and stabilised to 4.08V.
The battery pack current increases from 0A to 30A and starts to reduce to 2.5 A gradually at end when the pack starts to get charged fully till 2000 secs and at 2000secs the pack is fully charged to 100%.
The cell temperatures continue to increase heat upto full charge and after that the temperatures get started to reduces to ambient temperature
Coulomb counting: Integrating the current into or out of a battery gives the relative value of its charge. It is similar to counting currency in and out of a bank account that tells the relative amount in the account. The coulomb counting needs an initial value to start measuring, like any other definite integral. To calculate the charge taken out or put in the battery, the initial charge of the battery must be known. For example, a battery is charged for 4 hours using 3-A current then we will add 3 * 4 = 12 Ah charge to the battery. This means the SoC of the battery is increased by 12Ah or can also be said that battery DoD is decreased by 12 Ah. Without knowing the initial value, we can not obtain the final value of the charge.
SOC(State Of Charge) is defined as the rate of available capacity to its maximum capacity when a battery is fully charged and describes the remaining percentage of the battery capacity.
To find this SOC % using coulomb counting method. In the coulomb counting method it measures the discharging current of the battery and integrates the discharging current over time in order to estimate SOC. Thus is estimated from discharrging current (I(t)), previously estimated SOC values (SOC(t-1)). The relation can be given as,
`SOC(t) = SOC(t-1) + frac{I(t)}{Q_n} trianglet`
.