Week 7 State of charge estimation
Aim: Explain the Coulomb Counting and explain the BMS implements coulomb counting for SOC estimation from model.
Objective:
- Simulate the 3 test cases from harness dashboard and write a detailed report on the results
- What is coulomb counting? Refer to the above model and explain how BMS implements coulomb counting for SOC estimation ?
MODEL SETUP
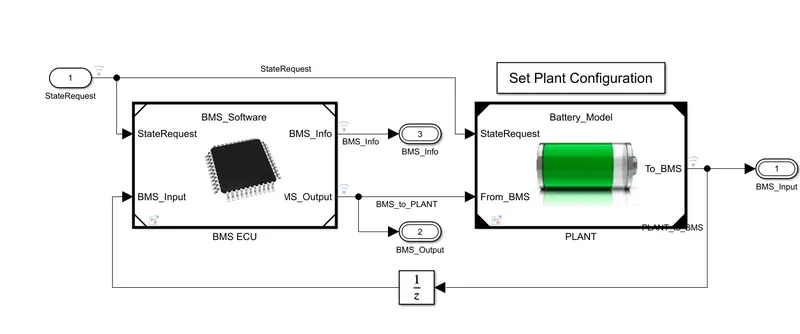
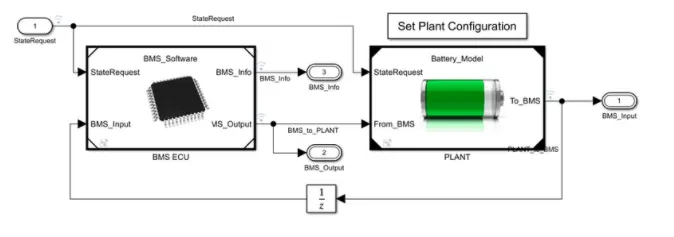
The above model has the Battery Manegment Ststem(BMS)ECU blocks which does the computations. The palnt block represents a battery pack.
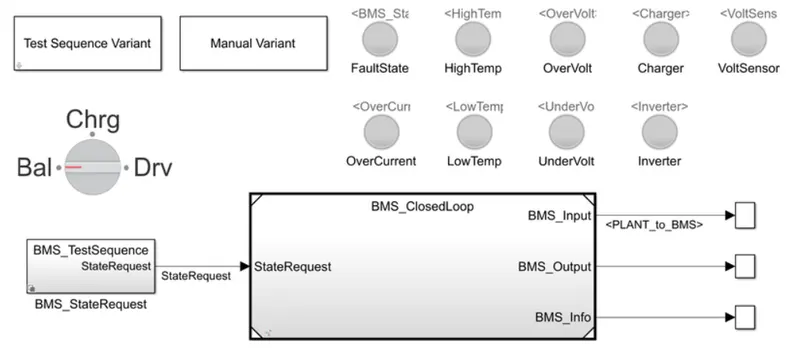
This is the dashboard which represents the dashboard in the vehicle.It indicates the battery states-Balancing,Charging and Driving. There are LEDs to indicate any faults or errors and for other purposes.
Procedure:
- There are 3 test cases or sequences. Each serquences is with a different algorithm.
- Test case 1 is Driving_ Balancing-Charging-Balancing.
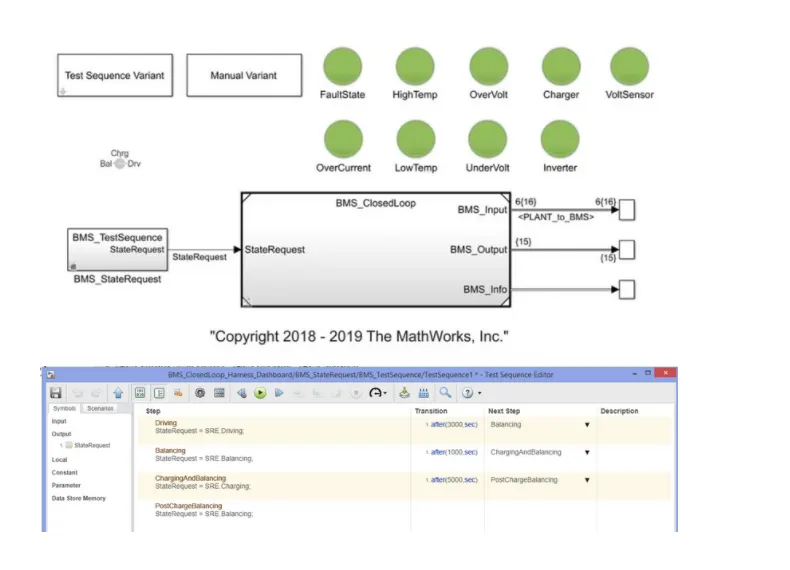
- Test case 2 is Driving-Charging.
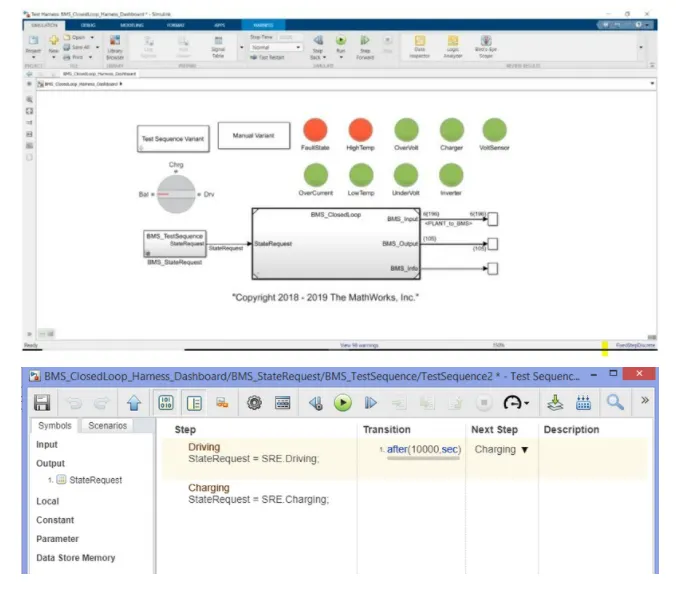
- Test case 3 is Charging only.
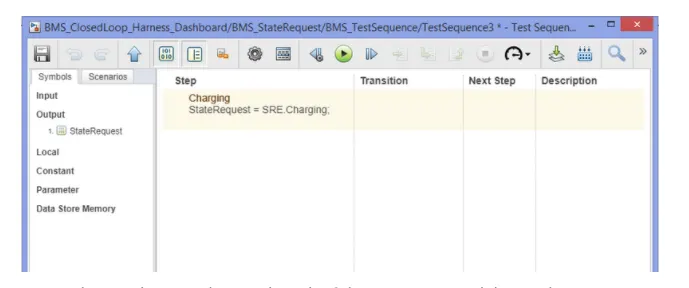
- The simulation is done with each of the sequences and the results are analysed.
Results:
Test case 1: Driving-Balancing-Charging-Balancing.
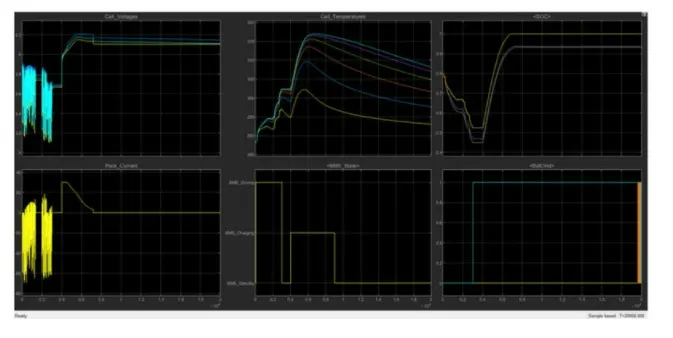
Graph 1 indicates the cell voltage of the cells present in the battery pack when the simulation begins initially the vehicle is in a driving state and SOC will decrease for this time period. We first observe that cell voltages are changing as the current is flowing is flowing in and out of the cell at the beginning of the simulation the voltages are slightly different because we initialise the model with the slight associate of imbalance the voltages are deflecting and then there is a balance in the voltage then there is a sudden rise in Sel voltages Till they rich 4.2 v this is because after a time period of 3000 second the next step is balancing more and the vehicle is in standby condition after another 1000 seconds the vehicle is in the charging phase and the battery yes you see e increase this almost 200% at the end of the simulation the value coverage towards one another this indicates that voltage are getting balance but still at the end there is small difference in their voltage is and the voltage line flows between 4 to 4.2 v.
Graph 2 shows charging state during the constant current phase current .Graph 3 shows the temperature traces showing the significant discrepancy e between the hottest and col coldest cell the reason is mainly because of symmetry in the merger layer in terms of thermal behaviour the sale number 6 it significantly shorter than sale number 1 because it is thermally insulated on one side even if the maximum temperature reached during the simulation is not concerned in terms of safety the temperature difference at cell number 6 at its higher temperature will eventually cost much faster degradation of sale degradation of cell 6 compare to cell 1 this leads to undesirable and unevenness in sale conditions therefore we need an active thermal management system to keep thermal differences within a few degree Celsius graph 5 shows the SOC of battery cells the initial SOC is 75% however the simulations estimate need to initialise it to 80% to said their capability to recover The Other scopes indicates the BMS state at each of the balance command signals respectively.
Test Case 2: Drive-Charge,High-temperature fault:
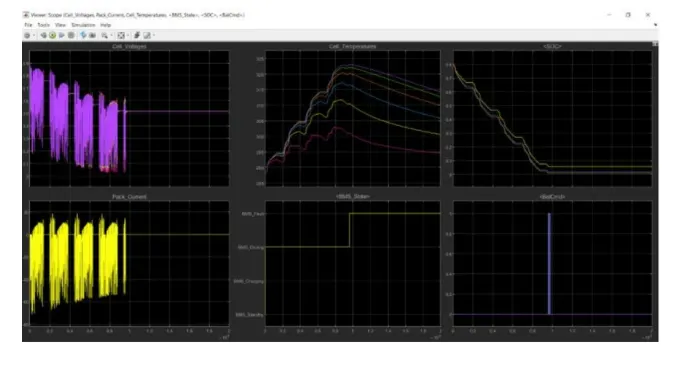
In graph when the initial state of voltage of the cells are deflating in the same manner and dropping slightly e it has 4 fluctuations zones and in between each of these fluctuations zones they are stable for a while the sales are initially at 80% and then they are falling at different time periods to their capability of recover other scope indicate BMS state at each of the conditions.
Test case 3: Charging:
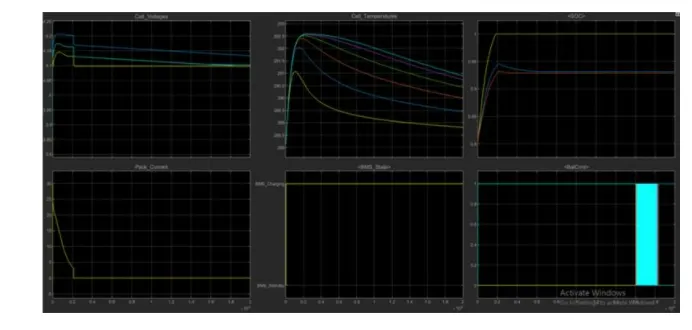
From the above graph all the sales are initiated with in with the different voltages the where the 6 the one having the higher voltage of 4.2 volt it and the first one having near about 4.1 v and remaining falling under this range BMS on charging state throughout the simulation so the voltage graph moves along in a straight line because the voltage supply continuous there are some deflection of voltage line of different cells but that is very less amount of change in voltage at the end of simulation BMS tries to balance the voltage the battery pack current is initiated with 20 a and the and then it falls 20 current till end of the simulation then there is a constant current because the battery is put in charging graph shows the temperature of the sales the sales initiate at 27 degree celsius temperature and then all the cells usually see a decrease in temperature the temperature difference at cell number 6 at its high temperature will eventually cause much faster degradation of cell 6 compared to cell 1 leading to undesirable and unevenness in cell condition therefore need and active thermal management system to keep thermal difference within a few degrees celsius the initial SOC of three different cells is at 80% has the system is put on charging State the SOC increased 100 % the others scopes indicate the BMS state at each of the balance command signals respectively BMS on charging state and battery command passing signal between 0 to 1.
Coulomb Counting:
The Coulomb counting method is a method used to measure the discharging current of a battery. The method integrates the discharging current overtime to estimate SOC. The coulomb counting method is carried out to estimate the SOC at time t, which is estimated from the discharging current,I(t),previously estimate SOC values,SOC(t-1).SOC is calculated by:
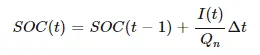
There are several other factors affecting accuracy of the Coulomb counting method including temperature,discharge current,battery history,and cycle life.
Limitation of Coulomb Counting: Coulomb Counting can be a very accurate technique,but it has its limitation:
- Leakage current within a cell does not go through the current sensor and is therefore not taken into account.
How BMS implements coulomb counting for SOC estimation:
- The system does the estimation by coulomb counting equation.The advantages of the coulomb counting method is its simplicity and low computational cost.
- In side BMS ECU block,we have the SOC estimation block.
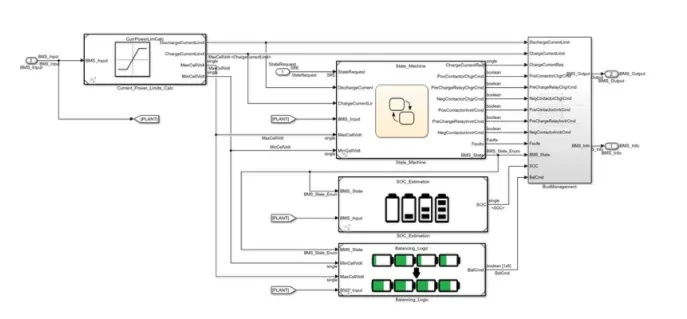
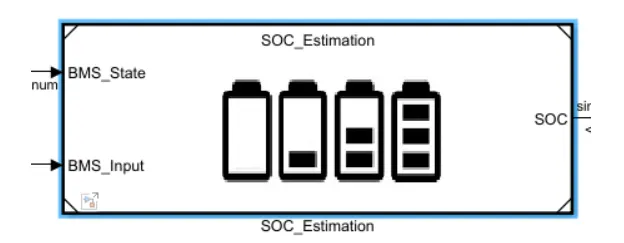
- Within the SOC estimation block,we have the Coulomb counting,which is a sub-system.
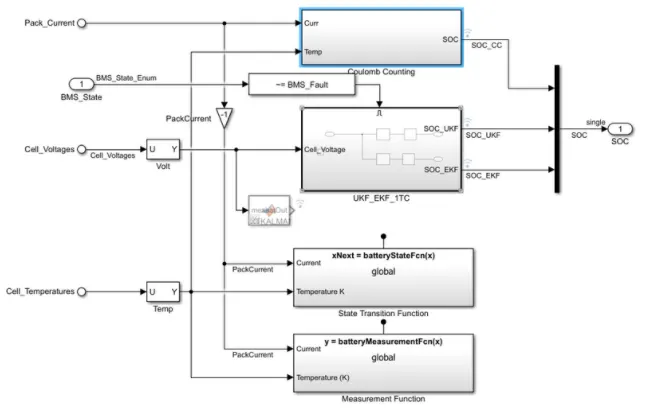
- Within the coulomb counting the SOC estimation is done.
- Temperature and current from the battery is given as inputs for coulomb counting.
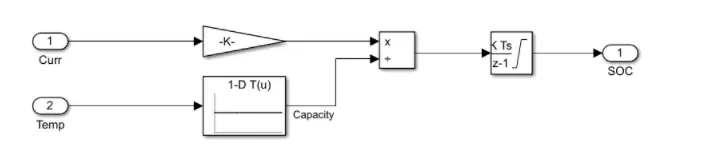
- Current signal is given to a gain block.
- These inputs are given for integration where current will be integrated with respect to time.
- This output is given to another block where it is divided by capacity.
- This way the SOC is estimated.
Observation:
Test Case 1:
- During charging the battery pack voltage is increased up to 4.2 V.
- The input cycle can be seen in the BMS_State plot in which the vehicle initially undergoes driving,then charging till SOC becomes 90% and then later in the standby state.
- The cell temperature increases during the driving and charging cycle and starts falling off in standby mode.
- The SOC drops to less than 50% after the driving cycle and then later put into charging until SOC reaches 100%.
- The current supplied to the vehicle during the driving phase can be seen in the current plot.
Test Case 2:
- After 10000 sec when the driving cycle is over the fault condition occurs and so the SOC does not increases even for the charging phase.
- Cell temperature increses during driving,and since it is higher than recommended BMS stops the battery from charging so we can see a gradual decreases in temperature.
Test Case 3:
- The SOC increases from 80 to 100% and then remains in standby mode.
- During charging SOC increases from 80% to 100%,temperature increases during charging and reduced in the standby state of the BMS.
Conclusion:
From this i understand the coulomb counting method and how this method is used to estmate the SOC of the Battery.